


Welcome to the Artificial Intelligence Outlook for Forex trading.
VIDEO TRANSCRIPT
Wisdom Tree US Dollar Bullish Fund – $USDU ETF
Okay, hello everyone and welcome back.
My name is Greg Firman and this is the Vantage Point AI market outlook for the week of April the 13th, 2026.
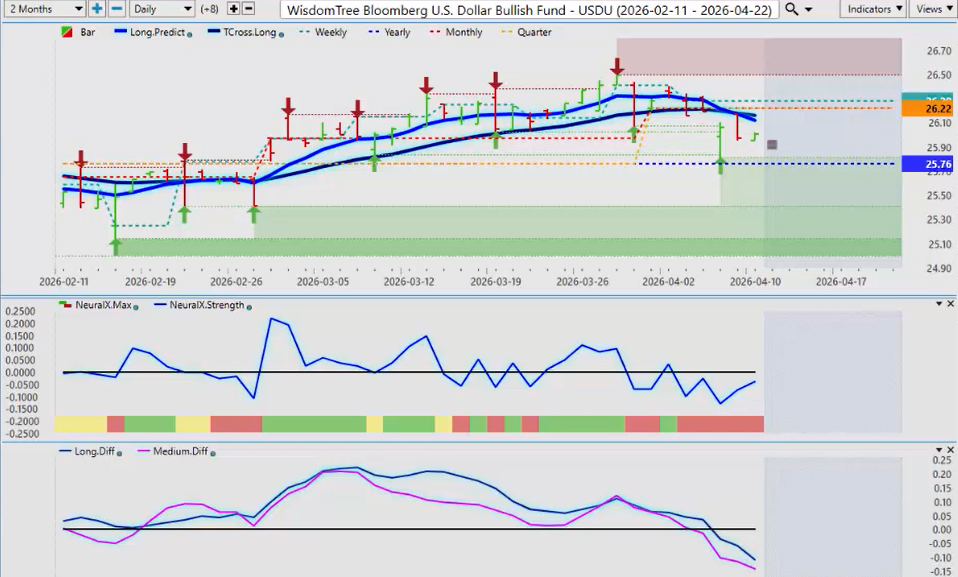
Now, to get started this week, we’ll begin where we always do with that very important dollar index. We’re going to use the USDU this week again. Now, we’ve had a move lower on the dollar.
Things are maybe settling down in the war between the US and Iran and Israel. We’ll see where this goes this coming week. So far, at least on Saturday afternoon on 1:00 when I’m doing this presentation, everything seems to be pretty calm. So, we’ll go with that that the dollar will continue its move lower.
Now, again, we remain above 2576, but we’re negative on the quarter 2622. That’s the level you want to watch for next week. If we can hold below that then again the dollar will remain under pressure for at least probably the next few weeks until some kind of deal is hammered out between Iran and and the US. But again watch 2622
The main core indicators and vantage point neural index is down medium-term crossover long-term crossover. So it is looking rather bearish for the dollar at the current time.
Gold ($XAU/USD)
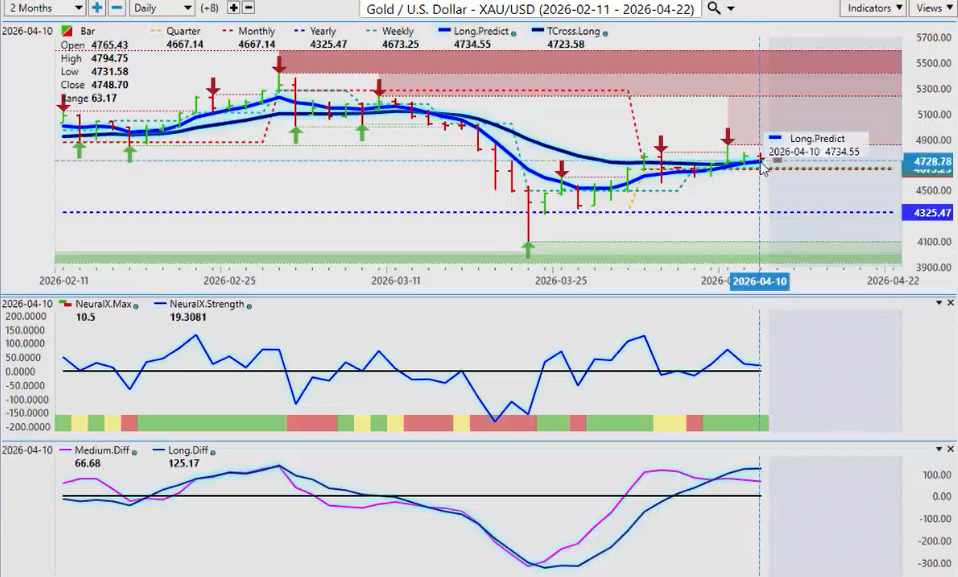
Now this should boost Gold. Gold is sitting very nice a very nice position here just above the quarterly opening price 4667 firmly above the yearly opening price 4325.
My only concern is this MA diff cross that is taking place right here. Now that’s likely just corrective in nature. But again even if the the US Iran war starts back up again I don’t think the dollar is going to be the one that benefits this time around. It is likely going to be Gold.
So again as long as we’re holding above these critical levels the tross long that’s coming in at 4723. We do look set to extend higher. We have a new verified resistance high 4853. If we can if and when we can clear that then we should start to see Gold slowly grind its way back to that 5,000 mark.
SPDR SP 50 SPY ETF ($SPY) and Russell 2000 Index
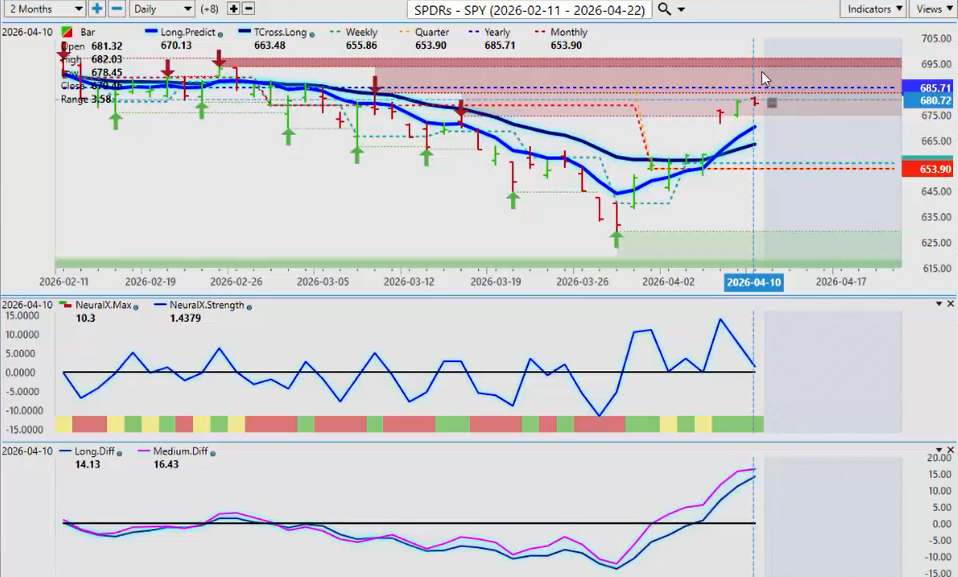
Now looking at some of the main indexes via the ETFs the spies and the Russell the SPY is again still below the calendar yearly opening price. One of the ways we can play this is putting buy stop orders above 6 68571 because again until we can get above that level and stay above it the primary trend is still down. Now again USI ran war goes away then that should support longs but again I would prefer the market get back up of its yearly opening price before I start buying this buy.
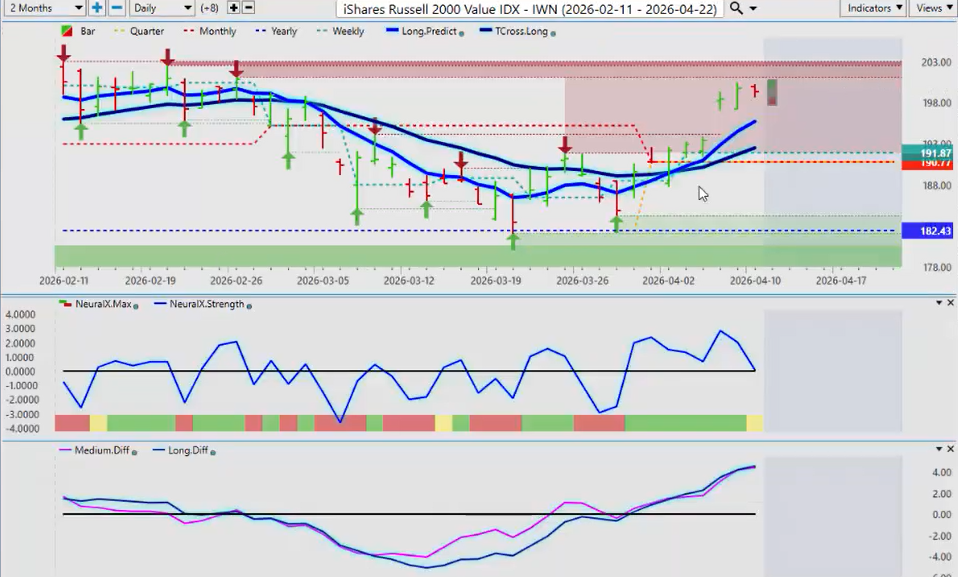
Now the Russell on the other hand is doing quite well. You can see structurally we’ve held above the yearly opening price this entire time during in the last two months during this war. We came back down touched the yearly opening price on March the 20th and then extended significantly higher. So again right now your support levels because once again I will always remind everybody this is an outlook not a recap of something that’s already happened.
This video is being done Saturday afternoon at 1:00 while the markets are closed. Okay. So again our our long predicted 195 tcross long 19248. Then we have our quarterly down at 190 and the yearly at 182. In my respectful opinion only longs are still favored while above that very important quarterly opening price at 19077.
Global X DAX Germany ETF DAX 30 and FTSE 100
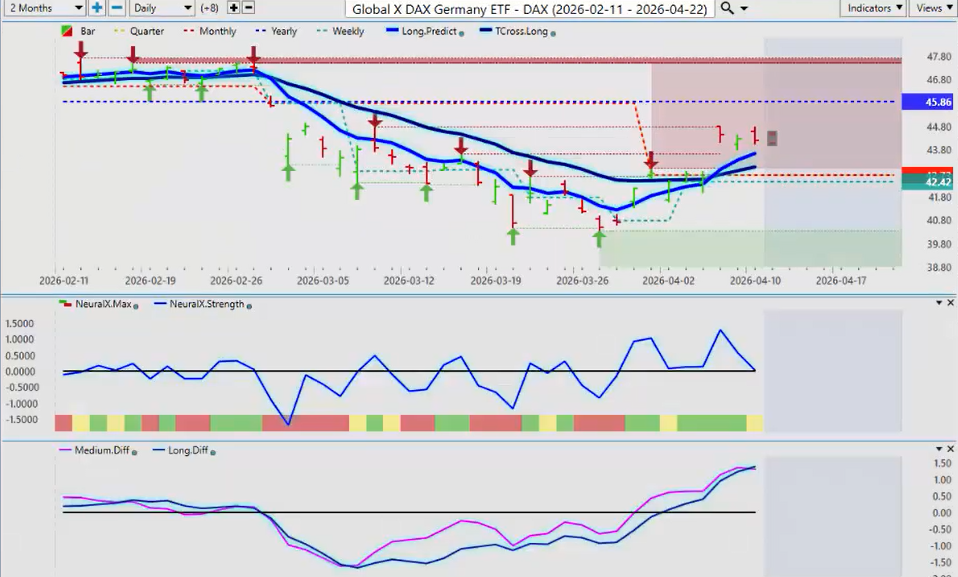
Now for my friends in Germany with the DAX once again the DAX is following the Euro higher. The UK Footsie 100 is the is the better trade currently but the Footsie looks pretty good also. So the S&P the Dow they can all move higher. The DAX will follow it.
But I will mention that the Footsie 100 has moved higher independently of all of these other global indices basically telling me there’s real demand there. Now the only the downside in the longs right now the DAX is basically caught between the quarterly opening price at 4273 and the yearly opening price which is coming in at 45.86. We need a break of either side of that guys to see the next move. The only concern I have with longs here is an MA diff cross. The pink line over the blue line is a warning sign that this could be getting ready to move lower. So again markets are still shaky with everything that’s going on between the US and Iran and Israel. But again buying the bottom here and if we can’t break through 4586.
But either way if you’re on the long side of this I think I would cut my longs at 4582 assuming we can get there and then reinstate them once we get a confirmed hold that we’re holding above that very important calendar yearly opening.
Volatility Index ($VIX)
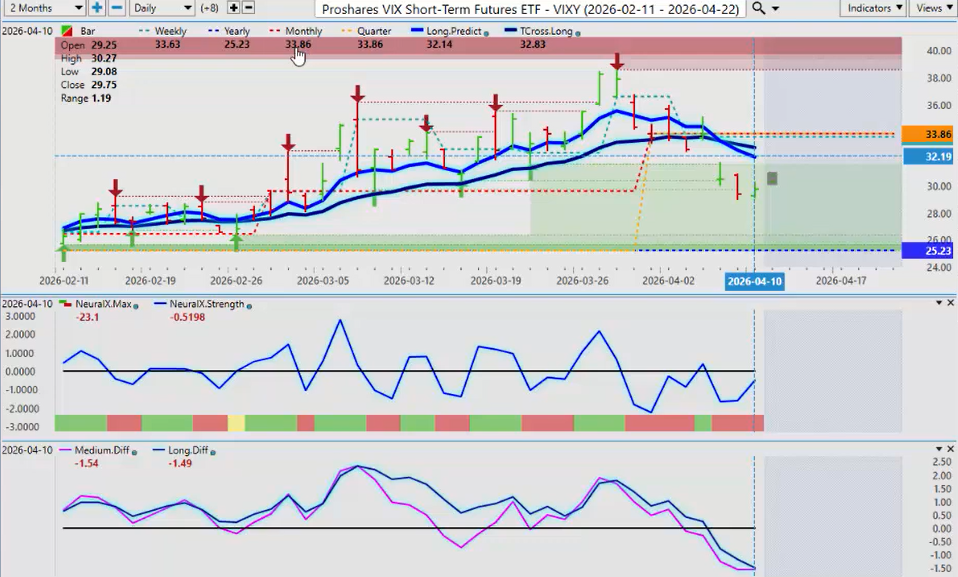
Now looking at the combining all this and looking at the short-term VIX the the VIX is negative on the quarter. As long as we’re holding below 33.86 the quarterly and monthly opening price the bias is to the downside supporting the global equity markets going higher.
Now again that MA diff cross that pink line over the blue line is a little concerning here guys. Okay. If that pink line crosses back up then we’re going to the very minimum we’re going to have a retracement back to the tross long at 3283. So be careful of that and keep a very close eye on that as we start moving on throughout the week.
Bitcoin ($BTC/USD)
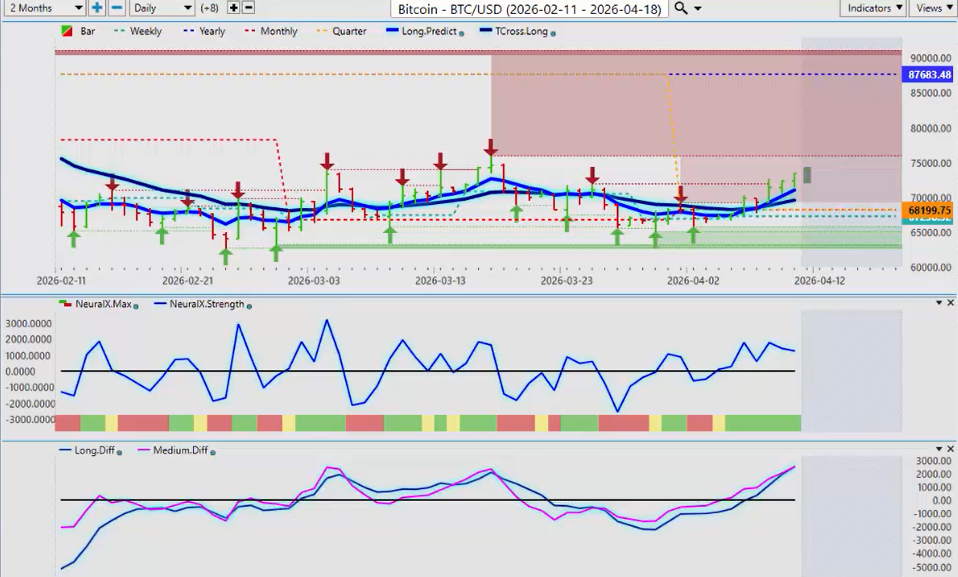
Now when we look at Bitcoin Bitcoin recovering with the equity markets but still in a very firm downtrend in 2026 here. So again I think that longs on Bitcoin will do very well once we start getting closer to August September October. Right now it does look good.
But again always remember the easiest way to identify what the primary trend is by measuring where you currently are in relationship to the calendar yearly opening. So if you bought this on January 1st then again you are still down almost 17% here guys. That’s the main thing I will point out because again you will hear a lot of different things different ways of what determining what a trend is. I would say that the short-term trend is up and as long as we’re holding above the quarterly opening that’s 68,199. So keep a very close eye on that. And of course the vantage point tross long at 69,587.
Oil ($USO)
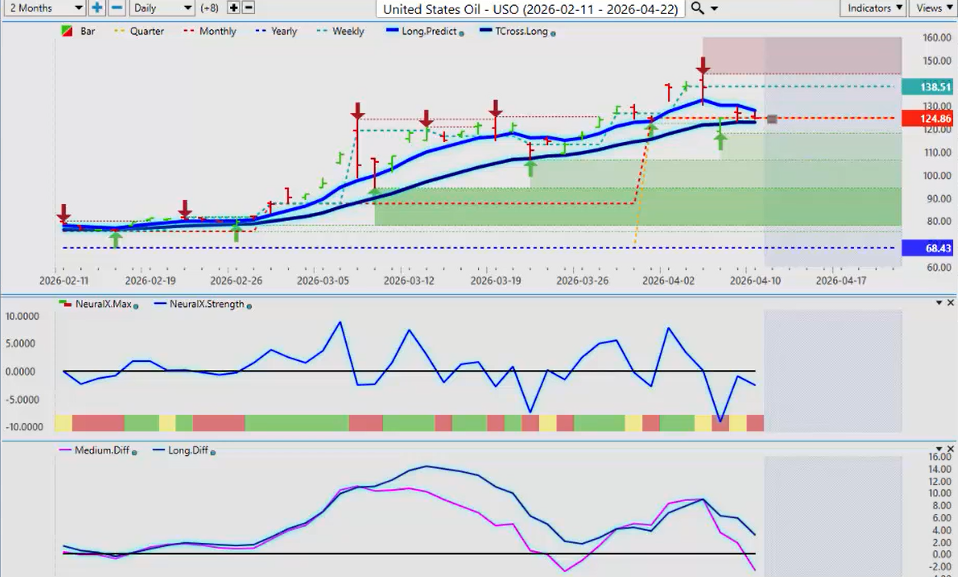
Now Oil they’re already trying to talk us into higher Oil prices for longer. Even if the war ends then they’re saying that supply chain disruptions. You we’ve heard all this before guys. And I swear they just make this stuff up. If if there’s a war they can raise gas prices on the same day with with high levels of inventory. But when the war ends oh no no no that’s it’s going to take a while before those prices come down.
So again I don’t believe the Fed can use this as an inflation target. It’s a short-term move. But right now this is the key level you want to watch next week. The VPT cross long 12291. If we can hold above that level then Oil is going to go higher. And let’s face it they’ve already said their intention is to keep Oil prices higher for longer.
We’ve heard all this before. So again we’ll see where this one plays out. We do have a medium-term crossover but not a long-term crossover. And for that for that medium-term crossover to be validated guys we must break down below the TCross long at a minimum 12291. So if we’re holding above that longs are still in play. If we start closing below 12291 then Oil is getting ready to move lower.
Euro versus U.S. Dollar ($EUR/USD)
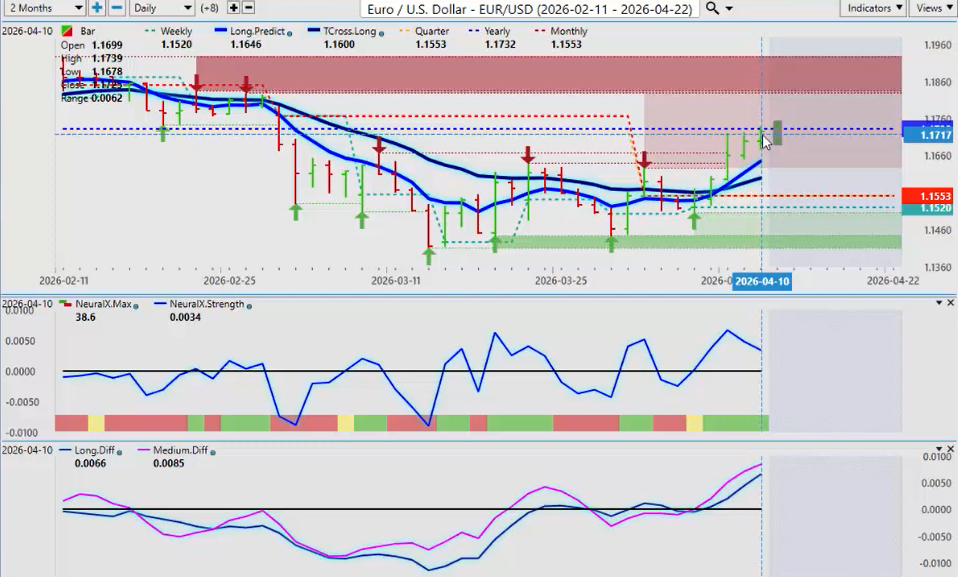
Now looking at some of our main forex pairs going into next week’s trading the Euro is pressuring the calendar yearly opening. This is the line in the sand for us right here the 11732.
If we can get above this area and stay above it then the dollar is going to be under pressure for longer and the Euro trade will work. The Euro long trade will work. But again be very cautious on Monday Tuesday trading. We could have a big break above the yearly opening price and then give it all back on Tuesday. But either way by the end of next week we want to see if we can hold above 11732. If we can then the Euro will start to accelerate to the upside likely towards the 120 area in the coming months.
British Pound versus U.S. Dollar ($GBP/USD)
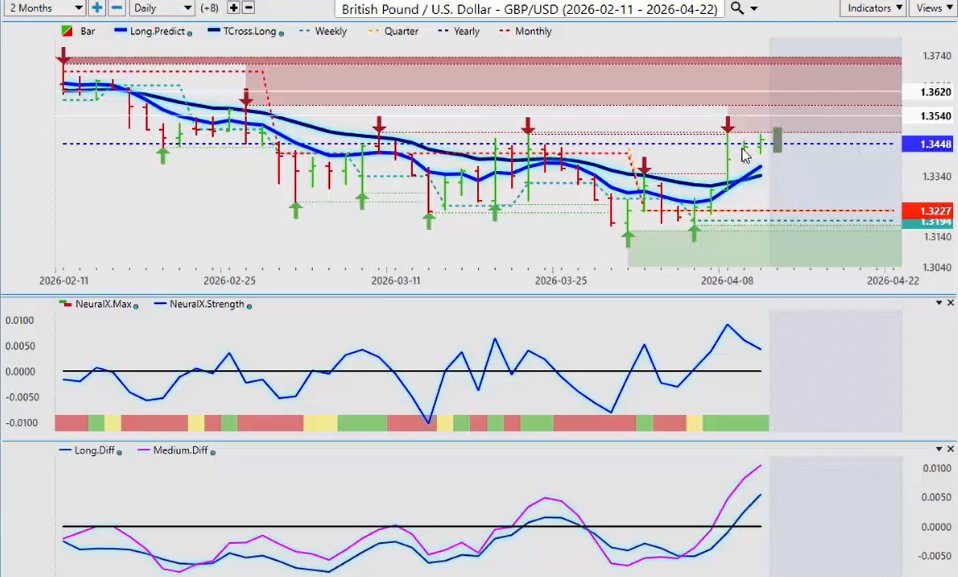
The Pound Dollar basically the same trade here guys but a little more aggressive. we actually closed above the calendar yearly opening. Now I’ve talked about this one over the last few weeks in the in this outlook with the Footsie 100 being the the top index for me to be trading in the only in the month of April that if it goes higher the probability is the Pound will go higher. If the DAX goes higher the probability is the Euro will go higher. So forex traders can gauge their forex trading with the equity markets. And you equity traders you can learn a lot from the forex traders because they’re very much intertwined which is the the primary basis of intermarket technical analysis and the VP software. So always remember that guys use those correlations to your advantage. If they keep buying the DAX and the Footsie probability is they’re going to probably keep buying the Euro and the Pound. But right now the Pound is looking pretty good. We’re above the quarterly monthly opening and we’ve now closed above that very important yearly opening price at 13448.
So we’ll look for additional longs down to the potentially down to the T cross long 13343. But this also has a high probability of a breakout to the upside.
U.S. Dollar versus Swiss Franc ($USD/CHF)
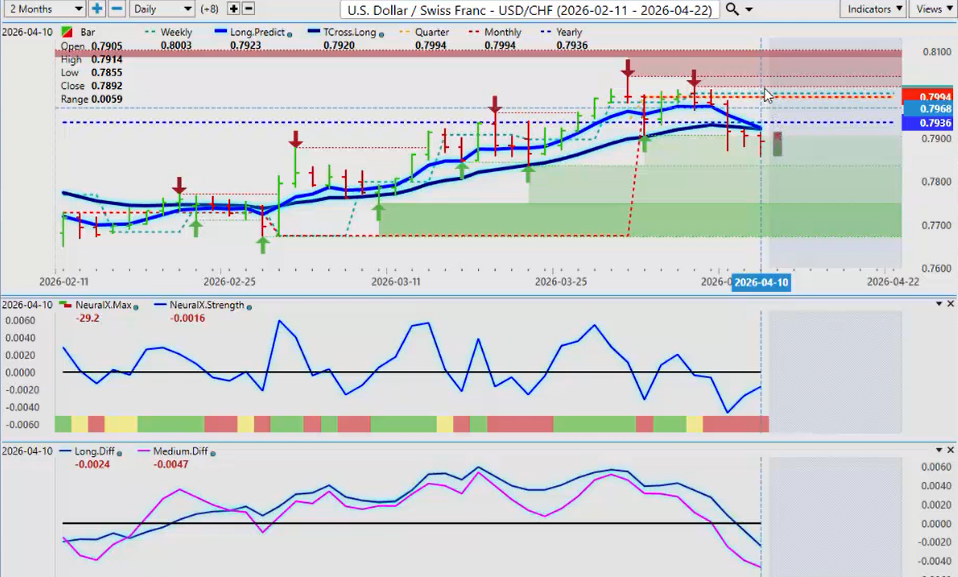
US Swiss Franc again another dollar short trade. we’ve got our quarterly now. The structure of this looks like it’s getting ready to drop much further. our quarterly now is at $79.94.
The yearly opening price 7936. If we can hold below these two levels guys we are likely moving considerably lower in the weeks and months ahead. So again know your levels is the main thing.
And that tross long now at 7920 is a critical level because the yearly the calendar yearly opening price is sitting right there. That tells us very clearly the primary trend is down. So we sell we’re either buy dips or sell rallies. In this case we sell rallies. Okay.
U.S. Dollar versus Japanese Yen ($USD/JPY)
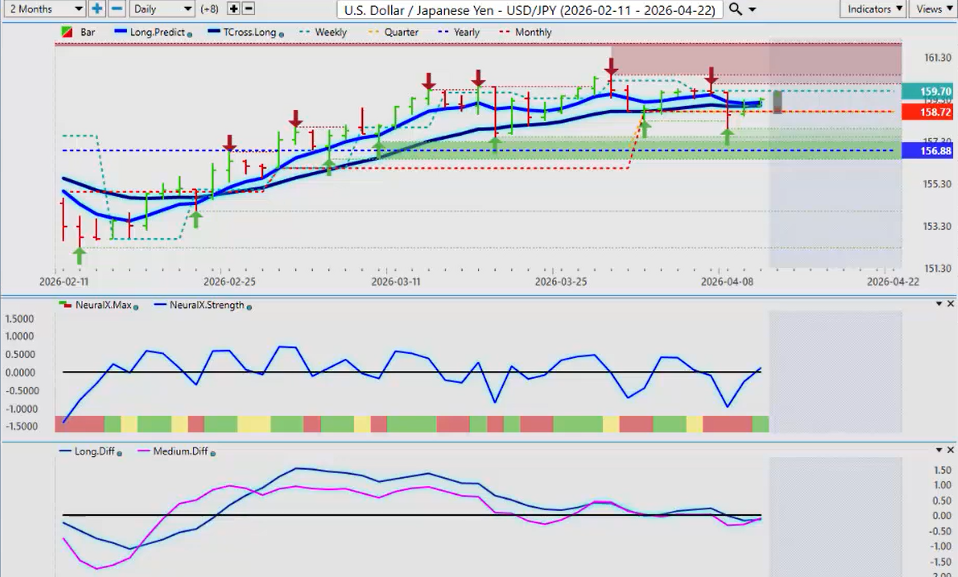
Now the Dollar Yen once again I believe the carry trade is going to start to come apart here. this highly confused Fed Fed is going to be cutting whether he knows it or not whether he likes it or not. He can make up excuses about labor reports. He can make up excuses about the inflation food inflation inflation because of Oil. no guys that’s not going to cut it. and I believe the next jobs number is going to confirm that he will be cutting probably more than once before the year ends. So if that’s the case the interest rate differential will change between the Bank of Japan and the Fed and it could trigger a mass exit out of that carry trade meaning no more longs Dollar Yen. So again we will watch these key levels and they will tell us what the primary trend is. Can we stay below the TROS long at 159 and can we stay below the quarterly opening at 15872?
But if we get below 15688 the calendar yearly opening then that is going to trigger a a considerable amount of losses on this pair which will force them to exit the carry trade long. So keep an eye on that guys but be very careful with this pair and the cross pairs even worse.
U.S. Dollar versus Canadian Dollar ($USD/CAD)
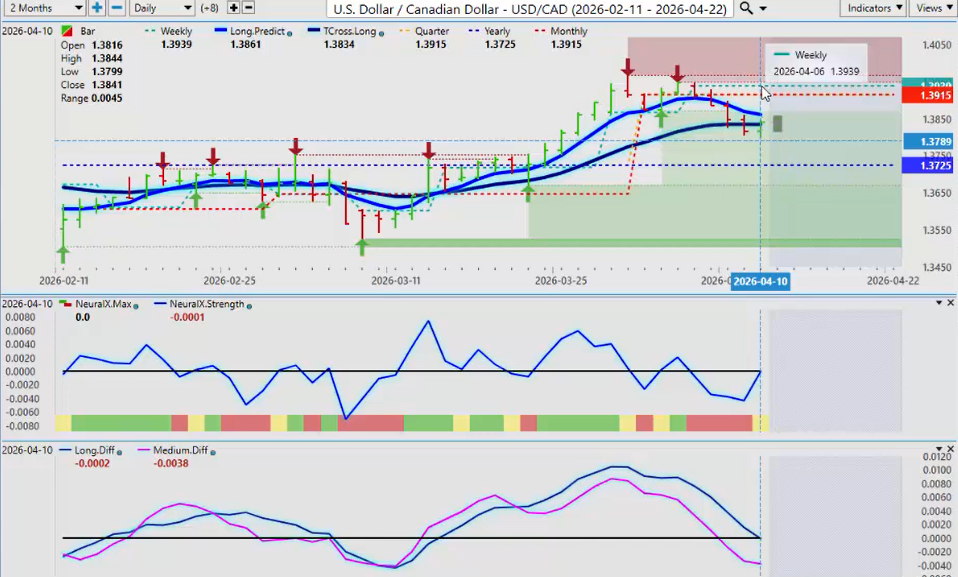
Now the US Canadian pair again it’s not about certainly not about Canadian dollar strength based on the Canadian economy. it’s more based around US dollar weakness. the Canadian economy not doing well. these crazy Oil prices still really didn’t help the currency that much. So again we are trapped right now and looking for a significant break. Now with this being an outlook not a recap of something that’s already happened I can give you specific levels. The quarterly opening price is 139.15.
You can put a buy stop above that. The yearly opening price that’s coming in at 13725. You can put a sell stop below that. So whichever side of this breaks you’re prepared for it. But right in between all of this guys is the TCross long. And that’s coming in at 13834.
But again we could come right down to the yearly opening price stop dead and go right back up again because I I was I want to stress this. This is not about a strong Canadian economy a strong Canadian currency. It’s the exact opposite of that. It’s about dollar weakness and places to sell US dollars and that’s why they’re doing it. So be careful with this one. But right now the neural index. that’s a warning sign. The market’s moving lower and the neural index strength is pointing straight up. And now you’ve got a caution on said neural index. So be careful with this one. I’m not convinced that shorts will work from a longer term perspective.
Australian Dollar versus U.S. Dollar ($AUD/USD)
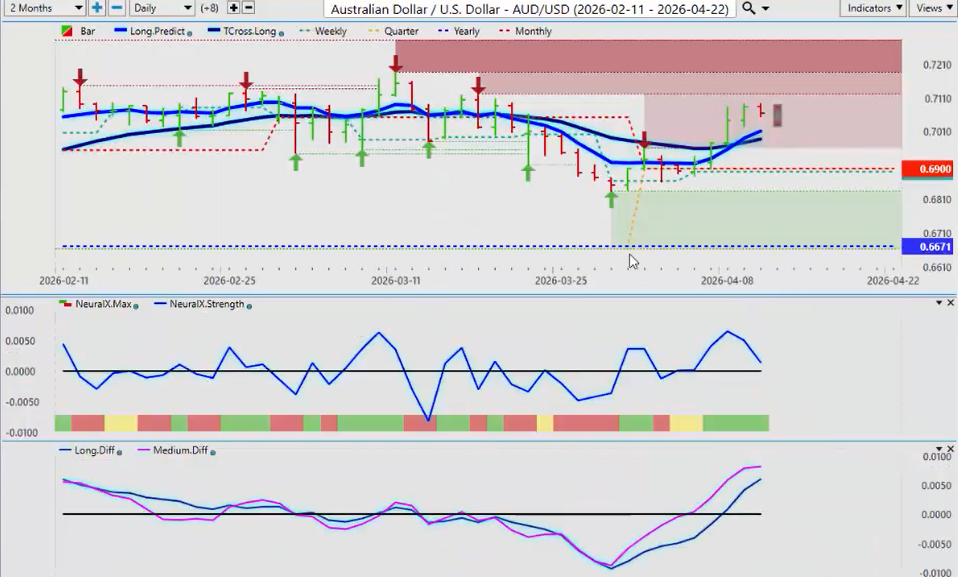
Now the Aussie and the Kiwi slightly different scenario. The Aussie has remained a bullish settlement the entire year guys. When you go back and you look at this thing going back 6 months to when this year started the Aussie has only gone up. And when it’s when it’s pulled lower the buyers are sitting there waiting for it. So again when they talk about uptrends downtrends sideways trends it’s it’s easy to establish what the primary trend is if you know your levels. The quarterly opening is 69. The yearly opening price is 6671. The Tcross long is coming in at 69.88.
The structural bias of the market the market is screaming us to us telling us to go long right? But I want to make sure that we stay above 69. The longer we stay about above 69 the the more likely it is we’re going to return back towards 72 73 maybe even higher.
I believe that the Aussie and the Kiwi are two of the most grossly undervalued currencies in the forex market and they have plenty of room to extend. I think it was only what five six years ago we were trading this above par then co we got hit with co COVID lockdowns. So again I think the Aussie and the Kiwi will simply just go back to where they were.
New Zealand Dollar versus U.S. Dollar ($NZD/USD)
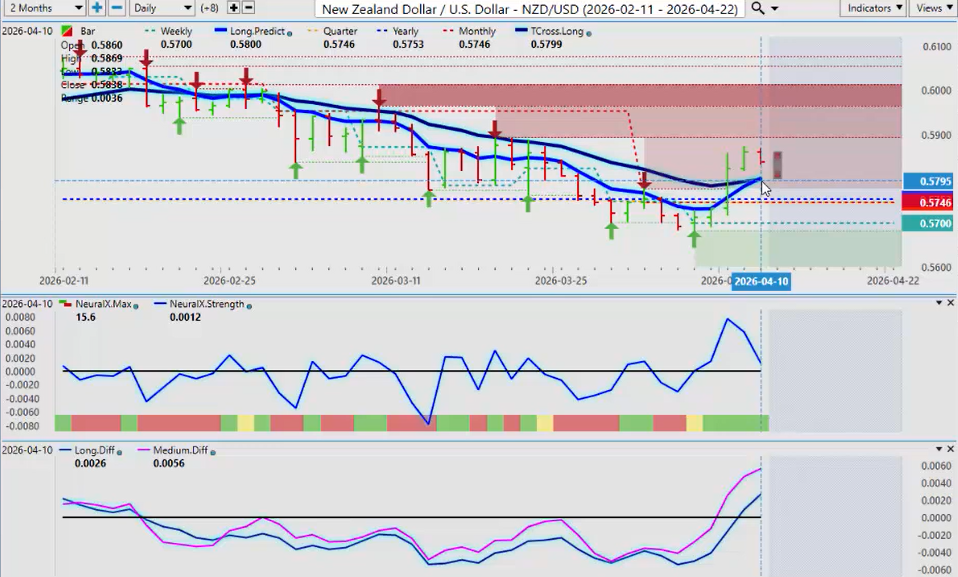
Now the Kiwi is an interesting one. the Bank of New Zealand were supposed to just go on hold this previous week and the statement really does demonstrate the incompetence of these central banks that they really don’t know what’s going on.
So his his statement was “Well nobody would advocate for tightening so I guess we’re going to stay in the range between 2.2 and 3%.” The market immediately took that is that they’re going to hike back to 3%.
So again this is what we’re dealing with with these central bank statements. very very frustrating. So either way the Kiwi is now above its two key levels. the quarterly opening 5746 5746 excuse me and our yearly opening price at 5753.
Then we have the vantage point t cross long at 57.99. So our supports are one two three. As long as we’re holding above these lower end at 5746 longs are in play guys because now the Bank of New Zealand is basically saying they’re going to hike while the Fed the US Fed will likely have no choice but to cut. And again inflation data on the CPI on Friday it’s not overly hot. it’s not hot. it’s cooler. a little bit of food inflation. that’s that’s not enough to be hiking rates when you’re only creating 50,000 jobs over a 3-month period. but again last thing we want to do is try and explain economics to to any of these central banks.
So I would expect heightened volatility with the negotiations between Iran and the US next week. But with that will come opportunity.
So with that said this is the Vantage Point AI market outlook for the week of April the 13th 2020.


