The AI stock spotlight this week is Ovintiv ($OVV)
Ovintiv ($OVV) is in the business of pulling hydrocarbons out of the ground and turning geology into cash flow. That means oil, natural gas, and natural gas liquids, which is just a fancy way of saying “stuff that burns and makes money when the world gets nervous.” Its operations are concentrated in three main regions that traders should care about: the Permian Basin in Texas, the Montney in Canada, and the Anadarko Basin in Oklahoma. Think of these like three different ATMs connected to the same checking account. The company drills wells, produces energy, sells it into the market, and tries to do it cheaper than the next guy.
Ovintiv ($OVV), a company that has been through more identity changes than a teenager. It began life as Encana, a proud Canadian natural gas shop; then it decided gas alone was like eating only celery, so it bulked up on oil and liquids; then it packed its bags, crossed the border, and reinvented itself as a U.S.-centric operator; along the way it survived multiple commodity crashes that would have sent lesser outfits into therapy; today it stands as a leaner, meaner shale player with operations across North America; and despite all the drama, it still matters because when energy prices move, companies like this are the transmission mechanism between global chaos and your trading account.
The profit engine is straightforward. Oil carries the fattest margins, so when crude prices are strong, Ovintiv ($OVV) looks like a genius. Natural gas is the moody persona of commodities. It swings wildly and can turn a good quarter into a shrug. Liquids sit somewhere in the middle, providing a stabilizer when gas prices act like they skipped their medication. The biggest revenue drivers are commodity prices and production volumes, which is Wall Street’s way of saying “price times how much you dug up.”
Customers are not picky. Refineries, utilities, industrial buyers, and export markets all line up to buy energy. Nobody asks if the oil had a good pedigree. They just want it delivered on time. Headquarters is in Denver, leadership is run by a team that has learned the hard way that survival beats ambition, and the employee count is in the several-thousand range. Competitors include the usual suspects in shale such as EOG, Pioneer, Devon, and ConocoPhillips. Ovintiv ($OVV) is not the biggest, not the flashiest, but it has carved out a reputation for discipline, which in the oil business is like trying to find someone sober at a bachelor party.
Now let’s talk money, because this is where traders stop nodding and start caring. Revenue moves up and down with commodity prices, which means you’re not investing in some streaming subscription here. You’re renting exposure to global supply and demand shocks. When oil and gas prices rise, revenue jumps. When they fall, revenue politely collapses. Margins have improved in recent years because the company got religion on cost control. Translation: they stopped drilling like drunken sailors and started acting like accountants.
Cash flow is the real story. Ovintiv ($OVV) generates significant free cash flow when prices cooperate, and management has been using that cash to pay down debt and return capital to shareholders. The balance sheet used to look like a credit card bill after that bachelor party weekend. Now it looks more like someone who has discovered budgeting apps. Debt is still there, but it is manageable, and that matters in a capital-intensive business where drilling wells is not cheap.
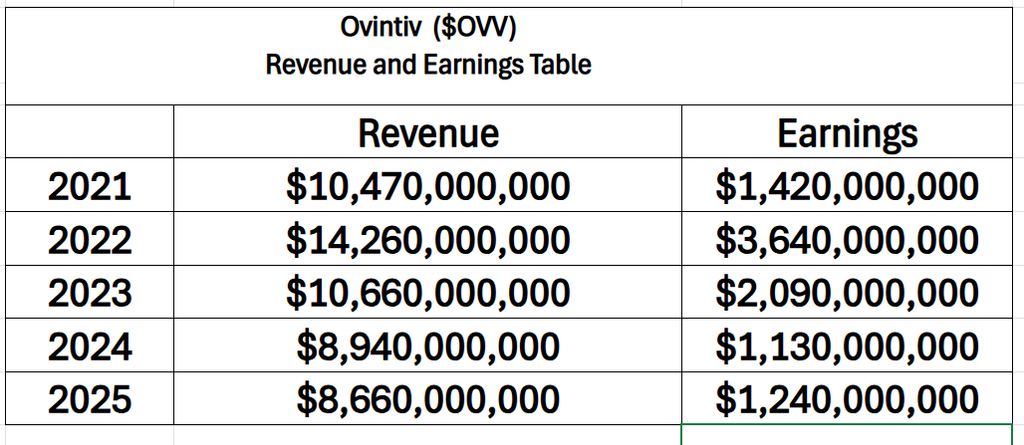
When you look at $OVV, the numbers reflect a classic commodity cycle. Revenue and earnings peaked in 2022 and have since declined, but the company has remained consistently profitable through the downturn. That tells you management is disciplined and the business is resilient, which matters far more than chasing peak-year results.
Right now, traders are circling around a handful of questions like sharks that smell volatility. First, can Ovintiv ($OVV) sustain production growth without blowing up its cost structure? Second, what happens if natural gas prices stay weak longer than expected? Third, how sensitive is the company to oil price swings given its increasing liquids exposure? Fourth, will management continue prioritizing shareholder returns or revert to empire building if prices spike?
Those questions matter because they define the difference between a momentum trade and a value trap. And in energy, those two often look identical until they don’t.
Recent news has been a mix of operational updates, production guidance, and the usual parade of macro headlines tied to energy markets. The truly “new” information tends to be incremental. Slightly higher production here, slightly better cost efficiency there. Nothing that screams revolution. What is already priced in is the idea that energy remains tight enough to support strong cash flows. The market has largely accepted that Ovintiv ($OVV) is a disciplined operator that will not light money on fire for the sake of growth.
What Wall Street may be missing is how quickly sentiment can turn if natural gas remains weak or if oil pulls back. Analysts love to extrapolate recent trends into the future, which is like assuming the weather in Miami today tells you what it will be in six months. Expectations could be wrong if supply increases faster than demand or if geopolitical tensions cool off, reducing the risk premium in energy prices.
So why is the stock up? Because money flows where performance is. Over the past 90 days, energy has been one of the few sectors showing consistent strength, and Ovintiv ($OVV) has ridden that wave. Over the year to date, the same story holds. When traders look at the scoreboard, energy names have been outperforming broader market benchmarks that have been busy tripping over themselves.
Narratives helped. The idea of “real assets” outperforming in an uncertain macro environment has been a powerful tailwind. Concerns about inflation, geopolitical instability, and supply constraints have all fed into higher energy prices or at least higher expectations for them. But narratives are just the story. The data is what matters.
The data says Ovintiv ($OVV) has improved its cost structure, generated strong free cash flow, reduced debt, and focused on higher-margin production. That combination attracts capital. Compared to its sector ETF, which captures a broad basket of energy companies, Ovintiv ($OVV) has held its own by executing better than average and by being leveraged to the right mix of commodities at the right time.
Analysts are mostly on board with this story, pointing to disciplined capital allocation and improved balance sheet health. They are not wrong. But analysts also have a habit of assuming discipline continues forever. History suggests otherwise. When prices rise, the temptation to drill more is strong. When everyone drills more, prices eventually fall. It is the oil patch version of musical chairs.
Opportunities here are clear. If oil prices remain firm and natural gas stabilizes, Ovintiv ($OVV) can continue generating strong cash flow and returning capital to shareholders. Efficiency gains and technological improvements in drilling could further enhance margins. The biggest upside surprise would be a sustained rally in natural gas prices, which would turn one of its weaker segments into a profit engine overnight.
Risks are equally clear. A drop in oil prices would hit revenue and margins quickly. Continued weakness in natural gas would drag on overall performance. Cost inflation in drilling and services could erode profitability. The biggest blind spot is the assumption that current discipline will persist across a full commodity cycle. If management or the industry collectively overproduces, the whole thesis gets shaky.
At the end of the day, Ovintiv ($OVV) is not a mystery. It is a lever on energy prices with a management team that has recently discovered the joys of discipline. The stock is best suited for traders who understand that they are not buying a company so much as they are buying exposure to a commodity cycle with a corporate wrapper around it. $OVV is a leveraged bet on North American shale oil and gas, with performance driven primarily by energy prices and execution efficiency.
For the trend to continue, oil prices need to stay supportive, costs need to remain under control, and management needs to resist the urge to chase growth at the wrong time. Early warning signs of trouble would include declining cash flow despite stable prices, rising debt levels, or a noticeable shift in capital allocation toward aggressive expansion.
In plain English, if the company keeps doing what it has been doing and the world keeps needing energy at current prices, the stock can keep working. If either of those things changes, it can unwind faster than a bad trade you swore you would cut earlier.
In this weekly stock study, we will look at an analysis of the following indicators and metrics, which serve as our guidelines in determining whether to buy, sell, or stand aside on a particular stock:
Wall Street Analysts Ratings and Forecasts
52 Week High and Low Boundaries
Best-Case/Worst-Case Analysis
VantagePoint A.I. Predictive Blue Line
Neural Network Forecast (Machine Learning)
VantagePoint A.I. Daily Range Forecast
Intermarket Analysis
Our Suggestion
While our decisions are ultimately guided by artificial intelligence forecasts, we still take a brief look at the fundamentals to understand the financial landscape in which $OVV is operating.
Wall Street Analysts Price Forecasts
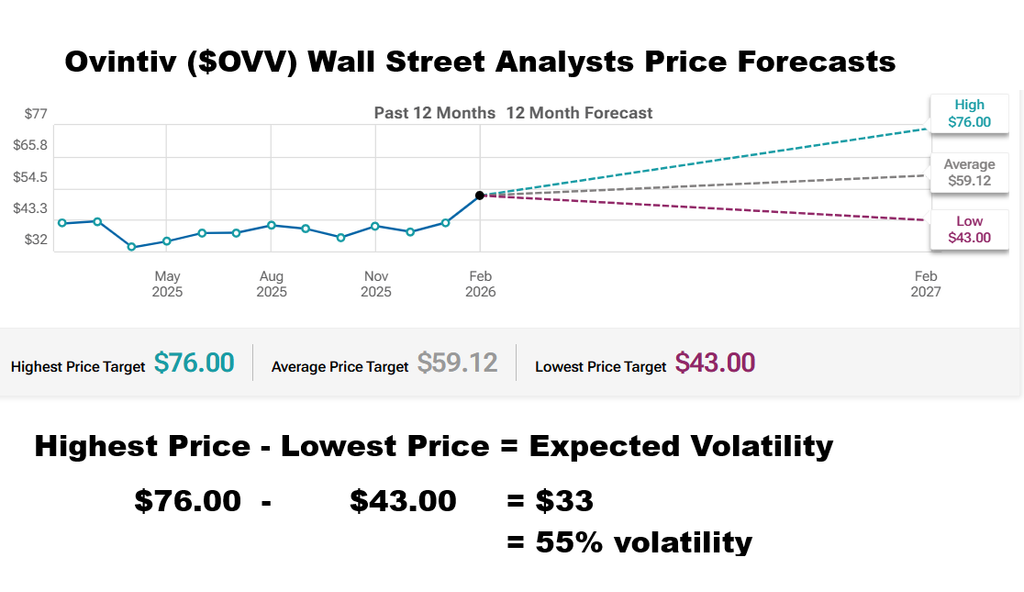
Wall Street’s best guess on $OVV runs from $76 on the high end to $43 on the low. That’s a $33 spread on a $59 stock. Do the math and you get 55% expected volatility. That’s not a forecast. That’s a fight.
When you look at that graphic, you’re looking at disagreement.
And disagreement is where the money is.
The key takeaway from this graphic is not the average target, but the spread between the most bullish and most bearish forecasts, which defines the expected volatility moving forward. For $OVV, that spread is $33, translating to roughly 55% expected volatility, which is exceptionally high. When Wall Street disagrees this much, it signals a market primed for a large move, not stability.
When analysts cluster tightly, the move is usually already priced in. Everyone sees the same thing. There’s no edge. But when the spread blows out like this, it tells you something far more important. The so-called experts don’t agree on reality. They’re looking at the same data and coming to completely different conclusions. That’s uncertainty. That’s tension. That’s fuel.
And markets don’t drift in those conditions. They move.
Big disagreement means big repricing is coming. It means someone is going to be very wrong. And when that happens, price doesn’t politely adjust. It snaps. Hard. Fast. In one direction.
So forget the average target. It’s useless.
As a trader, your job is simple. Find the side that’s winning… and ride the move when that disagreement resolves.
Because when Wall Street argues this loudly, the market doesn’t whisper. It moves.
52 Week High and Low Boundaries
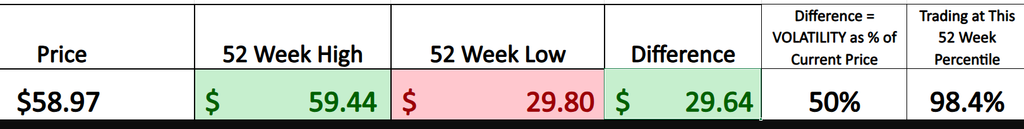
What stands out immediately in $OVV is not just where it’s trading, but how it got there. Over the past 52 weeks, the stock has ranged from $29.80 to $59.44, a spread of $29.64. When you anchor that range to today’s price near $59, you’re looking at roughly 50% historical volatility. That’s not trivial. That’s a stock that has already proven it can move with force.
But the more telling detail is positioning. At current levels, $OVV is trading in the 98th percentile of its 52-week range. In other words, this is a leadership story. The stock has climbed from the bottom of its range and is now pressing against the ceiling, where expectations, scrutiny, and risk all tend to converge.
Now layer in what Wall Street is signaling. Analysts are projecting a $33 spread between the most bullish and most bearish outcomes, implying 55% expected volatility going forward. That’s not a forecast of stability. It’s an admission of uncertainty. And when you put it together, you have a stock that has already demonstrated 50% volatility, is trading at the extreme high of its range, and is now expected to remain just as volatile. Markets don’t tend to sit still under those conditions. They tend to resolve tension decisively, and often abruptly.
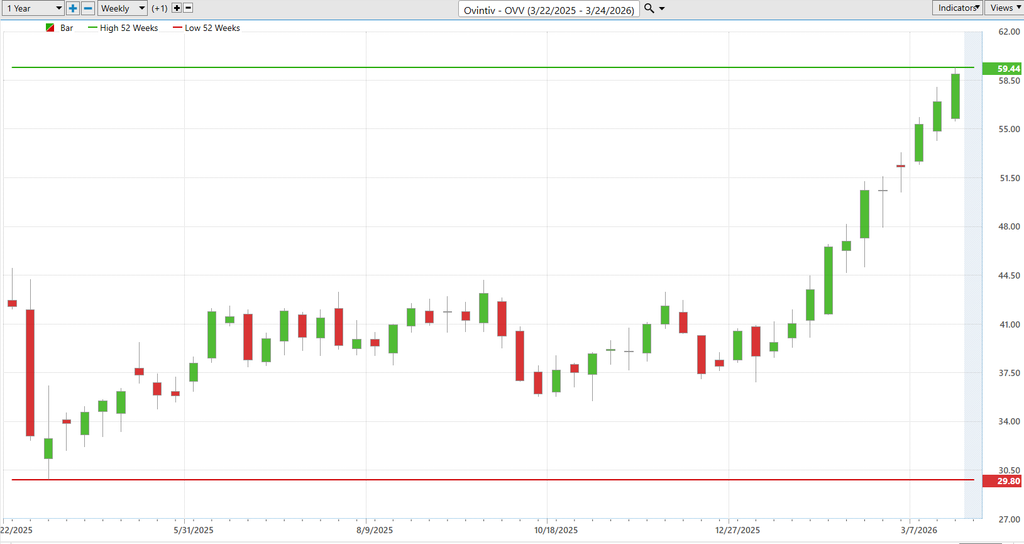
The 52-week chart of $OVV is proof positive that you want to pay attention to stocks making new highs, as the stock has already run roughly 30% since breaking out to fresh 52-week highs. That kind of strength is not random, it is capital flowing into leadership and confirming a trend that is already in motion. When you zoom out to the 10-year chart, you can clearly see where the prior commodity cycle peaks sit, defining the longer-term resistance and the levels the market is now beginning to challenge.
Best-Case/Worst-Case Scenario Analysis
The best way to truly understand volatility is not through indicators or opinions, but by studying an annual chart and measuring the largest uninterrupted rallies and declines. This simple exercise strips away the noise and gives you a clear, practical view of what an asset is actually capable of doing. When you see the magnitude of these moves laid out, you are no longer guessing, you are entering every trade with a defined sense of both opportunity and risk.
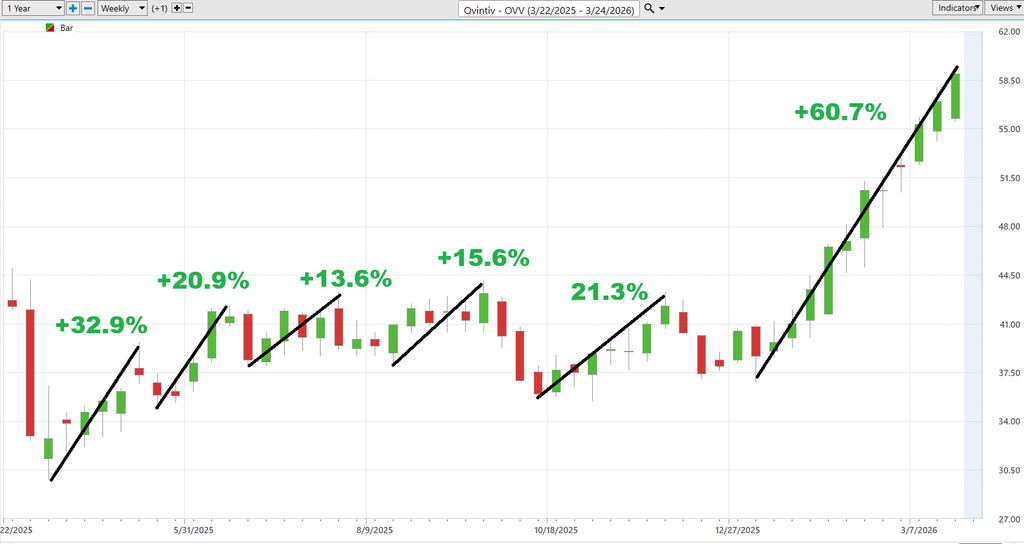
On the upside, $OVV has demonstrated the ability to produce powerful, sustained advances, with recent rallies stacking gains of 20%, 15%, and now over 60% in its current leg higher. That kind of momentum is not random. It reflects persistent demand and strong trend behavior, where pullbacks are shallow and buyers consistently step in. In practical terms, it tells you that when this stock gets moving, it can deliver outsized returns in relatively short periods of time.
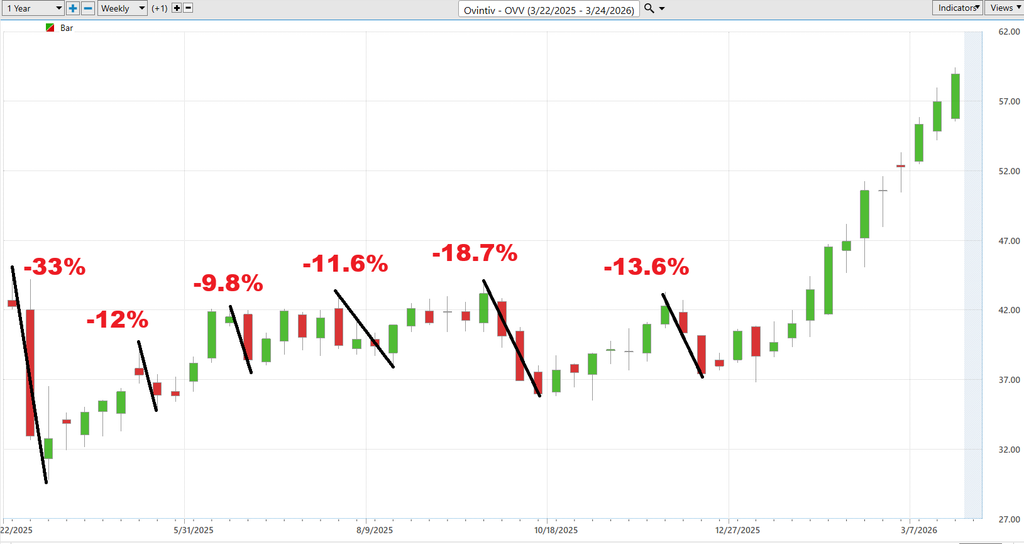
On the downside, the story is just as clear. The same chart shows repeated drawdowns of -10% to -18%, with one sharp decline exceeding -30%. These are not outliers, they are part of the stock’s normal behavior. For a trader, that is the real takeaway. If you are not prepared to handle that level of downside movement, you are trading the wrong asset or using the wrong position size.
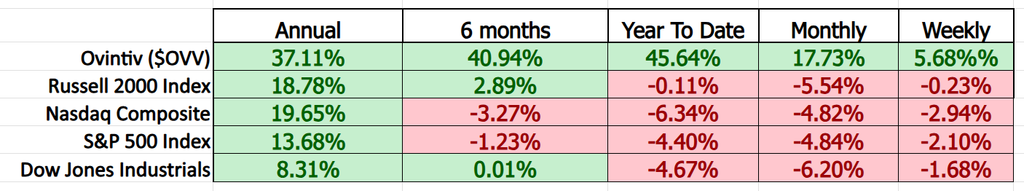
What becomes clear when you compare $OVV to the broader market averages is not just that it has outperformed, but that it has done so consistently across multiple time frames. While major indexes like the S&P 500, Nasdaq, and Russell 2000 are struggling or negative in the shorter term, $OVV remains firmly positive, signaling persistent relative strength. And that multi-timeframe outperformance is what matters most, because it tells you this is not a one-off move, but a sustained trend where capital continues to concentrate.
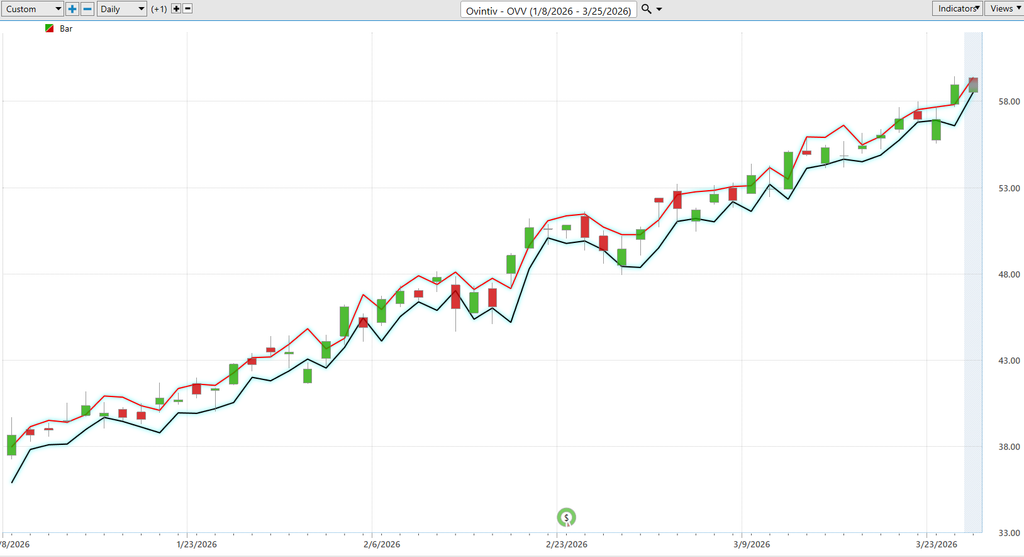
VantagePoint A.I. Predictive Blue Line
The chart of $OVV highlights the relationship between the predictive blue line and the black line in a very straightforward way. The blue line represents where price is expected to go next, while the black line reflects where price has already been. What you are seeing here is a clear separation between the two, with the predictive blue line leading higher, signaling forward-looking strength.
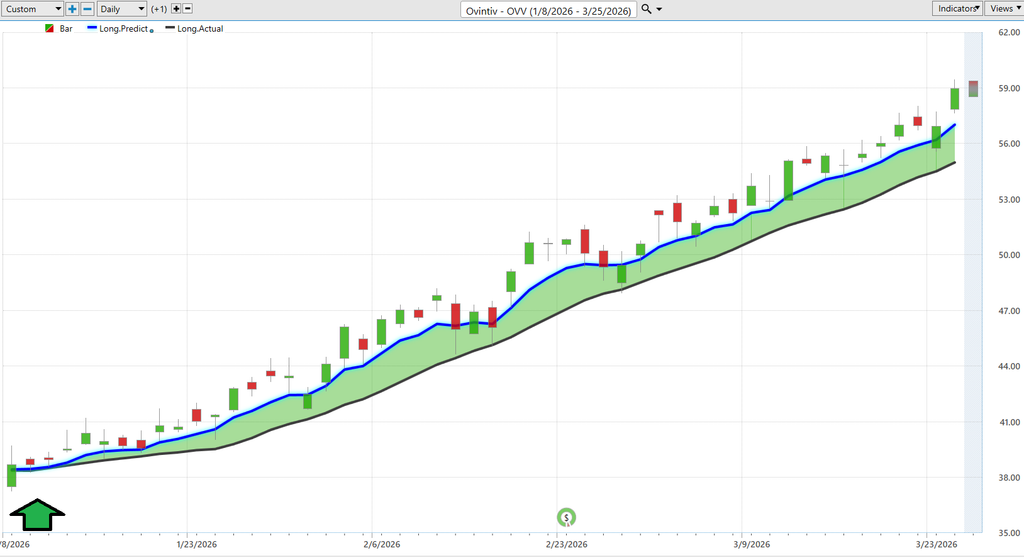
As the trend develops, the mechanics become even more important. The slope of the predictive blue line is steadily rising, which tells you bullish pressure is building. At the same time, the blue line remains above the black line, confirming that the forward expectation is stronger than the recent past. You can also see how price consistently pulls back toward the blue line and then moves higher again, showing that the market is gravitating toward that forward expectation.
From a trading standpoint, this is about alignment and timing. When the predictive blue line is rising and positioned above the black line, the path of least resistance is higher, and pullbacks toward that blue line become opportunities rather than reasons to panic. This is how traders stay on the right side of the trend, not by reacting to price after the fact, but by positioning around where it is most likely headed next.
VantagePoint A.I. Neural Index (Machine Learning)
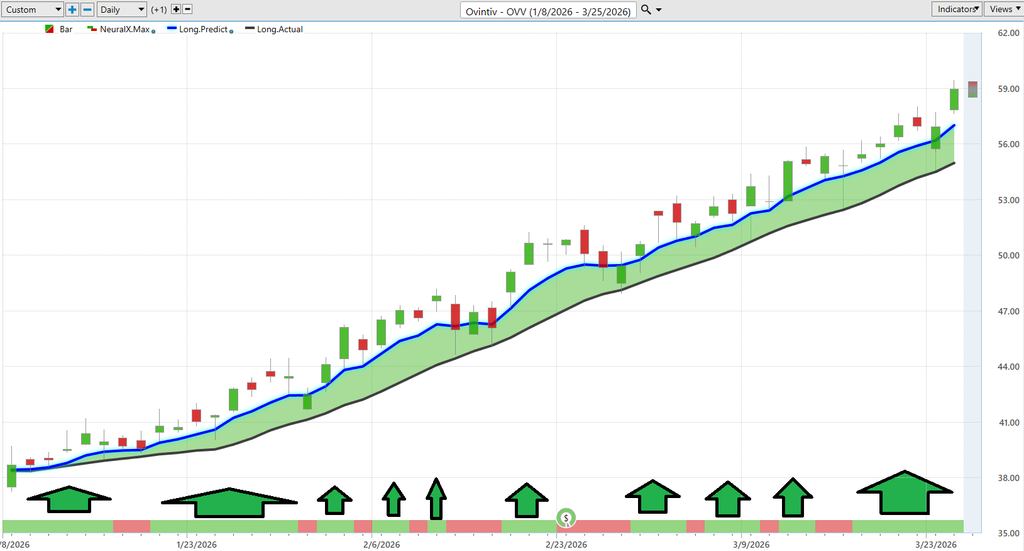
At its core, the neural index is a short-term forecasting tool designed to translate complex intermarket relationships into a simple, actionable signal. Rather than relying on a single indicator, it draws on a network of inputs, currencies, commodities, interest rates, and related markets, to anticipate directional bias over the next 48 to 72 hours. For traders, the value is not in predicting certainty, but in improving decision making by highlighting when probabilities are shifting beneath the surface of price.
In the chart of $OVV, the neural index sits at the base, quietly signaling these short-term shifts. When the indicator turns green, it is forecasting strength over the next two to three days. When it turns red, it is signaling likely weakness, and you can see how during those periods price tends to revert back toward the predictive blue line or even dip below it before stabilizing. It’s not random movement, it’s mean reversion responding to a change in short-term conditions.
What becomes especially compelling is when you look at the arrows plotted along the bottom of the chart. Each one marks a moment when the neural index was aligned with the direction of the predictive blue line. In other words, both the short-term forecast and the broader trend were pointing the same way. Those are the moments where probability stacks in your favor, and where the cleanest, most efficient trades tend to emerge.
VantagePoint A.I. Daily Range Forecast
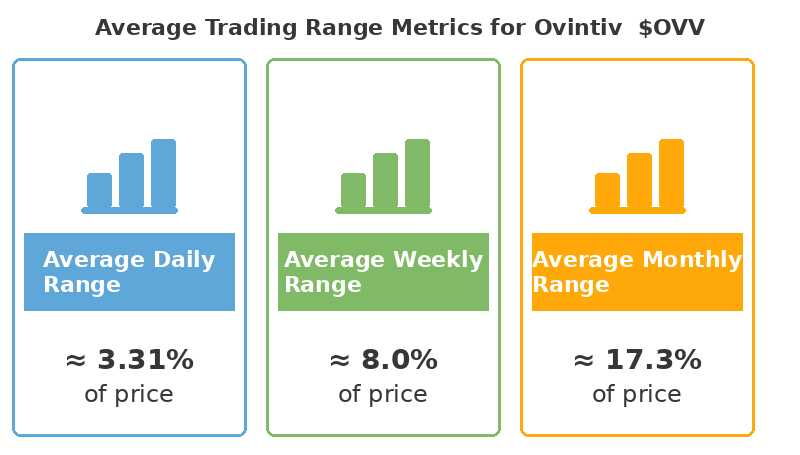
There is no shortage of volatility in $OVV, whether you are looking at a 3.31% average daily move, an 8% weekly swing, or a 17.3% monthly range, the stock is consistently delivering meaningful price movement across every timeframe. But the real question is not whether volatility exists, it is how you use it. These numbers are not just statistics, they define the boundaries of risk and opportunity, giving traders a practical framework to size positions, set expectations, and avoid emotional decisions by understanding what the asset is actually capable of doing before entering the trade.
Most traders wake up and ask the wrong question. They ask, “Where is price going?” when the better question is, “Where does the risk live today, and where is the opportunity?” That’s the edge. And that’s exactly what the VantagePoint A.I. Daily Range Forecast delivers. It defines the battlefield before the market even opens, outlining the expected high and low so you’re not reacting emotionally to price, you’re operating inside a plan.
Look at $OVV and you can see how clean this becomes. Price doesn’t move randomly, it moves within a defined channel, and when it pushes toward the upper band, that’s where opportunity begins to mature. When it pulls back toward the lower band, that’s where risk can be measured and managed. Day after day, this framework keeps you grounded, showing you where to act, where to wait, and where not to chase, because great trading isn’t about predicting everything, it’s about knowing exactly where the game is being played.
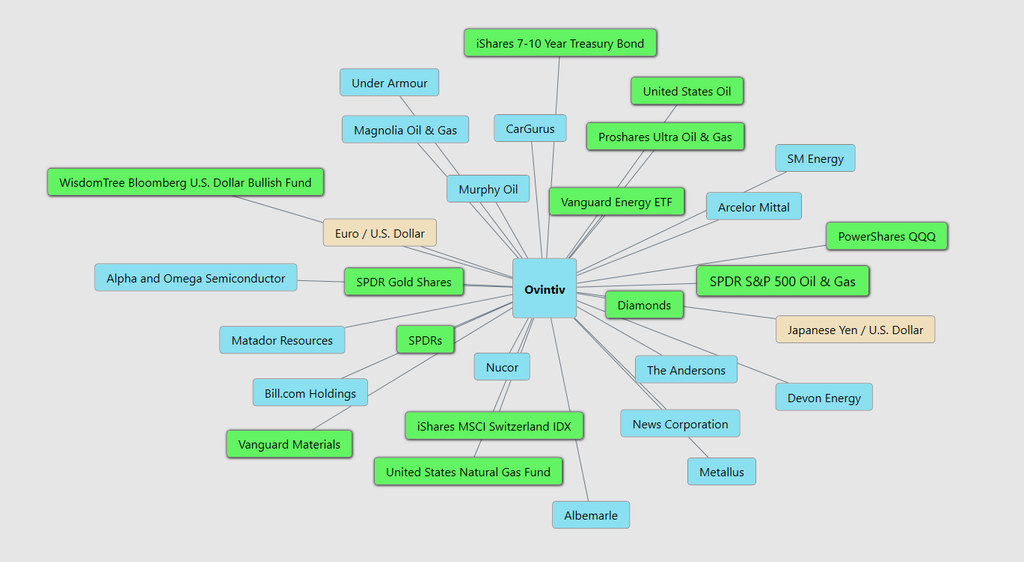
VantagePoint A.I. Intermarket Analysis
Let’s strip this down to brass tacks.
You’re looking at Ovintiv ($OVV). This isn’t some complicated Wall Street mystery. It’s a cash machine that pulls oil and natural gas out of the ground and sells it to the highest bidder. And the only thing that really matters is this: what are they getting paid for what they dig up?
First, oil runs the show. When oil prices are high, Ovintiv prints money. Period. More revenue, more profits, more attention from big money. When oil drops, the party slows down fast. This is your primary lever. Ignore it, and you’re trading blind.
Second, the U.S. dollar plays spoiler or wingman. A strong dollar puts pressure on oil prices. Why? Because oil gets more expensive globally. That can choke demand and squeeze Ovintiv’s margins. A weaker dollar does the opposite. It quietly lifts oil prices and gives stocks like $OVV a tailwind.
Third, interest rates tighten or loosen the vise. Higher rates make future profits worth less today. Translation: even if Ovintiv is doing well, the stock can stall. Lower rates? That’s oxygen. It gives valuations room to expand and lets momentum do its thing.
Bottom line: Oil is the engine. The dollar and rates are the traffic lights. When they’re all aligned, $OVV can move hard and fast.
Now look at the web in that graphic and you’ll see the real story. $OVV is sitting at the center of a network tied to energy ETFs, crude oil proxies, natural gas funds, the U.S. dollar, interest rate instruments, and even broader equity benchmarks. When energy names, oil-linked ETFs, and commodities are all pushing in the same direction, that’s confirmation. When currencies and rates are not fighting the move, trends stick. This is not one stock moving in isolation. It is a node in a system. And when that system lines up, that’s when the high probability trades show up.
Our Suggestion
Management at $OVV comes across as confident, disciplined, and execution-focused. The tone of the last two earnings calls is measured, not promotional, with a clear emphasis on capital efficiency, portfolio quality, and shareholder returns. More importantly, they appear to be delivering on what they said they would do, reinforcing credibility rather than relying on optimism.
The single biggest driver over the next 12 months is the company’s repositioning around its core Permian and Montney assets, where management believes it can generate stronger, more repeatable returns. What could stop it is not complicated: weaker oil and gas prices, integration risk tied to recent portfolio changes, or any breakdown in the productivity gains they are currently achieving. Beneath the surface, the potential upside surprise is that improved market access, better netbacks, and operational efficiencies may not yet be fully reflected in expectations.
If there is a place where management could be wrong, it is in assuming that execution remains as smooth as it has recently been. The story now depends on maintaining efficiency gains while navigating asset integration, commodity volatility, and timing risks. In short, the strategy is sound and the tone is credible, but this remains a business where macro forces and operational consistency will ultimately determine whether the next leg higher materializes.
So, here is the practical takeaway. Put $OVV on your trading radar and stock watchlist. Stocks with strong trends and strong institutional interest often create a steady stream of short-term trading opportunities. Just remember that even good stocks move around a lot. Position sizing matters. Good money management matters even more. The goal is not to be a hero in one trade. The goal is to still be standing when the next opportunity comes along.
It’s not magic.
It’s machine learning.
Disclaimer: THERE IS A HIGH DEGREE OF RISK INVOLVED IN TRADING. IT IS NOT PRUDENT OR ADVISABLE TO MAKE TRADING DECISIONS THAT ARE BEYOND YOUR FINANCIAL MEANS OR INVOLVE TRADING CAPITAL THAT YOU ARE NOT WILLING AND CAPABLE OF LOSING.
VANTAGEPOINT’S MARKETING CAMPAIGNS, OF ANY KIND, DO NOT CONSTITUTE TRADING ADVICE OR AN ENDORSEMENT OR RECOMMENDATION BY VANTAGEPOINT AI OR ANY ASSOCIATED AFFILIATES OF ANY TRADING METHODS, PROGRAMS, SYSTEMS OR ROUTINES. VANTAGEPOINT’S PERSONNEL ARE NOT LICENSED BROKERS OR ADVISORS AND DO NOT OFFER TRADING ADVICE.