


Welcome to the Artificial Intelligence Outlook for Forex trading.
VIDEO TRANSCRIPT
Okay, hello everyone, and welcome back.
My name is Greg Firman, and this is the Vantage Point AI market outlook for the week of March 23rd, 2026.
US Dollar
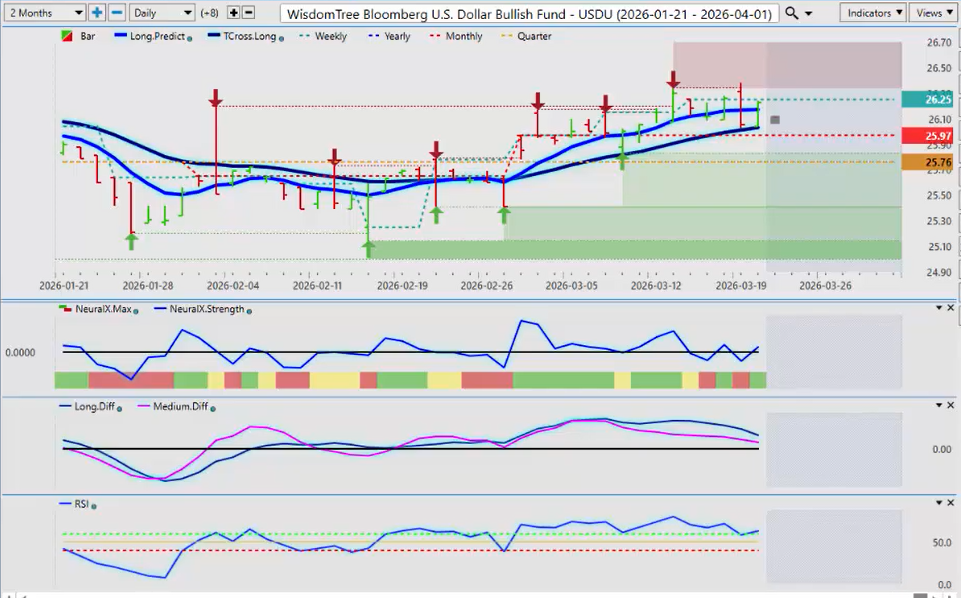
Now, to get started this week, we’ll begin where we always do with that very important US dollar. Now, as the war basically rages on, there’s no sign of it letting up just yet, but there are signs of some weakness in the US dollar. Now, in the WisdomTree Bloomberg US Dollar Bull Fund, it takes a broader look at the actual dollar. It’s not weighted to just the euro currency. [snorts] So, in this particular ETF, we remain positive on the month. We’ve come back, retested the T-cross long, so the primary trend still does remain up. The yearly opening price here coming in at 2576. So you can see that we were closing the week at 2623, just barely above that yearly opening price. So again, in most cases, the dollar would be weak in this coming next week, and the following week we would see strength at the end of the month. That’s a normal reoccurring pattern where the dollar is strong at the end of the month and into the first week of the new month until the week after the non-farm payroll number. So again, the indicators in VP here are very mixed, but the one I’m watching is a falling medium-term strength. The pink line over the blue line is showing a corrective move, which is basically the weakness is corrective in nature. So, if we can break down below that very important T-cross long at 2603, then, and the monthly opening price, we would see the dollar lose some ground, and I do anticipate that to start the week.
Gold
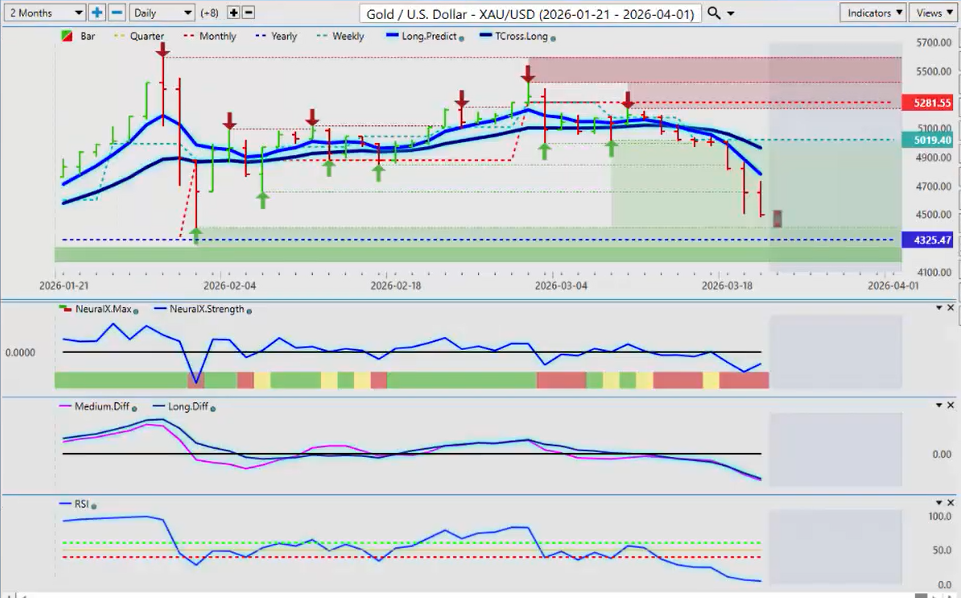
Now, when we do that comparative analysis to gold. Gold usually is under pressure towards the end of the month, and then at the start of the new month, just after that first week, we see a rally. But make no mistake, even though we’ve had this downward pressure in gold, the primary trend remains up. We’ve seen this movie before here, guys. We’ve come down to a low of 4406. Right now, to finish the week, we’re at 44.94, but the yearly opening price 4325. The primary trend remains up. While above that level, I am seeing movement in the neural index. Even though the neural index is down, the neural index strength is pointing up. And again, the predicted differences. So, watch very closely because I believe the institutional investors will start moving into gold in April either way.
SPYs, S&P 500, and Russell
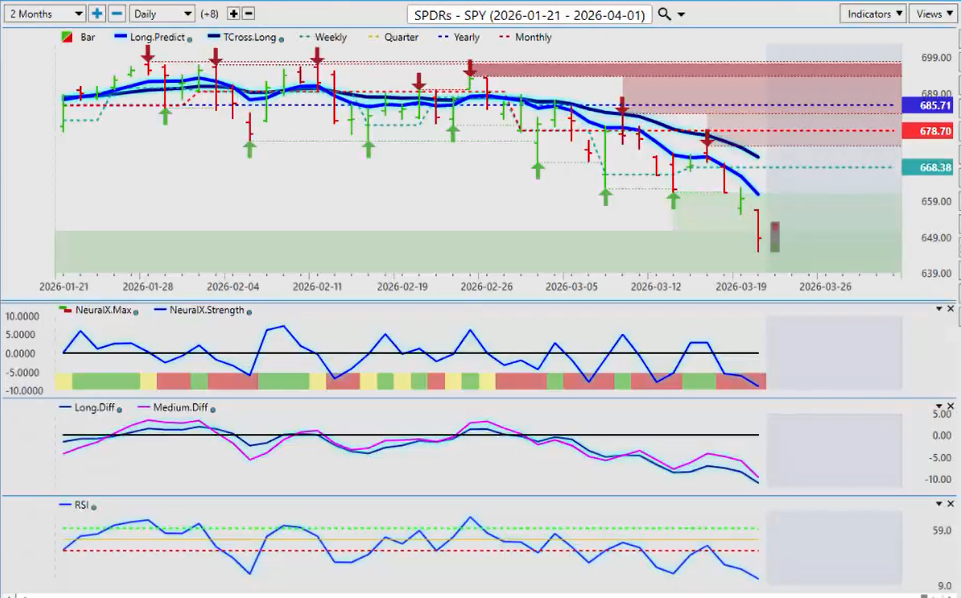
Now, when we look at the equity markets, we should see some strength next week if the dollar backs off and gold starts to recover a little bit here. So again, right now, we are still pushing down the primary trend here, though on the SPYs. The S&P 500 has been down for basically the better part of the month. We broke the yearly opening price on the SPYs, that particular level 68571. So again, we could see some relief coming next week, but the VP indicators remain net bearish.
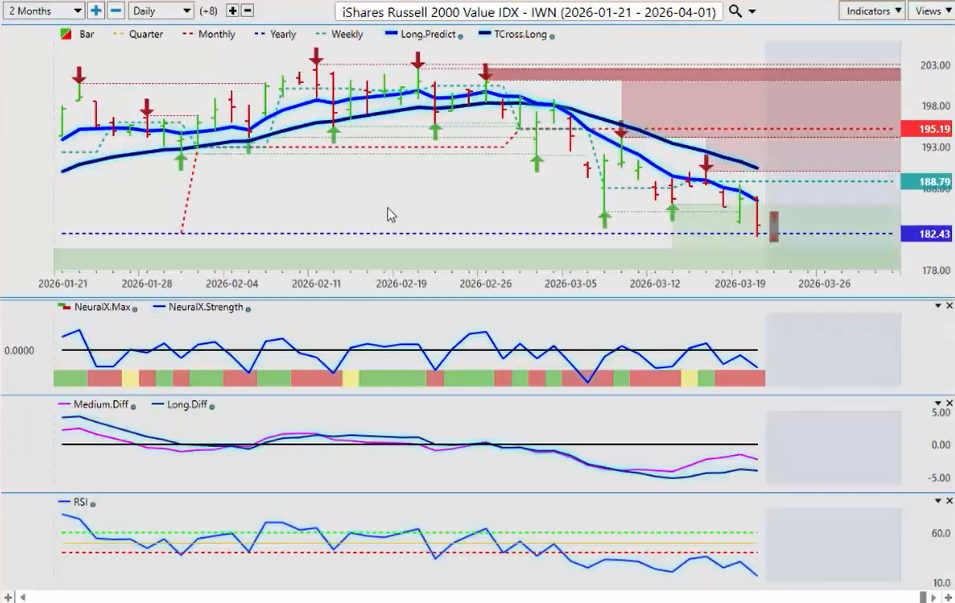
Same thing for the Russell, but the Russell is putting up a pretty good fight here. Very good fight. 18273. That is the yearly opening price. We hit it on Friday, and you can see that we rebounded off of that. So, 18233. If you’re a buyer of equities, I believe you could have some potentially very good opportunity next week. So, watch your VP indicators. But right now, the MA diff cross has occurred over here. The pink line, which is the medium-term strength, is above the long-term strength, suggesting that actually we are starting to turn back up.
Now again, with everything that’s going on between the US, Iran, Israel, and everybody else now in that region, that has been a problem obviously for the equities since this started, going back to the end of February, beginning of March. They didn’t like this at all, and the equities have really been hit hard, but the Russell remains positive on the year.
Global X DAX ETF
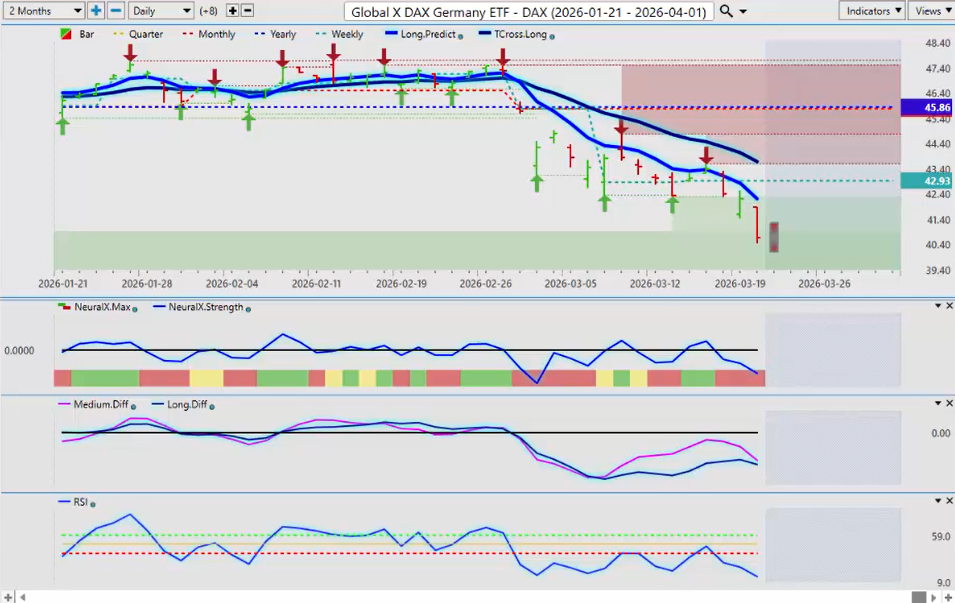
Now, when we look at the Global X DAX ETF, also breaking down. So again, if there’s any kind of relief coming in the Iran-US-Israel war, then these could turn around very quickly, and now some of the allies are coming in to assist with certain areas of the war. So, we’ll see where this goes next week. But once again, with the DAX, we’re seeing, I’m seeing the very high correlation between the euro and the DAX, which I’m going to talk about here in a minute, and I believe the euro is starting to turn. So, if that’s the case, we could see the DAX start to turn next week also. So, the predicted low for Monday on the DAX ETF I believe to be pretty good value, down around $40 a share. So, I’ll leave it there.
VIX
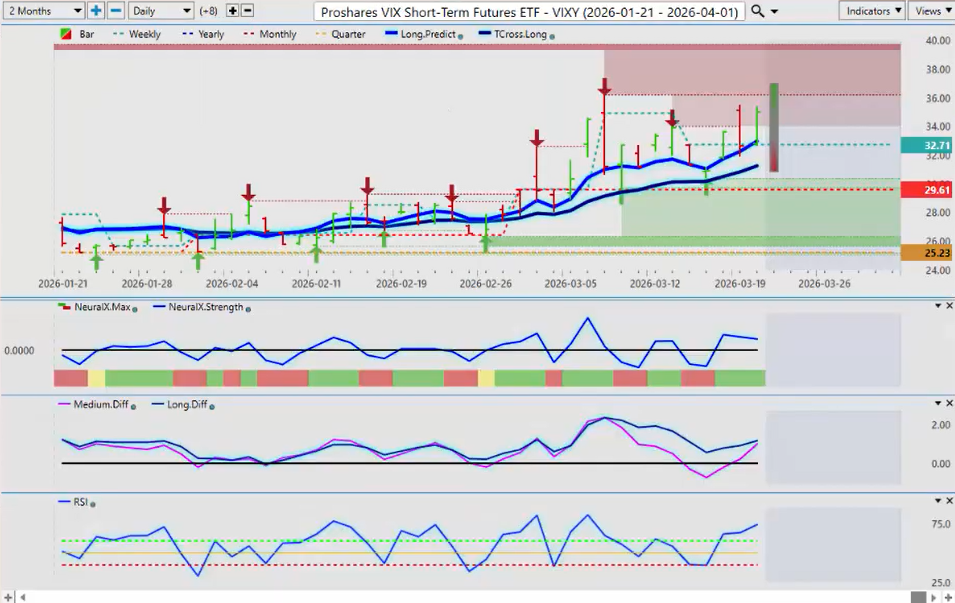
And we do need to look at the VIX here. You can see that Vantage Point is predicting a very big bar for Monday. Very large, actually. It’s one of the biggest predictive bars I think I’ve seen in some time on this. So again, a lot of volatility, but I believe that when you look at the predicted range for Monday, because again, guys, this is an outlook, not a recap of something that’s already taken place. This is being done Sunday morning at 11:20 a.m. before the markets open, not after. Okay, so again, I got a verified resistance high 3620, the Vantage predicted high for Monday, excuse me, 3694. Well, we could have a sell opportunity forming there if the global equities start to turn around.
Oil and USO
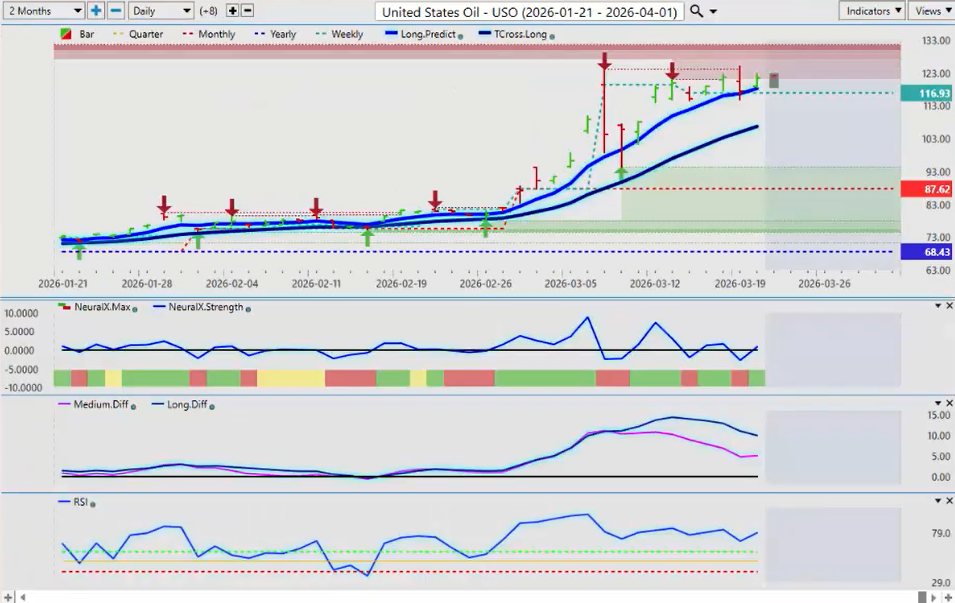
Now again, we do need to look at oil here, but again, respectfully, I would not be a buyer of oil at these levels. Once again, we are coming into a normal seasonal pattern where oil is strong between mid-April and mid-June. But we’ve really pushed high up to a high on this USO, that coming in at 12407, and we’ve done nothing since. So again, it’s always important to recognize that we had a little bit 12519 right there. So, we tried to make a new high. Now, I will concede all the indicators are still bullish, but the one that catches my eye is the MA diff cross, the pink line over the blue line, saying, look, the market’s going up, but the strength of the market is actually weak, internally weak. So continue to monitor this. I think that oil will go higher to start the week. The question remains, can it hold at these inflated levels? And in my respectful opinion, the answer would be no, especially with the allies coming in to help out with that one section to let the ships through.
Bitcoin
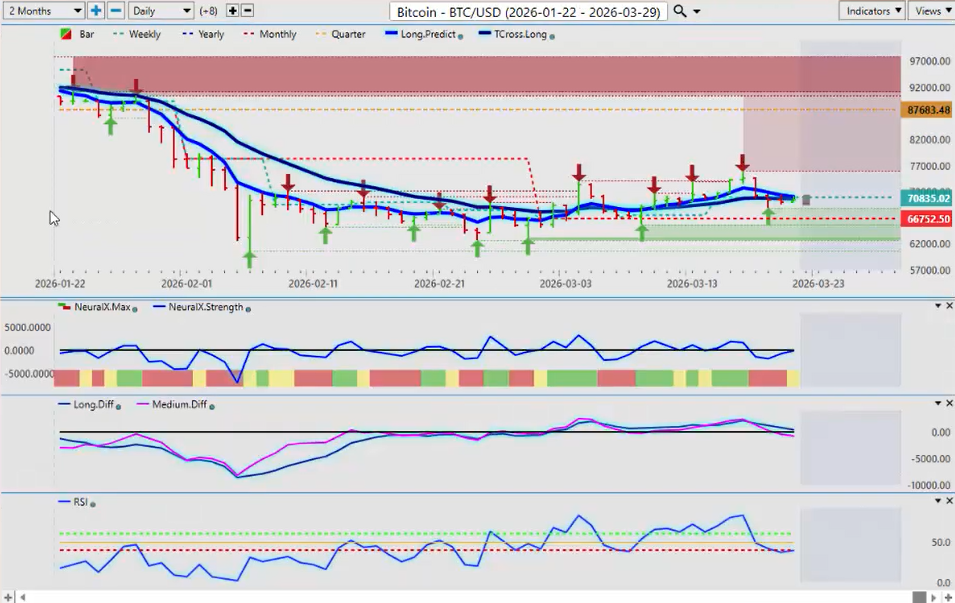
Now, Bitcoin has actually done pretty good on the month here. As I had talked about it right at the beginning of the month, there is an anomaly that’s showing strength in Bitcoin in the month of March only. So we have had a good month. But the question now remains, can we close above that very important monthly opening price at 66,752? For now, we still remain in a bear trend in Bitcoin, which is a normal pattern, guys. Three years up, one year down, three years up, one year down. We’re in that down year of that three-year cycle. The fourth year is a down year. So, perfectly normal. But I would strongly recommend that if Bitcoin moves lower, that either way, Bitcoin will go higher in mid-September through mid-October, and that could be the end of the downside. But we’ll discuss that more when we get closer to September and October. But for now, at this current moment, for next week, I am seeing weakness. I’ve got an MA diff cross here. A medium-term crossover has occurred with the pink line crossing over the zero line. The predicted RSI, however, is not showing a lot of momentum to the downside. So, maybe we’ve got another week left of buying here, but April could be a tough month either way for Bitcoin.
Euro/US
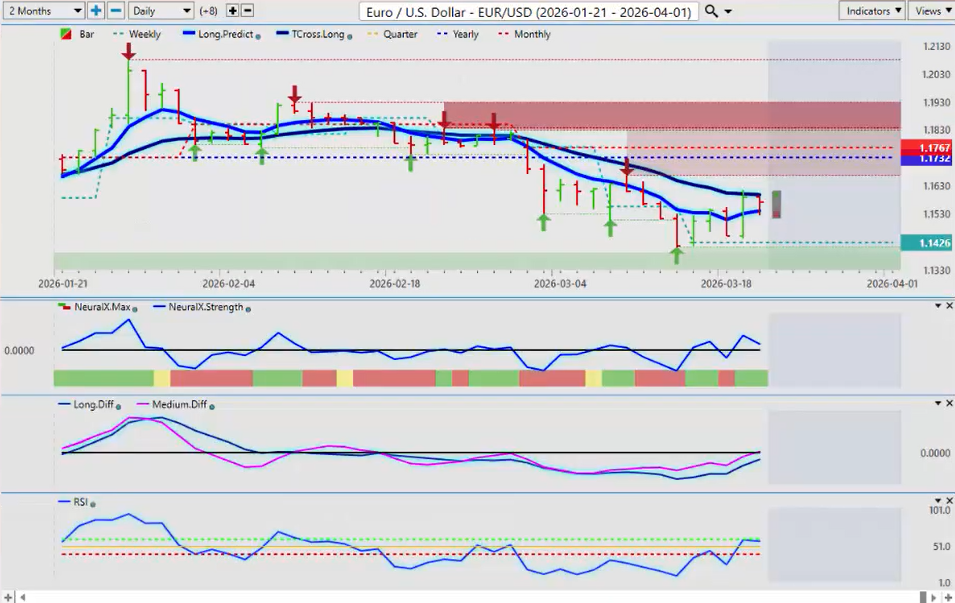
Now, when we look at some of the main forex pairs, starting with Euro/US and doing a comparative analysis between the euro and the DAX 30. So, the euro is pushing higher here. We just need to get across the T-cross long. So, when we’re looking at this indicator setup, these are the core VP indicators. So, that predicted moving average, the T-cross long, is coming in at 116. If we can clear that, then we start pushing higher back towards the yearly opening price, and I can’t rule that out by month-end here that we don’t move back to the 117 level. So again, 11732. The indicators in VP are bullish on the euro, but the question remains, is this simply corrective in nature in the current downtrend? Now again, much like the equity markets, this started with the Iran-US war, Israel war. So again, if that starts to wind down here, then we would see the euro recovery. So, very much a fundamental market we’re trading in, but the T-cross long, that is the level we need to get above this level, guys, and stay above it. Okay. [snorts]
US/Swiss Franc
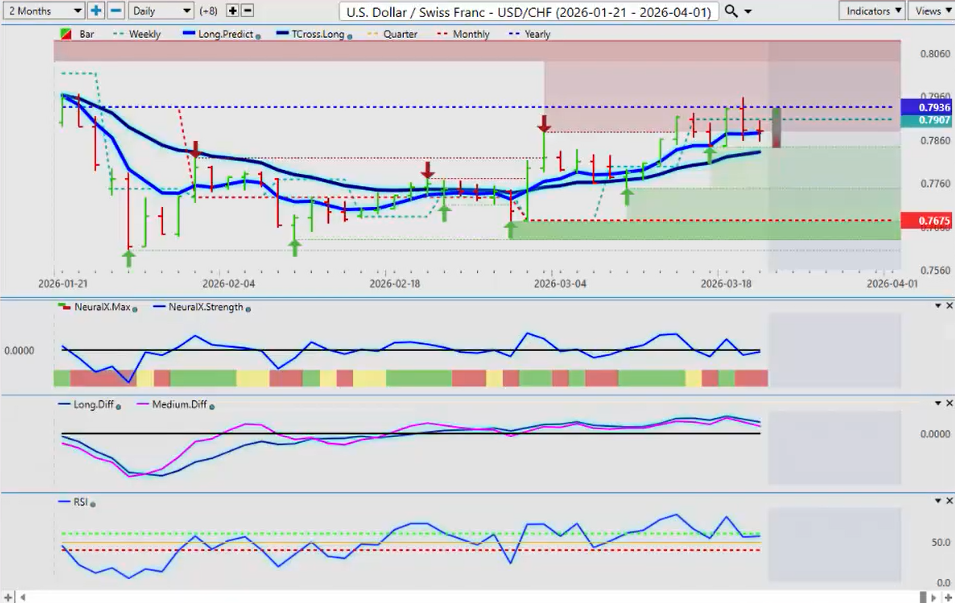
US/Swiss Franc, very, very close, inversely correlated, and you can see the importance of the calendar yearly opening price. Not a random 52 weeks here, guys. January 1st, we reset the new yearly opening price, and we gauge the market off of that, what the real primary trend is. So, the primary trend on this pair has clearly been down, and it’s been down for some time, the better part of the year since January. So, this is a corrective move right back to where we started, guys. So, all of our levels, our decision-making, should be around that yearly opening price at 7936. If we can get above it and stay above it, close above it a minimum two consecutive days in a row, then we’ve got a new long trade. But my optimism on that scenario is heavily guarded. I believe ultimately this pair goes lower, even with the Swiss National Bank interfering. I almost used the word intervening in the currency markets, but I would actually refer to it as interfering, not intervening. They need to stay out of this and let the market decide. So, they’re trying to deter people from moving into the Swiss franc, but I don’t believe it’s working. Not as of yet. So, watch that level very closely. And the VP indicators are actually warning that this is getting ready to move lower yet again. [snorts]
British Pound/US Dollar
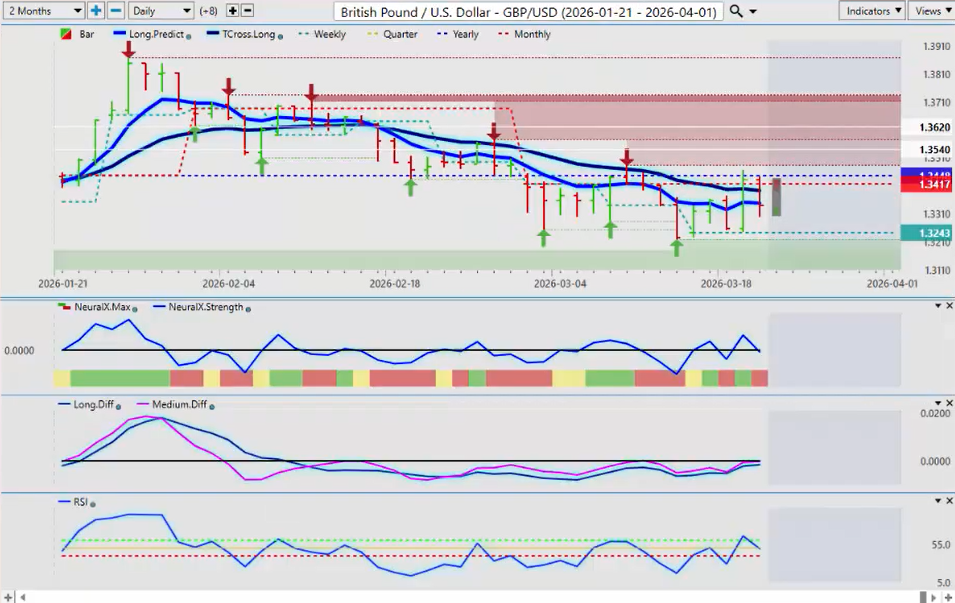
Now, the British pound/US dollar, some recovery this week, but once again the importance of using not a 52-week lookback or a 52-week level, but January 1st we do a reset. So right now, the British pound remains in a downtrend while below that yearly opening price 13448. That is the key level to watch here, guys, along with the T-cross long at 13392. So, we know where all of our resistance is between 13392 and 13448. We need a break of this and a close above that yearly opening price again two days in a row. I believe we can potentially get that as early as next month, but I’m not convinced we’re going to get it this month just yet. But the indicators in VP, the predicted difference, the neural index, it looks like it’s possible. Let’s just say that. So again, as long as you know your levels, guys, you know exactly where your problem areas are.
Dollar/Yen
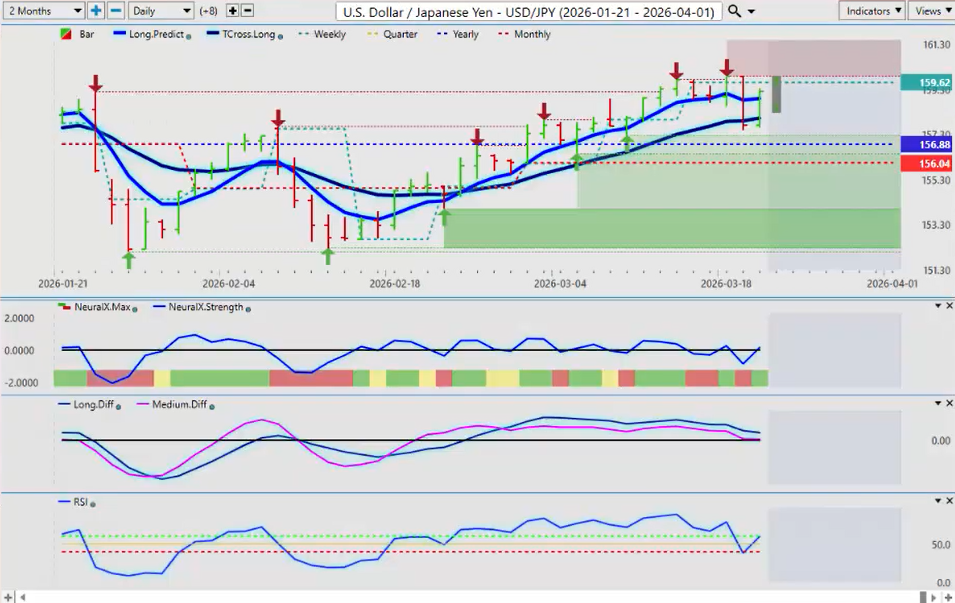
Now, with the dollar/yen, again, the US pushing higher in the carry trade. But I believe there’s a lot of confusion around this Fed. I don’t believe he knows what he’s doing. And again, I believe whether he likes it or not, they’re going to be cutting. And they keep going on about supply chain shock and risk, higher inflation because of oil. That’s a short-term issue. The Fed should know better than this. And I believe they just want to keep interest rates higher. That’s what I believe. But they will be cutting coming forward, and ultimately that would affect this pair, particularly if the Bank of Japan decides that they’re going to break the modern monetary theory that they’ve been following for decades and they start to hike. So, if they hike, the Fed cuts, that can change very quickly. So again, 15688, guys, every week I will discuss this level. That’s your problem zone right there. There is a long trade while holding above that, but I don’t believe we will be able to stay above it for very much longer. I believe probably by May, as early as mid-April or May, when the Fed has to acknowledge, or when Kevin Warsh comes in, he’s already said he’s going to cut. He just has to convince the group there. But for now, as long as you’re above the T-cross long and the yearly opening price, I will absolutely concede that the primary trend is up while above 15804, and more importantly 15688.
US/Canadian
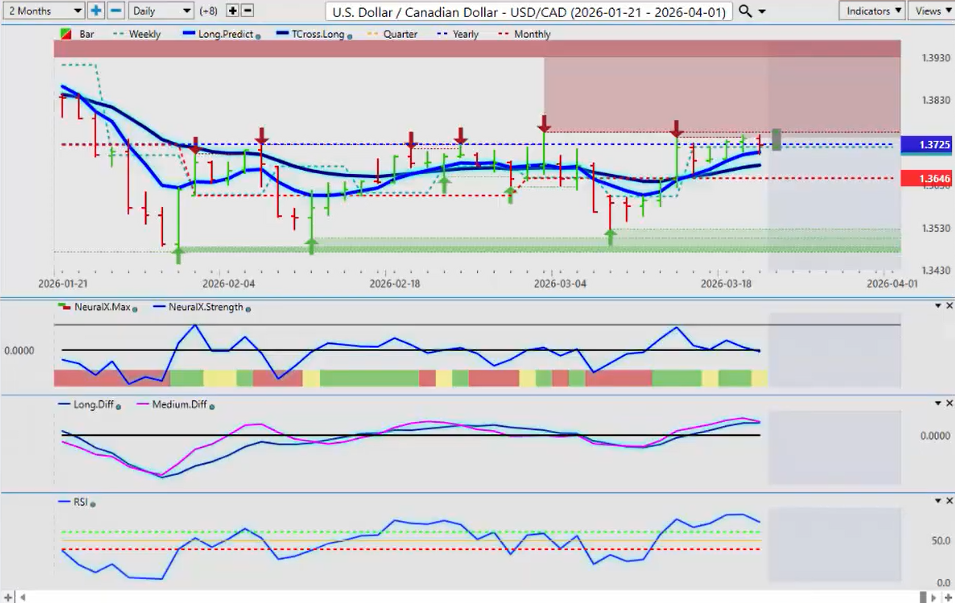
Now, the US/Canadian pair, going into our commodity and equity-based currencies, if those stocks turn around, it’s really going to help the Canadian dollar, the Aussie, and the Kiwi. Now [snorts], the bulls and the bears, guys, they have been fighting it out around this yearly opening price for months. This is not a new thing. We go back into the beginning of February. Failure at the yearly, failure at the yearly, multiple, multiple failures here every time it gets near this yearly opening price, and that’s coming in about 13725. We just can’t get any traction above here. Now, the Canadian economy not doing well. It’s doing horrible under Carney. Terrible, actually. And they’ve got a bunch of different reasons who they’ll blame that on, but it comes down to the man in charge, right? So, it is difficult to buy Canadian dollars under the economic numbers coming out of Canada, but it’s still a high correlation to equities and more specifically oil. So, that’s giving the Canadian dollar a boost. But if oil prices come back down, then we’ve got to look closer at this. So, the line in the sand here, we’ve got a verified resistance high. That’s the best it’s done, 13753. We shall see here, but we need to make a clean break out of this to go higher. And the Bank of Canada is signaling that they’re warming up to rate cuts, and that’s a negative again for the Canadian dollar. [snorts] But again, right now, where we’re at, the T-cross long, that’s coming at 1367. That’s your key downside level, and your upside level is again 13725. We need to make a clean break of this, guys, before I would be willing to go long at these particular levels when you can see the short has worked incredibly well repeatedly using a non-indicator like the yearly opening price. Simply price-based, right, are we positive or negative on the year, what is the trend, and that’s where I think 70 to 80% of traders struggle, trying to figure out, well, what is the trend, overall trend. The yearly opening price will easily identify that, and then we overlay the VP indicators on top of that and get a much cleaner signal.
Aussie
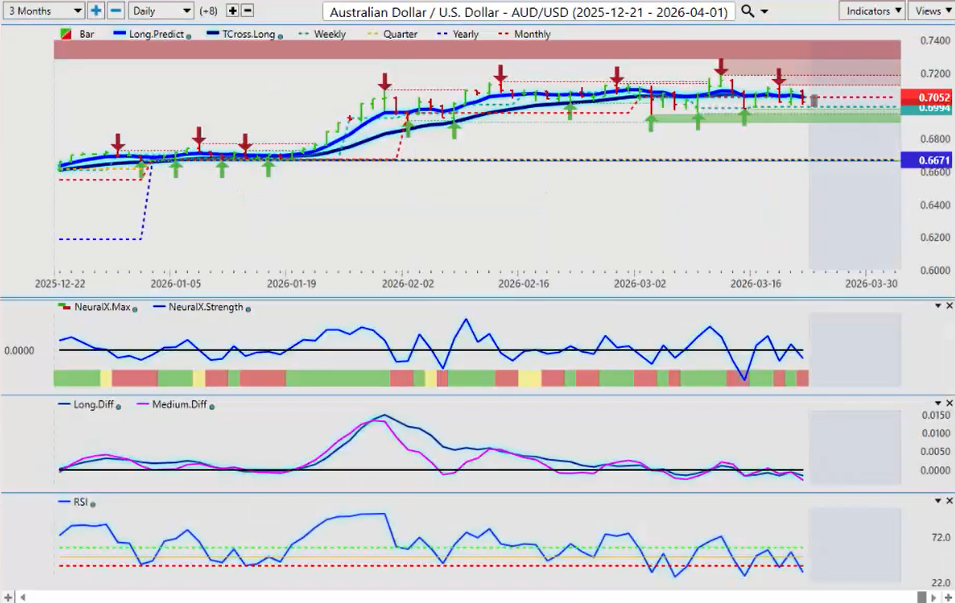
Now, the Aussie, there is no mistaking what the trend is here, guys. It is strongly up all year long. Nothing has changed here. 6671 is the key level. Again, a lot of people talking about the Aussie is bearish, yada yada yada. That’s just not factual. This is where it started the year, and this is where we are now. Then when we do a quick check on that using the yearly opening price to where we closed on Friday, right, the Aussie is again having a heck of a year, up 5.21%. This is an anomaly, guys, because in most cases if the equity markets like the S&P, the NASDAQ are tanking, then the Aussie usually is too. That’s not what is happening here. So, the intermarket correlations are definitely changing. Real money is going into the Aussie. So, for next week, I would prefer we stay above the monthly opening price, but buying on a dip is absolutely the preferred strategy.
Kiwi
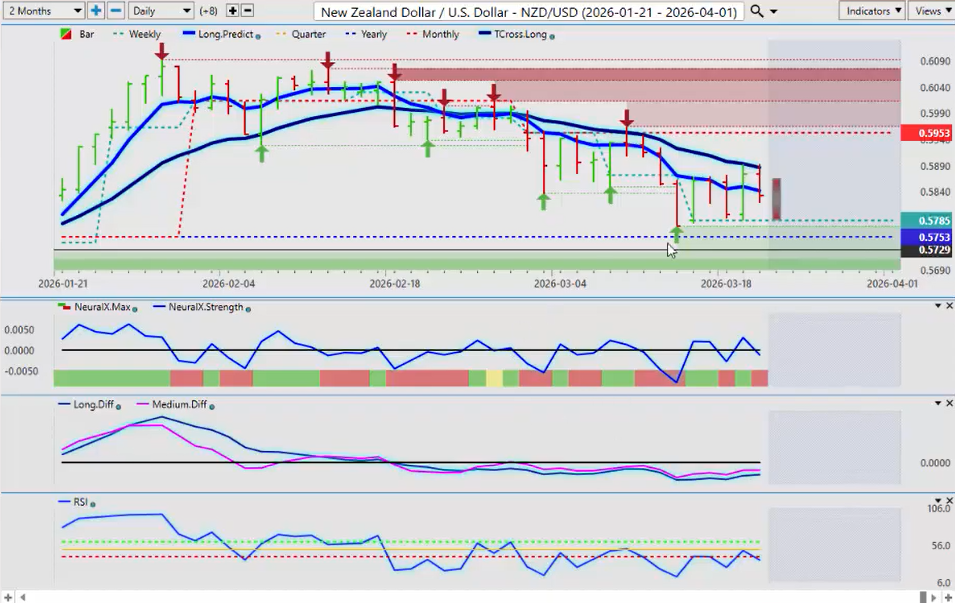
Now, look, making sure we’re looking at everything. What does concern me currently [snorts] is we have an MA diff cross to the downside below the zero line. We have closed below the T-cross long. So, the T-cross long for next week, 7051. This is the level you want to keep your eyes on, guys. We need to get above this level and stay above it in order to remain long. And again, Australia, New Zealand under a little bit of pressure, adding to the downside. But realistically, when we look at the Kiwi, the Kiwi has come down within a matter of a few pips from the calendar yearly opening price, where everybody is super bearish on this. That yearly opening price at, as I said last week, 5753, I don’t think you’re going to see any sellers down here. And sure enough, it moves back up. Now, the question remains, is this just corrective in nature? And this is why we layer in the VP core indicators like the T-cross long. This is not a coincidence that it stopped on Thursday and Friday exactly at that level. That is very concerning for longs. So, if I’m going to go long here, guys, starting at least on Monday, the predicted low for the day is 57.87. That’s a reasonable long trade in that area. But always make sure you keep your stops at least 50 to 60 pips below the calendar yearly opening price. [snorts]
Now, next week we’ll see heightened volatility yet again. But with that volatility, and using advanced intermarket technical analysis, there will always be opportunity. So, with that said, this is the Vantage Point AI market outlook for the week of March 23rd, 2026.


