The AI stock spotlight this week is Exxon Mobil ($XOM)
Let’s talk about Exxon Mobil Corporation, better known as $XOM, which is what happens when geology, geopolitics, and capitalism all get locked in a room and told to produce cash flow. Exxon didn’t just appear one day like a meme stock with a Reddit following. It crawled out of the primordial ooze of American industry. It started as part of Standard Oil back in the 1800s, got broken up by the government for being too good at making money, reassembled itself over decades through mergers including Exxon and Mobil in 1999, survived multiple oil crashes that wiped out weaker players, now operates at a scale where it drills, refines, transports, and sells energy across the planet, and still matters because when oil prices move, economies and stock markets tend to follow like nervous sheep.
Now, what does Exxon Mobil actually do besides printing money when the world gets messy? At its core, Exxon Mobil is an energy toll booth. It makes money in three main ways. Upstream, which means finding and pulling oil and gas out of the ground. Downstream, which means refining that crude into gasoline, diesel, jet fuel, and petrochemicals. And chemicals, which is the less glamorous but highly profitable business of turning hydrocarbons into plastics and industrial materials.
The upstream segment is where the drama lives. Oil prices go up, profits explode. Oil prices go down, profits shrink faster than a wool sweater in hot water. Downstream and chemicals act like shock absorbers. When crude prices fall, refining margins often improve. Exxon Mobil calls this “integration.” Traders call it “not blowing up during downturns.”
Revenue is driven mostly by global oil and gas prices and production volume. That means Exxon Mobil is less of a company and more of a macro instrument with a logo. Its customers are basically everyone who drives a car, flies on a plane, or buys anything made of plastic, which is to say everyone.
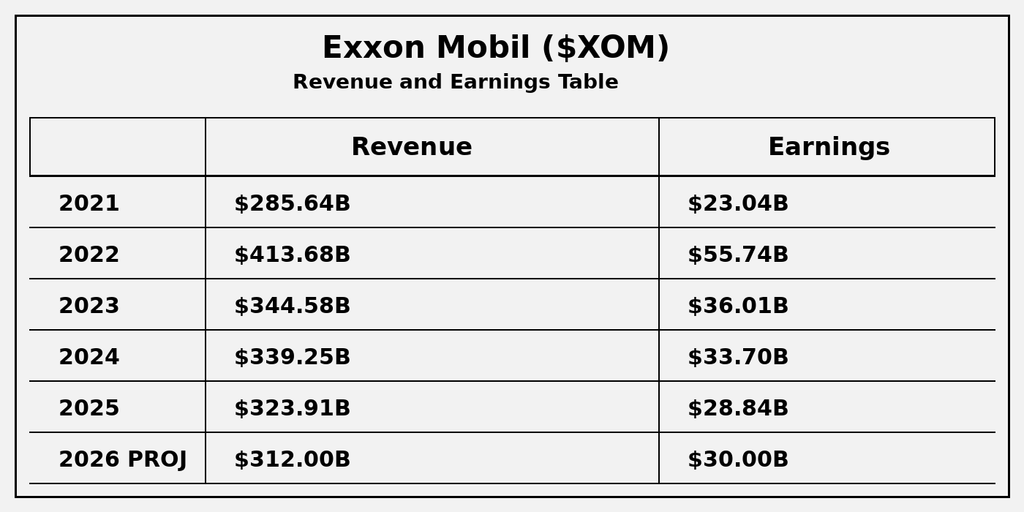
What stands out in $XOM is not just scale, but the elasticity of its earnings power relative to revenue, a dynamic that reveals far more about the business than the top line alone. Revenue, while massive, behaves with a kind of controlled drift, rising to $413.68B in 2022 before settling back into the $300B range, a reminder that commodity-driven businesses are ultimately tethered to forces beyond management’s control. But earnings tell the real story. They surge, collapse, and recalibrate with striking intensity, from $55.74B at the peak to under $30B just a few years later, exposing the operational leverage embedded in the model. This is not instability in the traditional sense; it is sensitivity, a direct transmission of global energy pricing into corporate profitability. For investors and traders, the implication is unavoidable. You are not simply analyzing a company. You are underwriting a macro thesis, one where margins expand and contract with the rhythm of oil markets, and where volatility is not a bug, but the defining feature of the investment itself.
The company is headquartered in Irving, Texas. It employs roughly 60,000 people globally. Leadership is currently under CEO Darren Woods, who has the unenviable job of balancing investor demands for returns with political demands to stop using the very product that funds those returns. Competitors include Chevron, Shell, BP, and a growing cast of national oil companies that don’t have to worry about quarterly earnings calls or ESG scorecards.
Financially, Exxon Mobil is what happens when a capital-intensive business is run by people who have seen multiple commodity cycles and still sleep well at night.
Revenue rises and falls with oil prices. No mystery there. When crude is high, Exxon Mobil looks like a genius. When crude drops, analysts suddenly rediscover the word “cyclical.” Margins are strong relative to peers because of scale, operational efficiency, and its integrated structure.
Cash flow is the real story. Exxon Mobil generates massive operating cash flow in strong environments, which it uses to fund dividends, buybacks, and new projects. It is not a startup burning venture capital. It is a cash machine that occasionally needs billions to drill holes in the earth.
Debt is manageable. Exxon Mobil learned its lesson during the pandemic when it had to borrow more than it liked. Since then, it has focused on deleveraging and maintaining a fortress balance sheet. Capital intensity remains high because digging oil out of the ground is not cheap, and neither is building refineries or LNG facilities.
Here is what traders tend to misunderstand. They treat Exxon Mobil like a normal stock. It is not. It is a leveraged bet on energy prices with built-in hedges. If you do not understand the macro environment, you are trading blindfolded and calling it technical analysis.
Right now, traders are asking three big questions.
First, how sustainable are current oil prices? If oil stays elevated due to geopolitical tension and supply constraints, Exxon Mobil keeps minting cash. If prices fall, the entire narrative weakens.
Second, how aggressive will Exxon Mobil be with buybacks and dividends? Income investors love $XOM for its yield, and traders love buybacks because they provide a steady bid under the stock.
Third, how much growth is left? Exxon Mobil has been investing heavily in projects like Guyana, which is one of the most profitable oil developments on the planet. Traders want to know if that growth pipeline can continue or if we are approaching peak production expansion.
Now let’s talk about what has actually moved the stock recently.
Over the past 30 days, the dominant theme has been geopolitical tension, particularly in the Middle East. That is trader code for “risk premium on oil.” When conflict threatens supply routes or production, oil prices rise, and Exxon’s earnings outlook improves immediately.
What is actually new is not that oil is volatile. That is as old as oil itself. What is new is the persistence of elevated prices alongside disciplined supply from OPEC and limited U.S. production growth. The market expected more supply. It did not get it.
What is already priced in is that $XOM will benefit from higher oil prices. That is not a secret. What may not be fully priced in is how long this environment could last if geopolitical tensions remain unresolved.
Wall Street tends to underestimate duration. Analysts are very good at forecasting the next quarter and very bad at forecasting the next surprise.
Where expectations could be wrong is on downside risk. If demand weakens due to a global slowdown, oil could drop faster than analysts expect. $XOM’s earnings would follow. That scenario is always one headline away.
So why is the stock up?
Over the past 90 days, $XOM has benefited from rising oil prices, strong refining margins, and continued execution in its upstream projects, especially Guyana. The market rewards consistency, and Exxon Mobil has delivered it.
Year-to-date, the stock has outperformed the broader market because energy has been one of the few sectors showing actual strength while many growth stocks struggle. Compared to the Energy Select Sector SPDR Fund, Exxon Mobil has performed in line to slightly better depending on the timeframe, largely because it is one of the largest weights in that ETF.
The narrative says “energy is back.” The data says “cash flow is real, and supply is constrained.” Traders should always choose data over narrative.
Analysts generally agree that Exxon Mobil is well positioned due to its low-cost production and strong project pipeline. Where they tend to fail historically is assuming stable oil prices. Oil is not stable. It is a geopolitical mood ring.
Now let’s talk opportunity and risk.
What could go right is simple. Oil stays high, Exxon Mobil keeps producing at low cost, cash flow remains strong, buybacks continue, and the stock grinds higher. This is the base case.
What could go wrong is equally simple. Oil drops due to demand destruction or unexpected supply increases. Margins compress. The stock sells off.
The biggest upside surprise would be a prolonged period of high oil prices combined with production growth from projects like Guyana exceeding expectations. That is the scenario where $XOM looks less like a value stock and more like a growth story.
The biggest blind spot is how quickly sentiment can shift. Energy stocks are loved until they are not. When the macro turns, it turns fast.
Looking ahead, there are a few key catalysts.
Earnings releases, typically late April and late July. These matter because they confirm whether high oil prices are translating into actual profits.
OPEC meetings, which occur periodically throughout the year. These matter because supply decisions directly impact oil prices.
Geopolitical developments in key regions like the Middle East. These do not come with scheduled dates, but they move markets instantly.
For traders, $XOM is not a stock you buy because you like the company. It is a stock you trade because you understand the environment.
It may be best suited for traders who are comfortable with macro-driven moves and who can align themselves with sector strength. If energy is leading, Exxon Mobil is a natural candidate. If energy is lagging, there are better places to be.
For the trend to continue, oil prices need to remain elevated or at least stable, and Exxon Mobil needs to keep executing on its production growth and capital return strategy.
Early trouble signs would include a breakdown in oil prices, weakening refining margins, or any indication that global demand is slowing faster than expected.
The bottom line is this.
$XOM is not exciting in the way a tech stock is exciting. It is exciting in the way a cash register is exciting when it keeps ringing.
If you want drama, go elsewhere. If you want to follow money, watch the price of oil.
In this weekly stock study, we will look at an analysis of the following indicators and metrics which are our guidelines which dictate our behavior in deciding whether to buy, sell or stand aside on a particular stock.
Wall Street Analysts Ratings and Forecasts
52 Week High and Low Boundaries
Best-Case/Worst-Case Analysis
VantagePoint AI Predictive Blue Line
Neural Network Forecast (Machine Learning)
VantagePoint AI Daily Range Forecast
Intermarket Analysis
VantagePoint AI Seasonal Analysis
Our Suggestion
While our decisions are ultimately guided by artificial intelligence forecasts, we still take a brief look at the fundamentals to understand the financial landscape in which $XOM is operating under.
Wall Street Analysts Price Forecasts
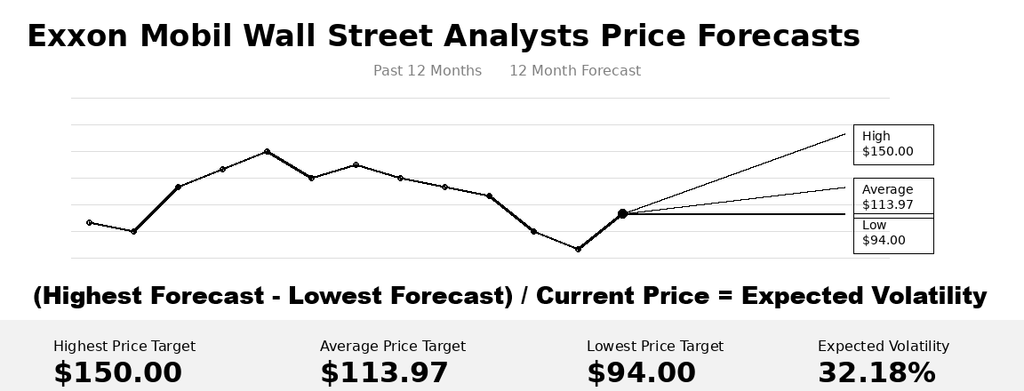
At $170, Exxon Mobil is already trading above the highest analyst target of $150, with the low sitting all the way down at $94 and the average parked at $113.97. That spread is not subtle. That’s a $56 gap between the most optimistic and most pessimistic views. Run the math and you get an expected volatility of 32.94%. In plain English, Wall Street is all over the place. This is disagreement dressed up as research.
Now here’s where it gets interesting for traders. When you see a spread like this, you’re not looking at clarity. You’re looking at opportunity. Wide dispersion means uncertainty, and uncertainty is where price moves live. Tight ranges give you boredom. Wide ranges give you trades. The key is not predicting which analyst is right. It’s recognizing that the market doesn’t need agreement to move. It just needs imbalance. And right now, price is leaning hard in one direction while analysts are still arguing about the map.
Here’s the part most people miss. The stock is already above every major target. That tells you something important. Analysts are not leading here. They are chasing. Price has outrun their models, their assumptions, and probably their comfort levels. Historically, that ends one of two ways. Either analysts rush to raise targets and justify the move, or price snaps back to meet reality. Your edge is not guessing which one happens. Your edge is recognizing that when price gets ahead of consensus, something has already changed under the surface.
52 Week High and Low Boundaries
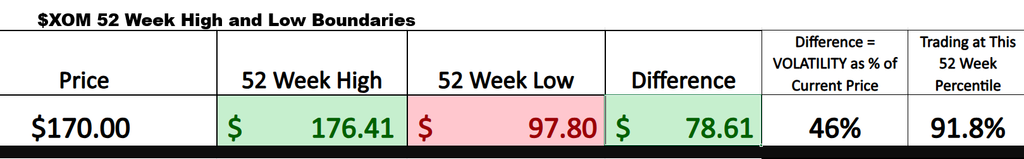
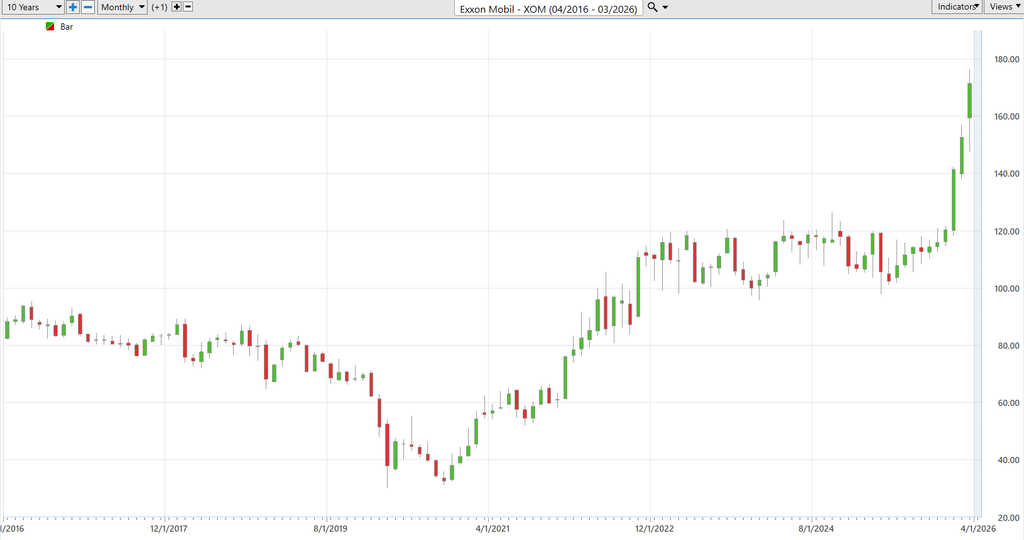
At $170, Exxon Mobil is trading just below its 52-week high of $176.41 and well above its 52-week low of $97.80. That places the stock at roughly 92% of its 52-week range, which is firmly in the upper zone where strong trends live. The total range between high and low is $78.61, and when you divide that by the current price, you get a historical volatility proxy of 46.24%. Translation: this stock moves, and it has proven it over the past year.
Now here’s what that actually means for you as a trader. Stocks that live near their highs tend to stay near their highs until something breaks. That’s trend persistence. This is not where you look for bargains. This is where momentum traders get paid. Price is not wandering around the middle of the range. It is pressing against the ceiling. That tells you buyers have been in control, and more importantly, they have not been shaken out yet. If this were weak, it wouldn’t be sitting here.
Here’s the real edge. When a stock is sitting at 92% of its range with a volatility profile north of 46%, you’re not dealing with a quiet, stable asset. You’re dealing with a pressure point. Either it breaks out and expands the range higher, or it fails and snaps back into the range quickly. That’s the trade. The risk is not that nothing happens. The risk is that something happens fast. Your job is not to predict which direction. Your job is to recognize that this is where big moves are born.
One of our all-time favorite watchlists focuses on stocks doing something very few can achieve, making simultaneous new 52-week highs and new 10-year highs, because that is where true leadership lives. These are not random breakouts, they are signals of sustained institutional demand and long-term trend dominance aligning at the same time. Exxon Mobil wears this title proudly right now, and when a stock checks both boxes, it deserves a front-row seat on every serious trader’s radar.
Best-Case/Worst-Case Scenario Analysis
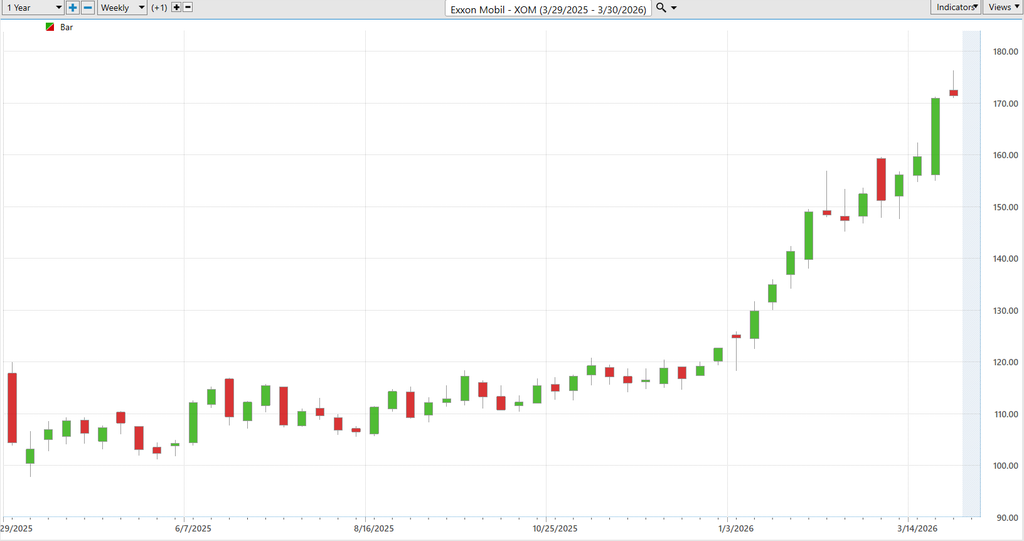
The best way to validate expectations is to look at both risk and reward in the context of what the asset has actually done over the past year. Measure the largest rallies. Measure the largest declines. This simple, practical exercise allows traders to build a grounded risk-reward profile based on recent price action, not opinion. And it does something even more important. It takes volatility out of the theoretical realm and forces it into the real world, where capital is actually won or lost.
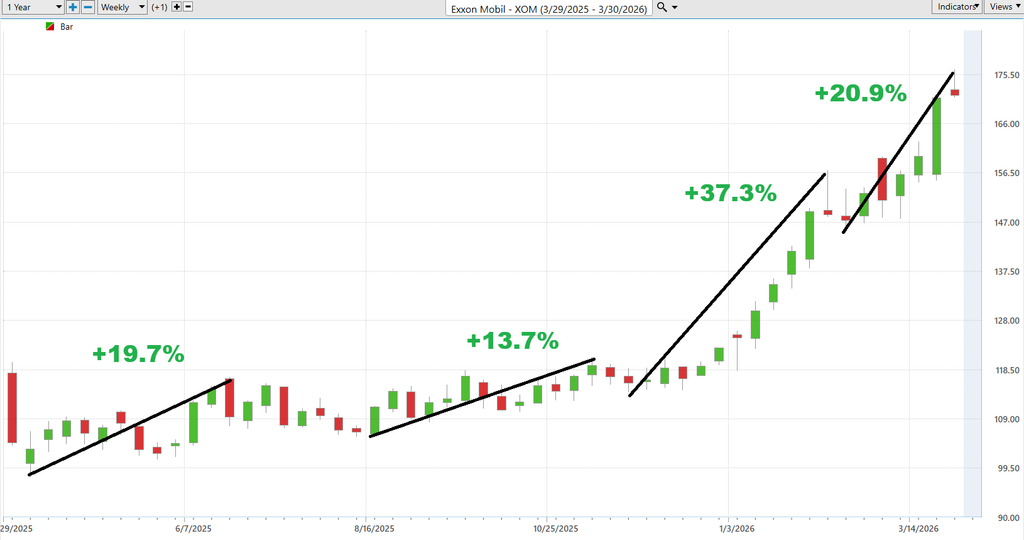
The best-case scenario for $XOM is not hypothetical, it is already written in the tape. Over the past year, Exxon Mobil has delivered multiple sustained rallies, most notably advances of +19.7%, +13.7%, +37.3%, and a more recent +20.9% surge. These are not marginal moves, they are institutional footprints. They tell you that when capital commits to this name, it does so with persistence and scale. This is what upside looks like in the real world, not in a spreadsheet. If strength continues, the precedent is clear, trends in this stock have a habit of extending far beyond what most traders expect.
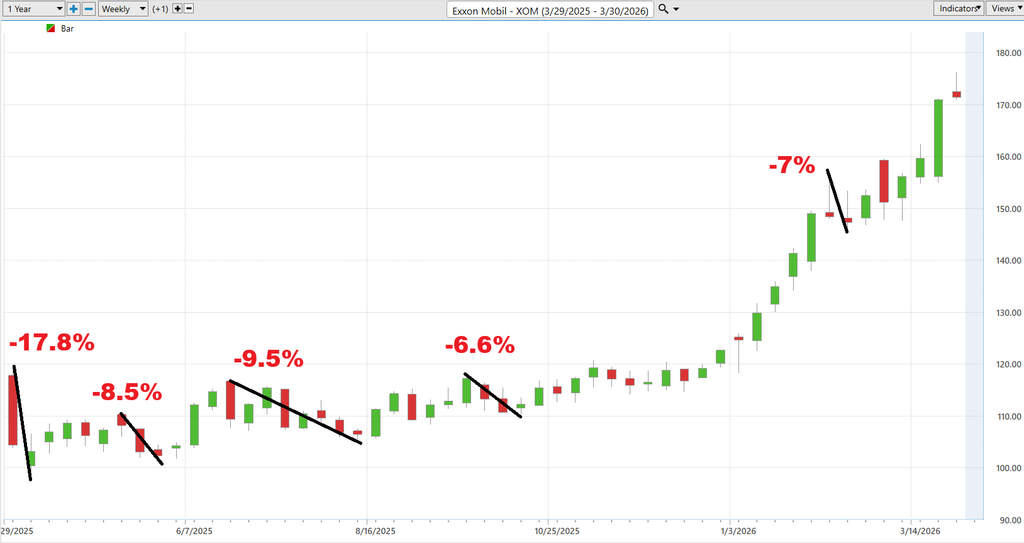
Now contrast that with the worst-case scenario. The same chart reveals a series of declines measuring -17.8%, -8.5%, -9.5%, -6.6%, and a more recent -7% pullback. Again, these are not guesses, they are lived outcomes. They define the downside envelope that traders must respect. Importantly, the magnitude of the declines is consistently smaller than the most powerful rallies, a subtle but critical asymmetry that tilts the longer-term risk-reward profile in favor of the bulls, provided the trend remains intact.
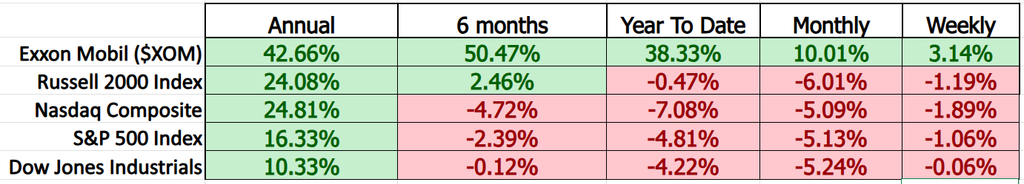
$XOM is leaving the rest of the stock market in the dust. While the major indexes are stumbling, this stock is acting like it didn’t get the memo. That’s what real leadership looks like, steady strength while everything else drifts or drops. If you’re serious about trading, you follow the money… and right now, it’s clearly flowing into $XOM.
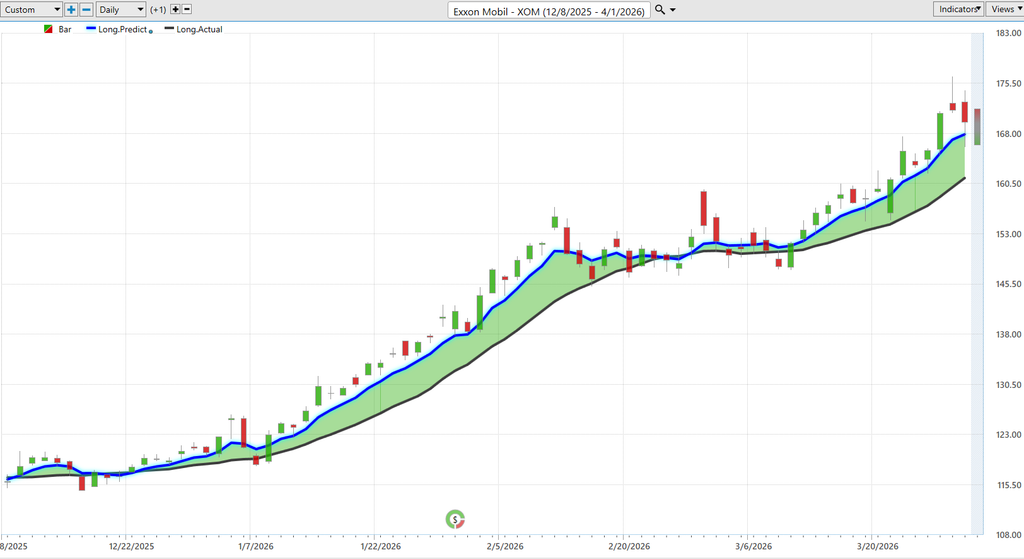
VantagePoint AI Predictive Blue Line
The Predictive Blue Line on $XOM is a forward-looking indicator designed to anticipate where price is likely headed next, not where it has already been. Unlike the black line, which is a traditional 10-day simple moving average showing past price behavior, the blue line is driven by artificial intelligence and reflects a projected trend. Right now, both lines are rising, but the key takeaway is that the blue line is leading the move, not lagging it.
What matters most is the slope and the relationship between the two lines. The blue line is clearly trending higher and remains above the black line, signaling a strong bullish bias. There are no meaningful bearish crossovers present, and the consistent upward slope tells you momentum remains intact. Even during brief pauses, the structure holds, which is exactly what you want to see in a sustained trend.
From a trading standpoint, this is a textbook example of alignment. Pullbacks toward the blue line represent opportunity, not weakness, as long as the slope remains upward. Fighting this trend is a low-probability decision. The higher-probability approach is simple, stay aligned with the direction of the predictive blue line and let the trend do the heavy lifting.
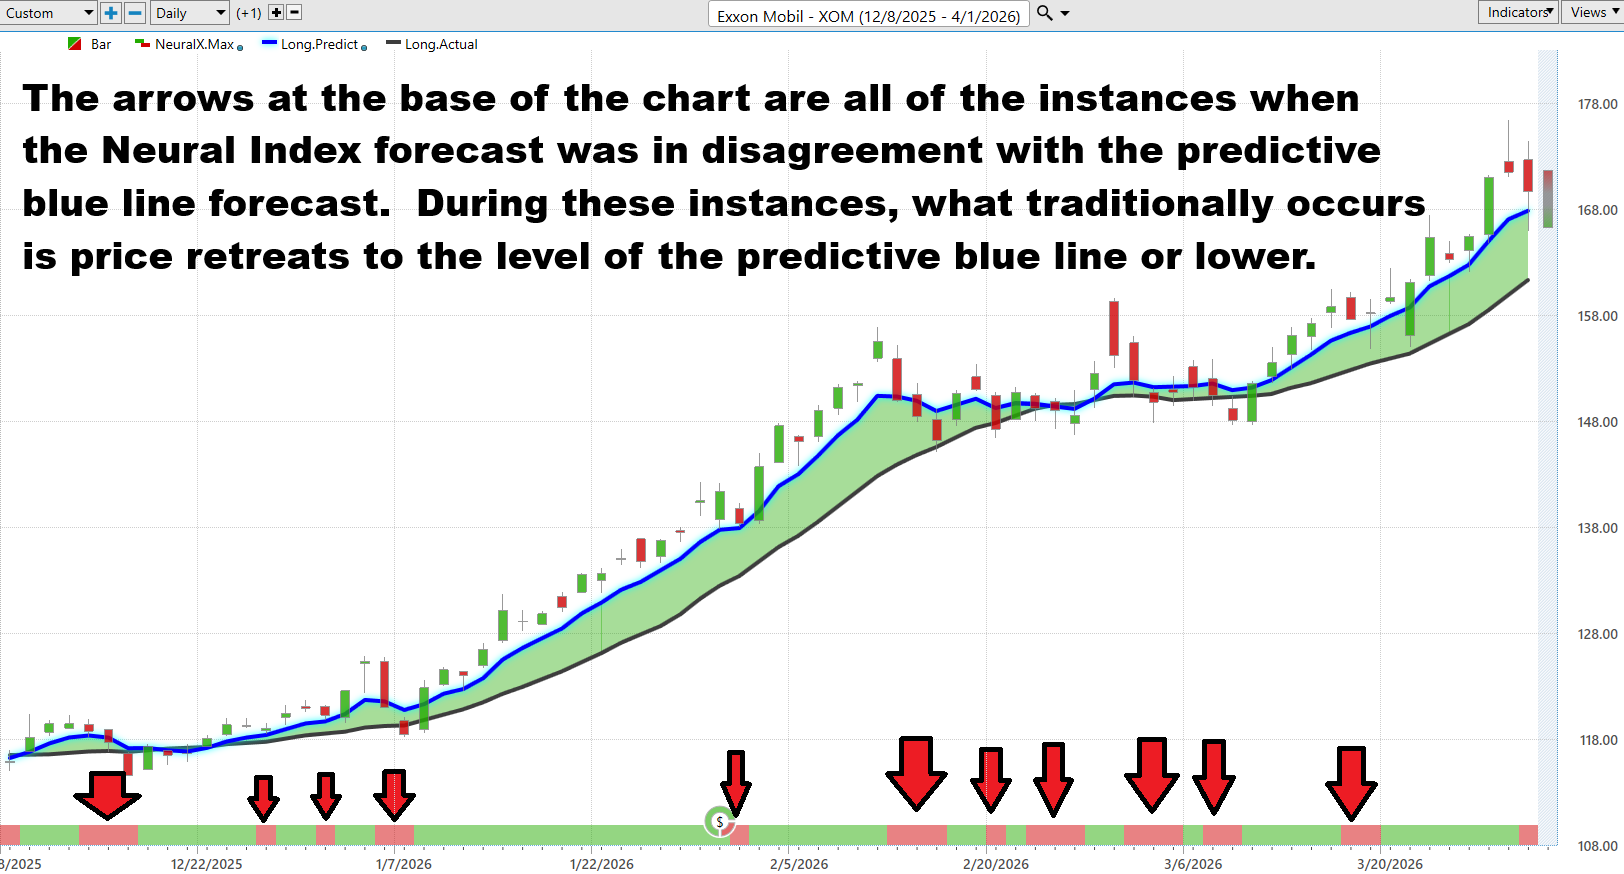
VantagePoint AI Neural Index (Machine Learning)
The Neural Index is a short-term forecasting tool that predicts strength or weakness over the next 48 to 72 hours using machine learning. It does not replace the trend, it refines timing. In the case of $XOM, the broader trend is clearly bullish, but the Neural Index highlights moments when that trend is temporarily out of sync with short-term conditions.
The arrows in the chart mark those exact moments, when the Neural Index turns negative while the Predictive Blue Line remains bullish. What consistently follows is not a trend reversal, but a reversion move, where price pulls back toward the predictive blue line or slightly below it. This is critical. It shows that disagreement between the Neural Index and the broader trend often leads to short-term weakness within a larger uptrend, not a collapse.
From a trading standpoint, this is where precision is created. When both the Neural Index and the Predictive Blue Line are aligned, the probability of continuation increases significantly. When they diverge, as shown repeatedly in this chart, it signals caution and often precedes a pullback. The takeaway is simple. Use the Neural Index to avoid chasing strength at the wrong time and instead position yourself for higher-probability entries when price resets back toward the trend.
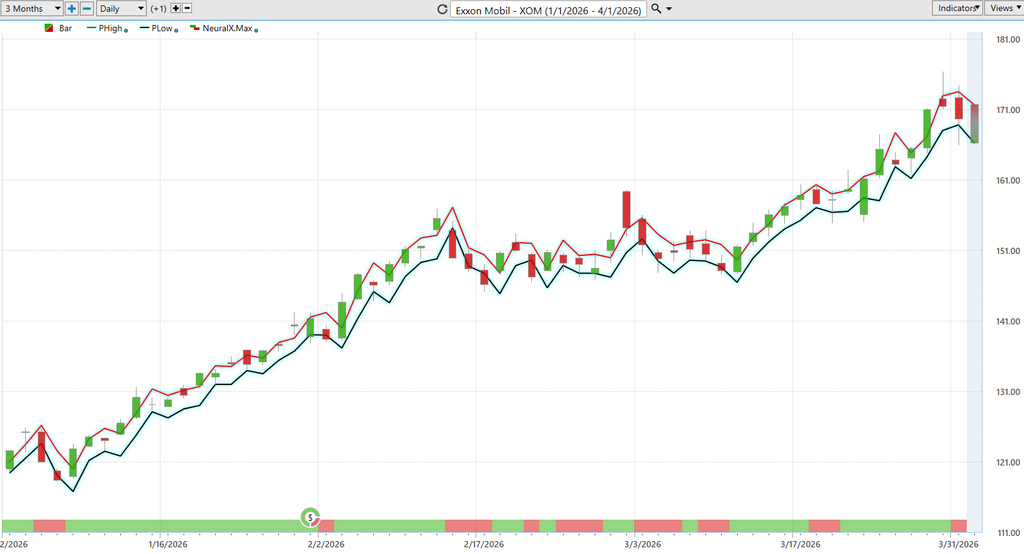
VantagePoint AI Daily Range Forecast

Every trader is chasing the same edge, whether they admit it or not. They want to know, before the market opens, where risk lives and where opportunity hides. Not in theory. Not after the fact. But in real time, when decisions actually matter. That is exactly what the VantagePoint AI Daily Range Forecast delivers. It defines the battlefield in advance. It tells you how far price is likely to travel, where it may stretch too far, and where it is most likely to reset.
Look at the chart. The evidence is not subtle. Price moves with rhythm, expanding and contracting within a range that the forecast maps out day after day. When price pushes toward the upper boundary, risk increases. When it pulls back toward the lower boundary, opportunity begins to reappear. This is not guesswork. It is structure. And for traders focused on short-term price movement, that structure is where consistency is built.
That is where a repeatable framework becomes less of a luxury and more of a necessity. The Daily Range Forecast is not just another overlay. It is a forward-looking map that updates every trading day, outlining both the expected range and the prevailing direction. What stands out immediately is how closely that forecast tracks the trend, offering a disciplined view of where price is likely to move, and just as importantly, where it is likely to hesitate. It does not remove uncertainty. It organizes it. And in a market defined by constant motion, the ability to define risk and opportunity in advance is what separates impulsive trading from professional execution.
Intermarket Analysis
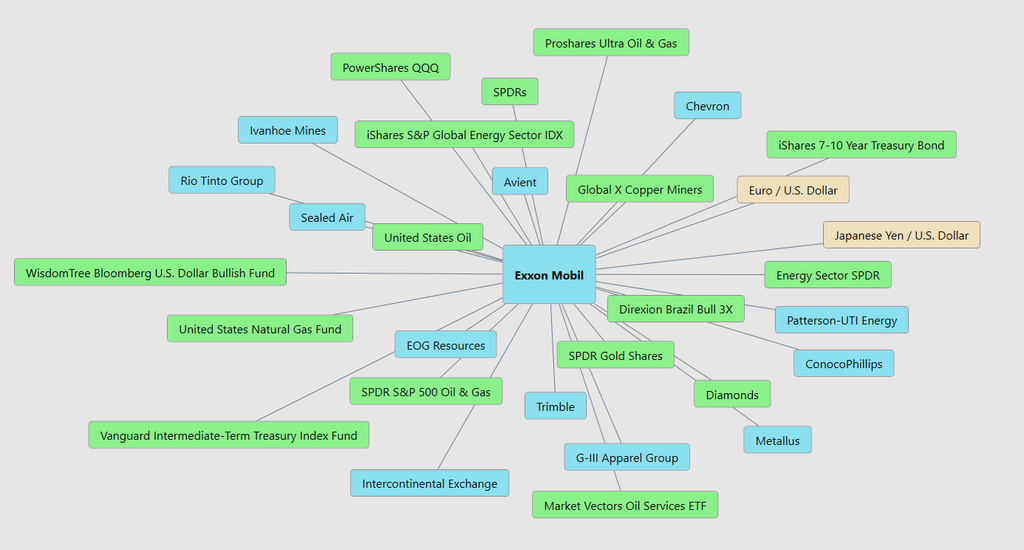
Exxon Mobil $XOM does not move in isolation, it sits at the center of a very crowded intersection of markets, and that is exactly what this intermarket web makes clear. The primary drivers are still energy itself, instruments like USO, UNG, and the broader energy complex through XLE and global energy indexes are all feeding directly into price behavior. When money flows into energy, $XOM responds immediately, and right now that flow is clearly supportive.
But the story goes deeper. You are also seeing strong linkages to other commodity plays like COPX and global miners, which tells you this is not just an oil trade, it is a broader “real assets” bid. Even gold via GLD is part of the ecosystem, reinforcing the idea that capital is rotating toward tangible assets and away from purely financial ones. That is a macro tailwind that extends beyond Exxon itself.
Then you have currencies and rates quietly shaping the backdrop. The U.S. Dollar, EUR/USD, and JPY/USD relationships matter because energy is priced globally, while Treasury instruments like intermediate bond funds influence liquidity and discount rates. Add in geopolitical sensitivity, especially around global supply routes, and you get a system where multiple macro forces are pushing in the same direction.
Finally, the equity relationships confirm the trend. Peers like CVX, COP, and EOG, along with oil services exposure through OIH, are all part of the same feedback loop. When the entire group moves together, it validates the trend. And that is the real takeaway here. $XOM is not just strong on its own, it is being supported by a synchronized network of intermarket forces, and when that kind of alignment shows up, trends tend to persist.
Our Suggestion
$XOM is leading. You have a stock hitting new highs while the broader market struggles, backed by rising oil prices, geopolitical tension, and real capital flowing into energy. This is not a fragile move. It is a trend being reinforced by both price action and macro forces.
The play here is simple. Respect the strength and stay aligned with it. This is not where you fight the trend or try to get clever. If you are involved, you look for pullbacks, not tops. If you are not involved, you wait for opportunity, not perfection. Leadership stocks like this tend to keep leading until something breaks, and right now nothing is broken.
But do not confuse strength with safety. Oil-driven stocks move fast in both directions, and geopolitical tailwinds can disappear just as quickly as they show up. Manage your risk, size your positions correctly, and stay disciplined. The goal is not to win one trade in $XOM… it is to stay in the game long enough to catch the next one.
The last two completed $XOM earnings calls, for Q4 2025 on January 30, 2026 and Q3 2025 on October 31, 2025, had the same broad message: management is still executing the plan, still returning large amounts of cash to shareholders, and still pushing the company’s biggest growth projects forward. In Q3, Exxon said it had started up eight of its ten key 2025 projects, with the rest on track, while highlighting record production in Guyana and the Permian. By Q4, management said it had delivered all 10 of 10 key projects, achieved its highest annual upstream production in more than 40 years, and posted record refinery throughput.
So, is management hitting its goals? Yes, broadly speaking. The tone across both calls was not defensive. It was operational. Exxon kept emphasizing execution, cost savings, advantaged production growth, capital discipline, and project delivery. That does not mean the business is risk-free. In fact, management was very clear that weaker crude prices, softer chemical margins, growth costs, and divestment effects can pressure results. But the company also showed it understands those risks and is trying to offset them with low-cost barrels, structural savings, balance-sheet strength, and a big project pipeline that is meant to keep earnings power resilient through the cycle.
The next earnings call is expected around April 24, 2026 before market open and consensus expectations are around $1.80 per share. For traders, the practical takeaway is simple: put $XOM on your radar and watch it closely. Management appears to be executing, the big projects are moving, and Wall Street still cares about every signal tied to oil prices, refining margins, and buybacks.
Just remember the part too many traders forget: practice great money management on every trade. Even good stocks can punish sloppy position sizing. Use the VantagePoint AI Daily Range forecast to locate short term trading opportunities.
It’s not magic.
It’s machine learning.
Disclaimer: THERE IS A HIGH DEGREE OF RISK INVOLVED IN TRADING. IT IS NOT PRUDENT OR ADVISABLE TO MAKE TRADING DECISIONS THAT ARE BEYOND YOUR FINANCIAL MEANS OR INVOLVE TRADING CAPITAL THAT YOU ARE NOT WILLING AND CAPABLE OF LOSING.
VANTAGEPOINT’S MARKETING CAMPAIGNS, OF ANY KIND, DO NOT CONSTITUTE TRADING ADVICE OR AN ENDORSEMENT OR RECOMMENDATION BY VANTAGEPOINT AI OR ANY ASSOCIATED AFFILIATES OF ANY TRADING METHODS, PROGRAMS, SYSTEMS OR ROUTINES. VANTAGEPOINT’S PERSONNEL ARE NOT LICENSED BROKERS OR ADVISORS AND DO NOT OFFER TRADING ADVICE.