Welcome to the Artificial Intelligence Outlook for Forex trading.
VIDEO TRANSCRIPT
Wisdom Tree US Dollar Bullish Fund – $USDU ETF
Okay, hello everyone, and welcome back. My name is Greg Firman, and this is the Vantage Point AI market outlook for the week of March the 30th, 2026.
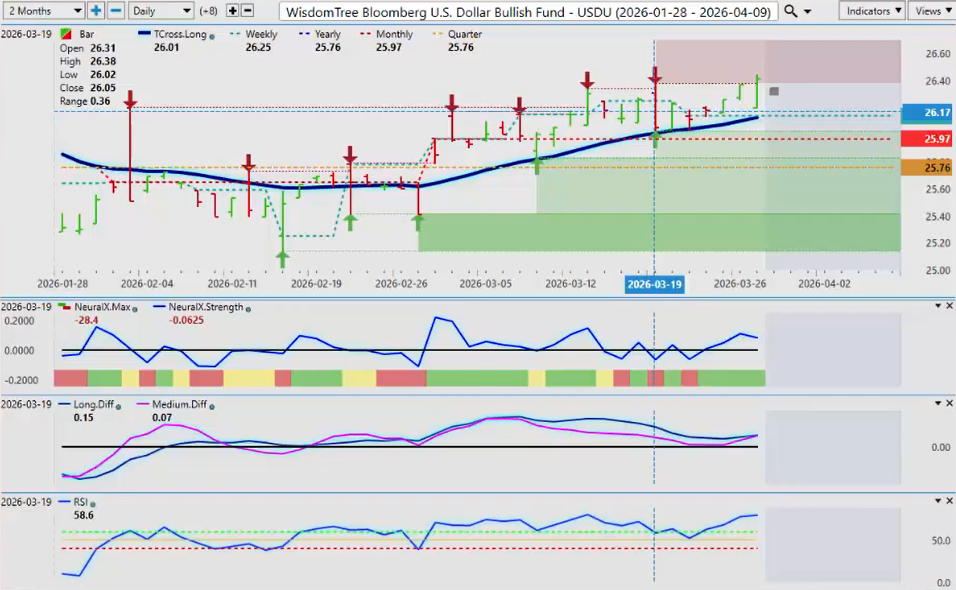
Now, to get started this week, we’ll begin where we always do with that very important U.S. dollar, measuring it via the USDU ETF. Now, what I’ve done for this week is basically put on the TCROSS long by itself for very choppy, illiquid markets. Excuse me.
And we have to be very cautious, and we want to be able to identify what the primary trend is using this key predicted moving average. So again, when we look at this right now, the dollar has had a retracement back down to the TCROSS long, hit that level while still above the monthly and yearly opening price, and we’re turning higher.
Now, the VP indicators, we can see the predicted differences did not cross the zero line right here. So a crossover may have occurred with the medium-term, but the long-term remains positive.
Now, when we make an adjustment to the predicted RSI using a 60/40 split and then speeding it up a little bit to a 9 period, and we’re looking for momentum, we don’t have any momentum to the downside. We’ve hit the 50 level, and now we’re starting to rebound higher.
Now, what I can tell you is there is a monthly pattern with the dollar. This is a known period of U.S. dollar strength that usually concludes the week after the non-farm payroll number. Now, this coming Friday is that payroll number, and it will be very, very choppy as the market tries to determine what the Fed is going to do.
Is he going to hold? Well, previously to this week anyway, it’s just either been on hold or a cut. And now there’s market chatter of a hike. In my respectful opinion, there will be no hike. It will be a cut whether they like it or not.
So again, I believe the dollar’s strength will be short-lived based around that.
Gold
Now, with that potentially comes opportunity for us with Gold, with the Iran conflict, with the Fed potential recession pending.
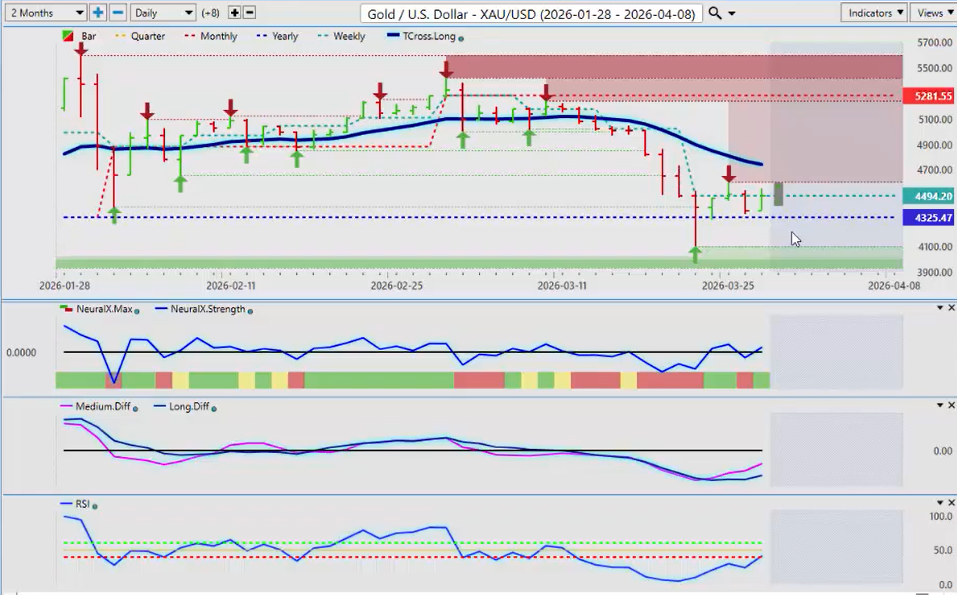
You can see that we’ve broken down below the TCROSS long on gold. We’ve tried to stay below the calendar yearly opening price, but this is the level you really want to keep your eye on, guys, 4325.
So again, you can see this week we’ve pushed down below it on Monday, but then immediately recovered, and we never closed below the calendar yearly opening price.
Now, this is different than a 52-week lookback. We’re measuring the yearly opening price from that first trading day in January and determining whether something is actually bullish or bearish.
So gold actually remains bullish while above that 4325 area. Our retracement point will be the T cross long, 4743.
Once we clear that level, then we can start moving higher. But remember, we are starting a new quarter next week on April the 1st, and gold usually fares pretty well during Q2.
S&P 500 SPDR $SPY ETF
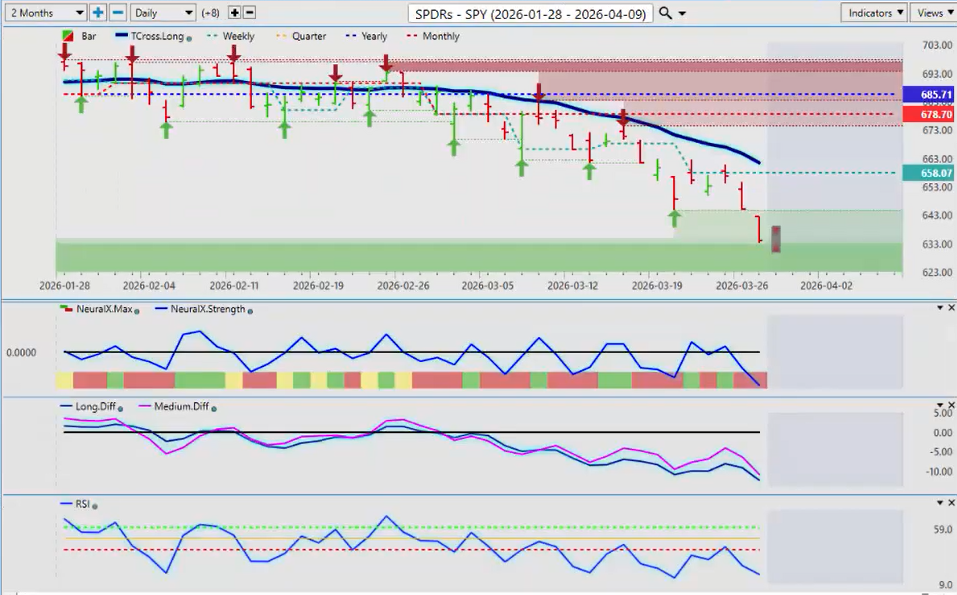
Now, the equity markets again remain very, very much under pressure, all of them except for maybe the Footsie 100, and the Russell hasn’t done horrible, but the S&P 500 continues to push lower.
We’re firmly below the yearly opening price, but in my respectful opinion, only the further we move away from that yearly opening price, the more likely it is we’re going to have some kind of retracement to it.
So the immediate retracement area with that TCROSS long, because again, you can see that we broke down below the T cross long and the yearly opening price. We had multiple retracements back to that same level. We couldn’t get above it, and the bulls threw in the towel, and down we go.
So again, things can change relatively quickly. If there’s any kind of change with the Iran U.S.-Israeli war, then that could turn things around quickly.
But right now, our retracement point is that T cross long at 66148.
No, we don’t really have any indicators right now in VP that suggest that that’s going to happen right out of the gate. But that payroll number on Friday, if it’s another weak number and the Fed’s going to have to cut, which I believe will be the outcome, that could be what turns the equity markets around.
So keep a very close eye on Friday’s non-farm payroll number.
Russell 2000 – $IWN
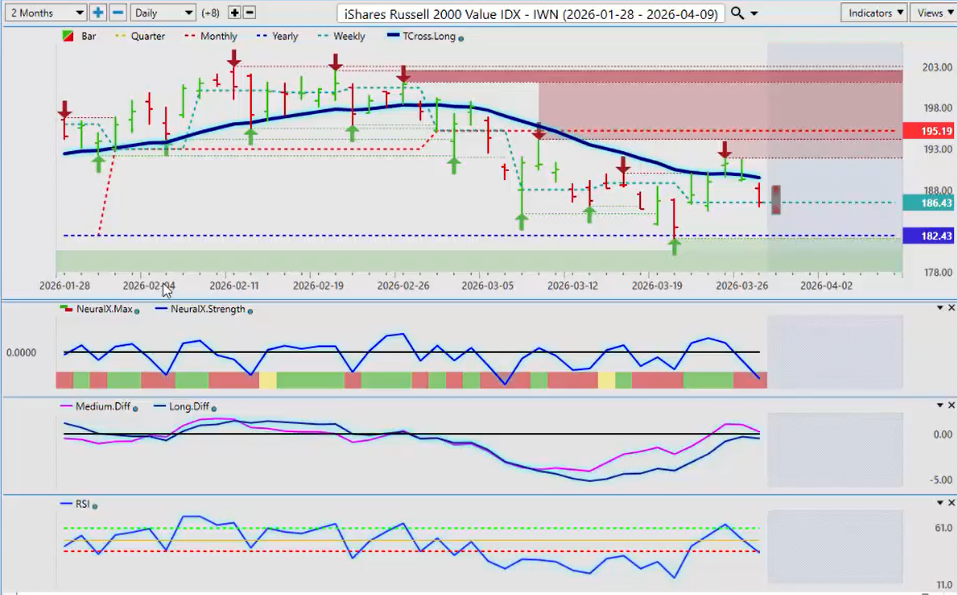
Now, the Russell 2000 value of the index, now this one is holding up very well compared to all the other global indices, again, other than maybe the Footsie.
And the Russell futures did break down below the yearly opening price, but once again, the ETF paints a different picture.
We’ve hit that yearly opening price to the number that’s coming in at or about 18243, and now we’ve pushed back up to the T cross long.
But again, we have to stay above that critical pivot area at 18189.44 if we want to keep buying this, because again, that yearly opening price is very close by.
And if the other global indices, which I suspect April will not be a good month for the global indices, then this is a retracement, and it’s getting ready to move lower again.
The VP indicators are indirectly suggesting that that is what’s going to happen.
Now, with the predicted RSI, a 60/40 split, we don’t want to be using any tools that are based around overbought or oversold. We want to look for momentum.
So this is telling me that we do have momentum building to the downside on this IWN.
So again, I think for now, shorts are slightly favored, but if we can hold above that yearly opening price, we can extend higher.
DAX
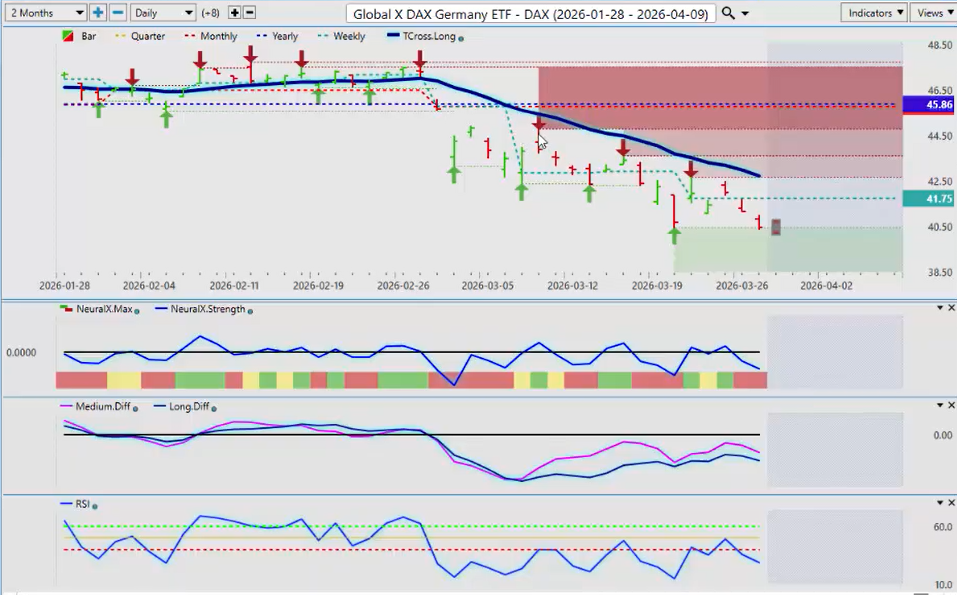
Now, for my good friends in Germany with the global XDAX, again following the euro lower, following the S&P 500 lower, all the main indices.
So again, April, May, June are usually better months for the euro, which means it could be a better month for the DAX.
So right now, indicators are still very much bearish, but again, that retracement level is going to be 4270.
So if we start to get a bit of a move, we do have a verified zone low sitting at 4044.
Now, if we can get back up and stay above 4044, that could be the warning sign of the retracement we’re looking for, but I don’t think that’s going to be until after the non-farm payroll number.
VIX
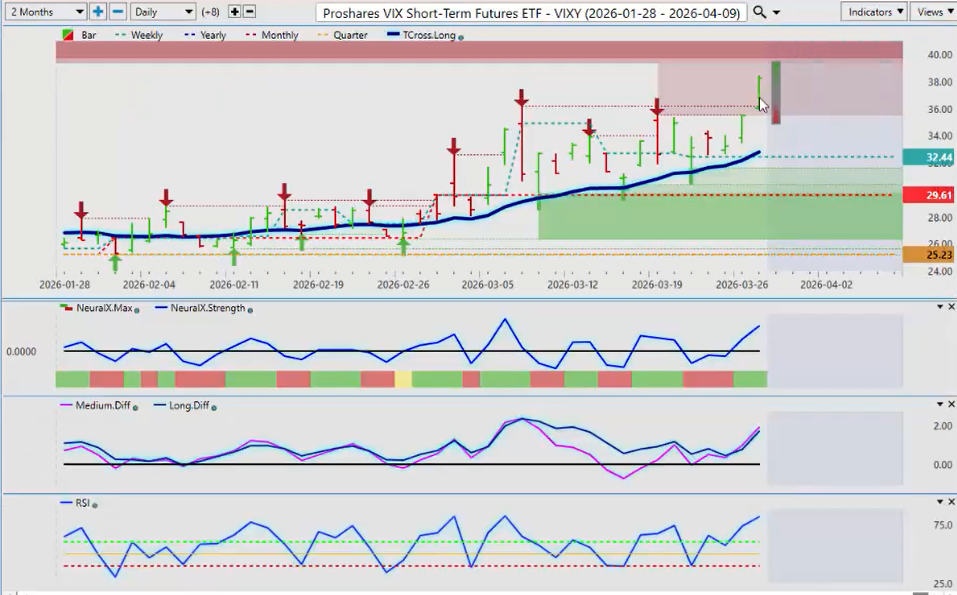
Now, doing a quick view or measurement of the VIX, the VIX continues to extend higher.
Monday’s predicted high and predicted low bar for the VIX, once again, just like last week, this is a very, very large bar for a daily trading range.
Now, that doesn’t mean that that’s what it will do, but the higher probability is that something will happen over the weekend again.
But the one thing I will always point out is that the current U.S. president does not want to see oil prices continuing to go higher, and he also does not want to see those equity markets or any stocks in general moving lower.
So I believe he will say something either over the weekend or at the start of the week to prop the stock market back up.
So again, I think selling the VIX under normal circumstances would be reasonable, but be very cautious.
And the high for Monday to start the week is going to be 3944.
Bitcoin
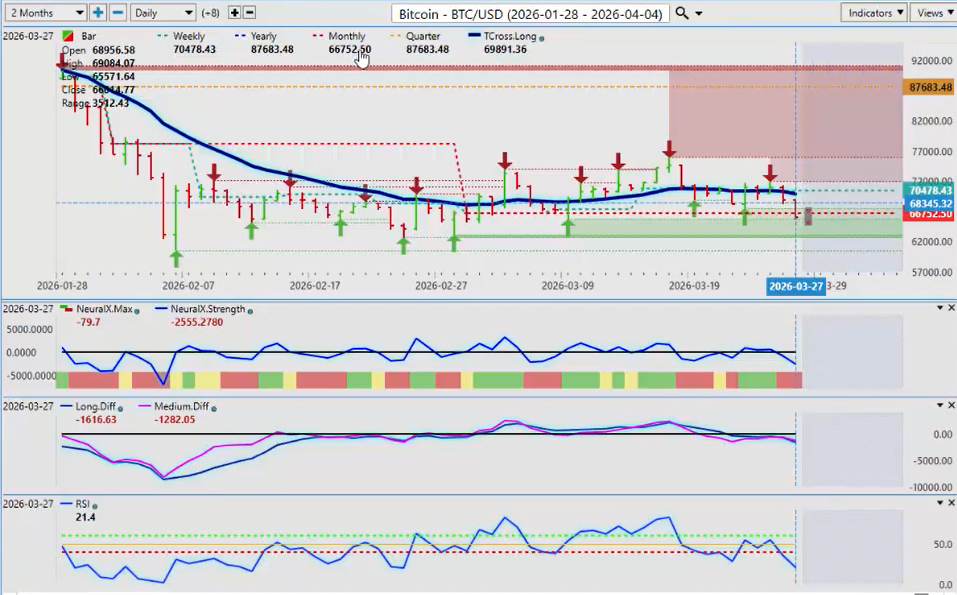
Now, Bitcoin has actually had a very good month.
I’ve talked about this one throughout the month of March, saying that there is buying pressure in the month of March. That was the prediction, but it doesn’t suggest that it’s going to close positive on the month.
So we have slipped below that very important monthly opening price, 66,752.
That is the critical level.
I do not anticipate Bitcoin will have a very good April or May, but we are in a cycle period, three years up, one year down.
So last year was the third year of a three-year rally. This would be a down year either way.
But respectfully, I think that longs are heavily favored the closer we get to the end of the third quarter and more specifically the beginning of the fourth quarter in 2026.
The indicators in VP remain net bearish on Bitcoin going into the start of the week.
Oil – $USO
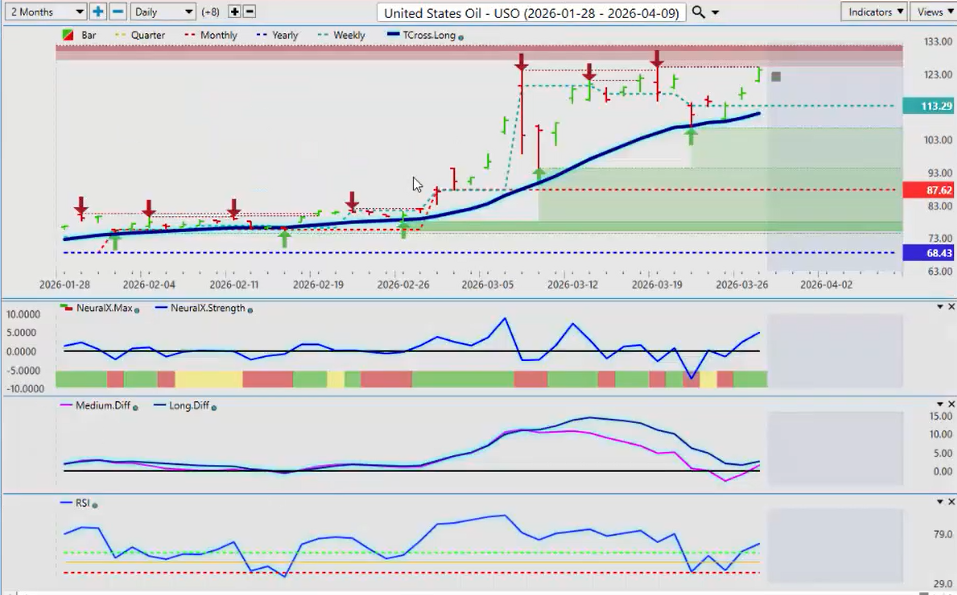
Now, the USO, once again, you can see looking at that single predicted moving average, we’ve been running in a channel here.
Then the Iran-U.S. conflict starts up, and oil explodes to the upside.
Now, what I can tell you based around a seasonal pattern is that oil is usually strong between April and June.
So even if we have a retracement here, oil is likely to remain firm.
But for now, we have finished the week right up near the verified resistance high.
But obviously, longs up here carry a lot of risk.
If this conflict goes away, oil is going to come down very, very quickly.
Euro versus U.S. Dollar ($EUR/USD)
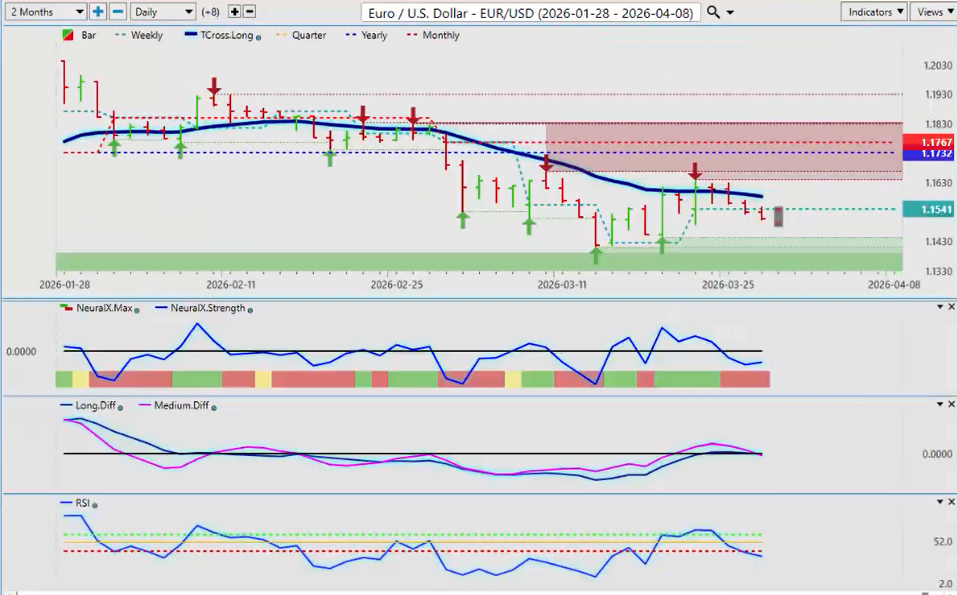
Now as we look at some of our main forex pairs this week all eyes are going to be on the EUR/USD. Once again structurally the euro is is turned bearish while crossing below over that yearly opening price.
We’ve had a retracement back up towards that level and the sellers stepped in again. So for now uh we’ve got our yearly opening price 11767.
I don’t think that’s at any risk uh before the month end but the tross long is 11582.
So again for the more savvy trader that doesn’t want to get involved with the with the daily chop you can put your buy stop just above 11582. And you can also uh put a sell stop right on the T cross long 11560.
Because again guys this is an outlook not a recap of something that’s already taken place. We’re looking at key levels going into next week’s trading on Saturday afternoon while the markets are closed.
I just want to point that out.
So again you can see that we’ve had multiple retracements into this area and failing each time.
U.S. Dollar versus Swiss Franc ($USD/CHF)
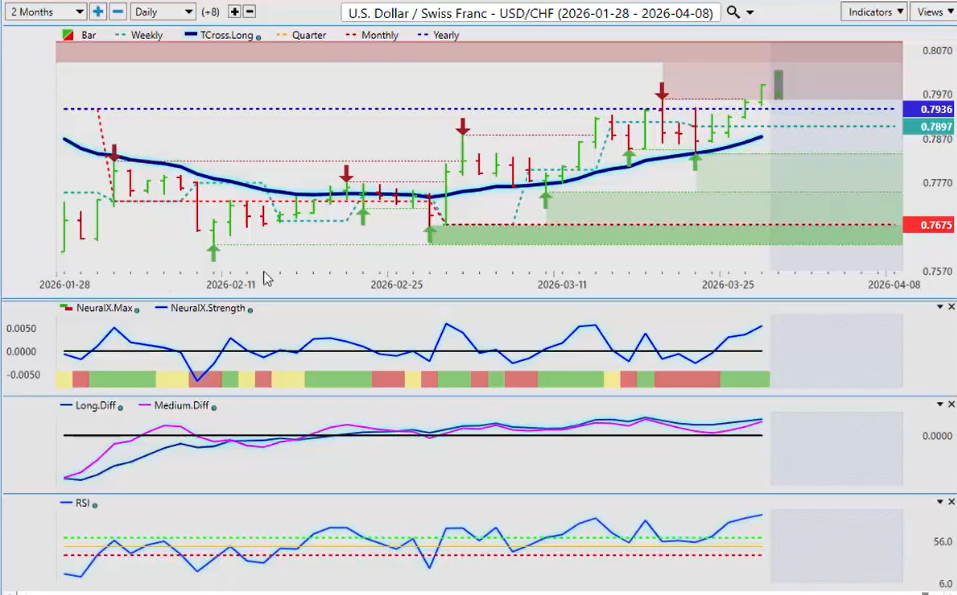
Now the USD/CHF again is very much a dollar index trade. So the this particular pair has finally closed two days above the yearly opening price.
My only issue that I take with this is the time of the month that it did it.
And in most cases again the dollar is only strong until about Tuesday or Wednesday after the non-farm payroll numbers.
So this one’s a pretty easy one to to look at guys for next week.
7936 that’s the calendar yearly opening price. We have to stay above that level.
If we can’t maintain closing above that level the primary dr downtrend is likely to resume.
And remember you’ve got the Swiss National Bank monkeying around in the markets trying to intervene to weaken their currency. And we all know how that worked out for them last time right?
So uh anytime a central bank intervenes in the currency markets or anything else it’s a disaster unmititigated disaster.
So keep that in mind. Yes it does look very bullish. The indicators in VP made a very nice call on this.
But the question remains now can we hold above 7936?
So again for the savvy trader you can straddle that yearly opening price a buy stop just above 7936 and a sell stop just below 7936 or below the tross long which is coming in at 7874.
So a sell limit order at 78 uh69 for example.
Then if it comes crashing back down then you would have a sell stop ready to go.
British Pound versus U.S. Dollar ($GBP/USD)
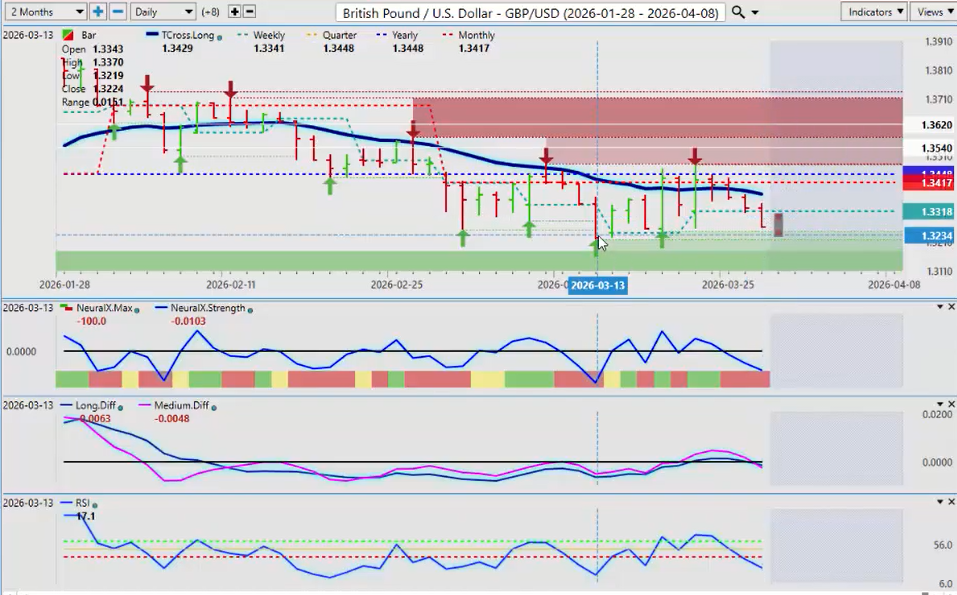
Now the GBP/USD once again I believe the pound dollar may be able to to recover a bit in April because there is a a warning sign of upside trading pressure on the Footsie 100 the UK index.
So again if that moves higher that could indirectly suggest that the pound may follow that.
So very good support down here that’s coming in at the lows 13219.
Watch this area very closely.
However we do have an MA diff cross that has just occurred below the zero line.
The predicted RSI is showing momentum is building to the downside.
But again respectfully I think maybe for a week or so and that’s about it.
And then the pound dollar could very much recover after uh April the 4th.
U.S. Dollar versus Japanese Yen ($USD/JPY)
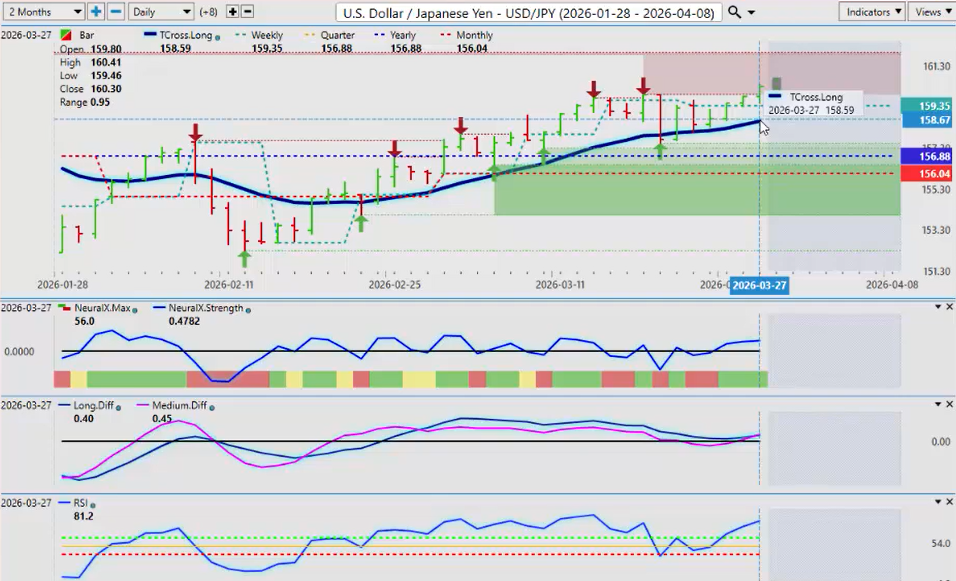
Now when we look at the USD/JPY too.
Now again the talk of interest rate hikes in the Fed this is utterly ridiculous in my respectful opinion to even suggest the Fed can hike rates here.
So again I believe the payroll number on Friday will confirm that the labor market is not strong.
And but again the Fed is trying to say that it’s a supply shock now.
They’re they they just keep change moving the goalpost.
They’re trying to invent ways to to keep the rates high.
So they may be successful we’ll see.
But for now the carry trade is back on meaning buy dollars sell yen.
But the yen would be weak right across the cross pairs too.
So for now uh our tross long is coming in at 15859 and 156.88 88 is the critical yearly opening price.
But uh in next week’s presentation I’ll be able to bring in the new quarterly opening price that we’ll have on April the 1st which is always uh a very very good tradable level.
Commodity Currencies
U.S. Dollar versus Canadian Dollar ($USD/CAD)
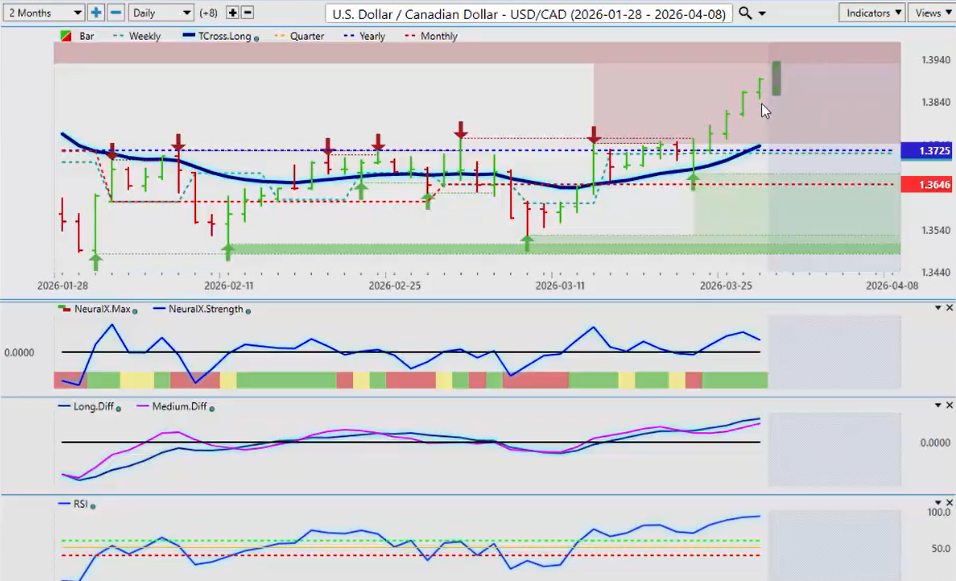
Now with our three main equity commodity slash commodity uh currencies the USD/CAD really taking the brunt of uh the dollar strength here and with good reason.
The Canadian economy doing very poorly under uh Governor Carnage.
Uh again it’s unless something changes with the tariffs and the you know getting a new deal signed then that’s likely going to keep pressure on the Canadian dollar.
However in most cases the Canadian dollar is stronger April midappril through mid June with higher oil prices.
Now we’ve already got very high oil prices but it’s not helping the Canadian dollar because the Bank of Canada again talking about uh cuts.
So for now uh be careful buying this high.
The further we move away from the VPT cross long at 13737 the less attractive a long trade actually is up here.
So once again we will see which way this uh goes.
But if those equity markets turn around then the Canadian dollar the Aussie the Kiwi there’ll be good opportunity there.
Australian Dollar versus U.S. Dollar ($AUD/USD)
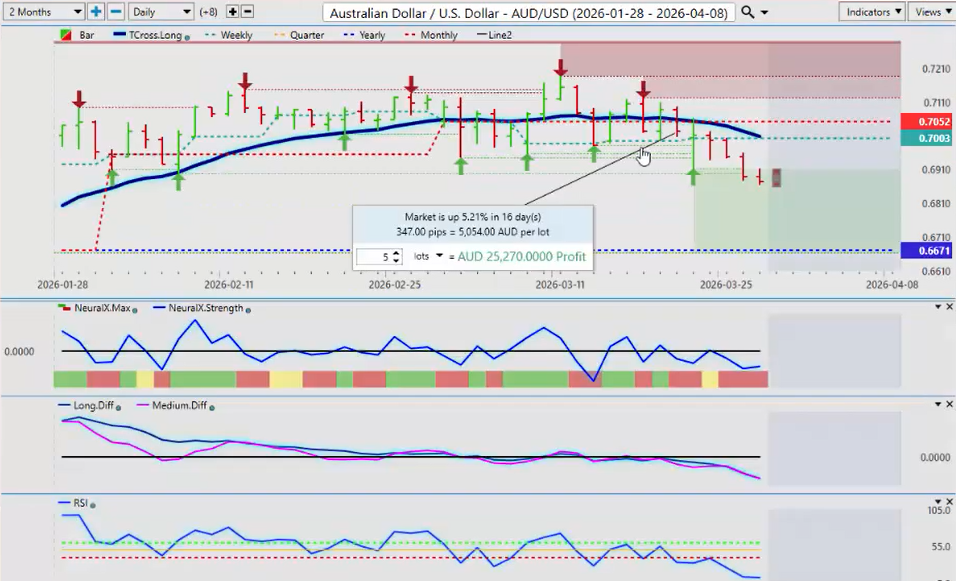
So with that said looking at the Aussie currency it remains net positive on the year which I will absolutely want to make sure I’m pointing that out here.
That 6671 the Aussie on the calendar year if we look at a measurement point even to after the selloff on f this past week the Aussie still remains up 3 percent on the year.
That’s actually a very strong move uh for a 3 month period.
And obviously it was considerably higher than that a few weeks ago.
So as long as we’re holding above 6671 buying the Aussie on the dip in my again is likely the better play once we get past the US payroll numbers on Friday.
But that retracement point that you’re looking for the T cross longs is going to come in at uh about 70 cents.
And ultimately later this year I can see us moving towards 75 80 cents on a longer term perspective.
But this is a weekly outlook just for one particular week.
And the indicators are definitely bearish.
But you can see the neural index strength is flattening out suggesting that we may be getting ready for a turn back to the upside and a retracement back to that allimportant Tcross long.
New Zealand Dollar versus U.S. Dollar ($NZD/USD)
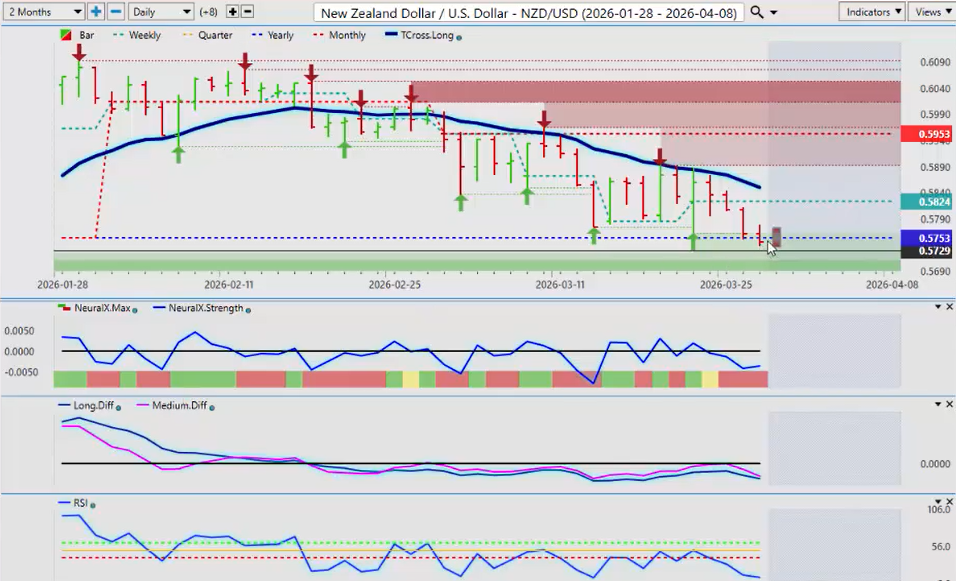
Kiwi is in a very similar boat uh under pressure again.
Now this is a good illustration of the power of using the predicted moving average with the calendar yearly opening.
So we came down and hit the uh yearly the yearly opening price went back up then hit the T cross long on March the 19th and then fell back down again.
So Friday we have closed below that very important level of 5753.
Now it’s just a question if can this can the market stay below that level.
Can the Kiwi remain weak.
Again in my respectful opinion any turnaround in the stock market oil prices moving lower this pair would turn like the Aussie would turn and the US CAD would turn very quickly.
So be mindful of that next week.
But even with all this volatility guys there will always be opportunity.
So with that said this is the Vantage Point AI market outlook for the week of March the 30th 2020.