Welcome to the Artificial Intelligence Outlook for Forex trading.
VIDEO TRANSCRIPT
VANTAGEPOINT AI MARKET OUTLOOK
Okay, hello everyone, and welcome back.
My name is Greg Firman, and this is the Vantage Point AI market outlook for the week of December the 22nd, 2025. Now, as we round into year end here, some pretty choppy trade this past week, but let’s go through it and we’ll look at, uh, some ETFs, we’ll look at some, uh, forex pairs, uh, and again some of our main commodities.
WisdomTree Dollar Bull Fund
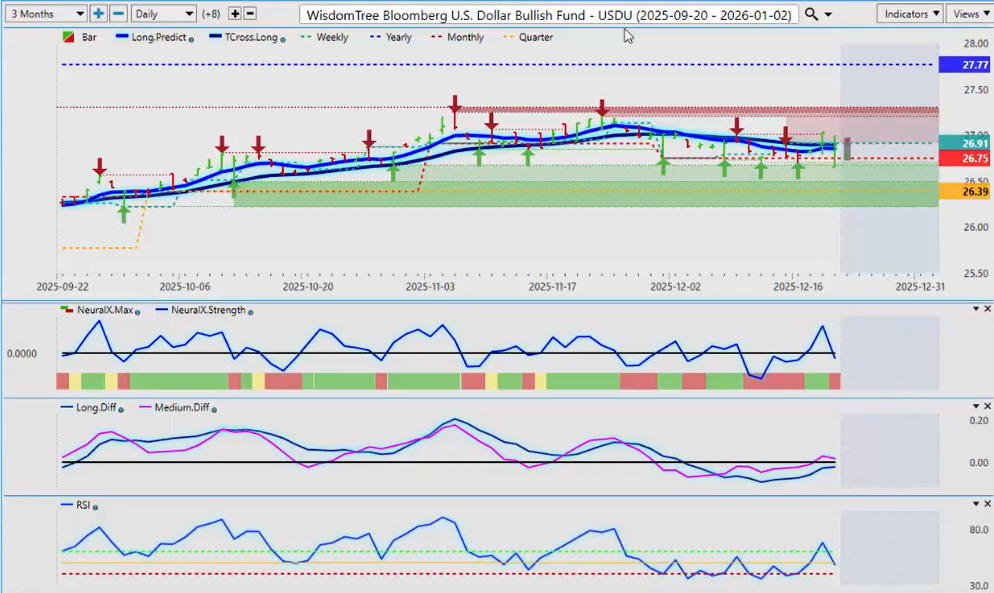
So, looking at the dollar index, uh, this particular WisdomTree Dollar Bull Fund—very, very well-balanced way to look at the strength and weakness of the US dollar. Now, right now, the dollar is definitely, uh, holding its ground here. Another strong CPI reading suggesting the Fed may not be cutting, uh, much going into 2026. So again, market has to digest that data, but for now, we do not have a lot of downward momentum.
Neural Index is pointing down, but we have a medium-term crossover to the upside, but a little bit concerning on the predicted RSI that we’re pointing straight down. But in most cases, the US dollar doesn’t do overly well, uh, into about mid January, and then it starts to turn around. Uh, but for now, there is still, uh, we’re still negative on the calendar year but re remain positive on the quarter.
So we’re holding above the monthly opening price at 2675 and the quarterly opening, very, very critical level for the dollar here at 2639. As long as we’re holding above that, the dollar should be okay.
SPDR S&P 500 ETF (SPY),
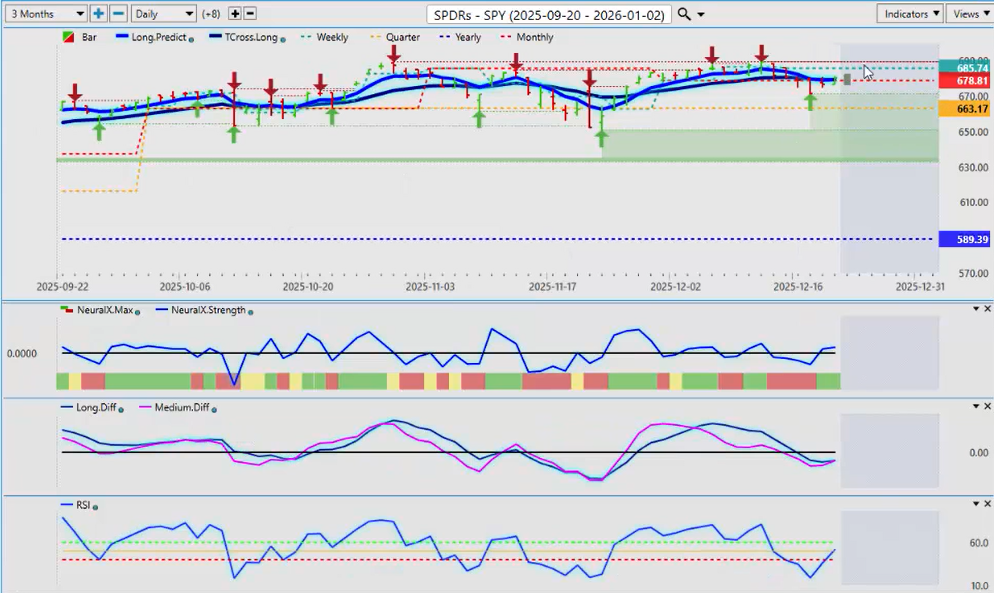
Now, when we look at some of our ETFs, starting with the SPDR S&P 500 ETF (SPY), well, the SPY had some very choppy price action this week, but another classic bare trap. Remember the primary trend here, guys. We’re above the yearly opening price. We’re above the quarterly opening price. Uh, a number of different announcements coming out about AI bubbles, etc. And, and again, they’re, they’re trying to push the market lower, but they’re just not successful at it.
So for now, the T cross long—this is your critical level—679. Very, very big level for the SPY. We need to hold above this, uh, but the primary trend clearly is up. Uh, but it is definitely toppy up here, but that doesn’t mean it can’t go higher.
So if we can get above our T cross long, that level will come in at 67941. That is the level you want to keep your eye on next week. If we can hold above it, longs into year end. If we can’t hold above it, then we could push lower. But either way, uh, as long as we remain above 66317, the current fourth quarter opening price, then we should be fine.
Invesco QQQ Trust ($QQQ)
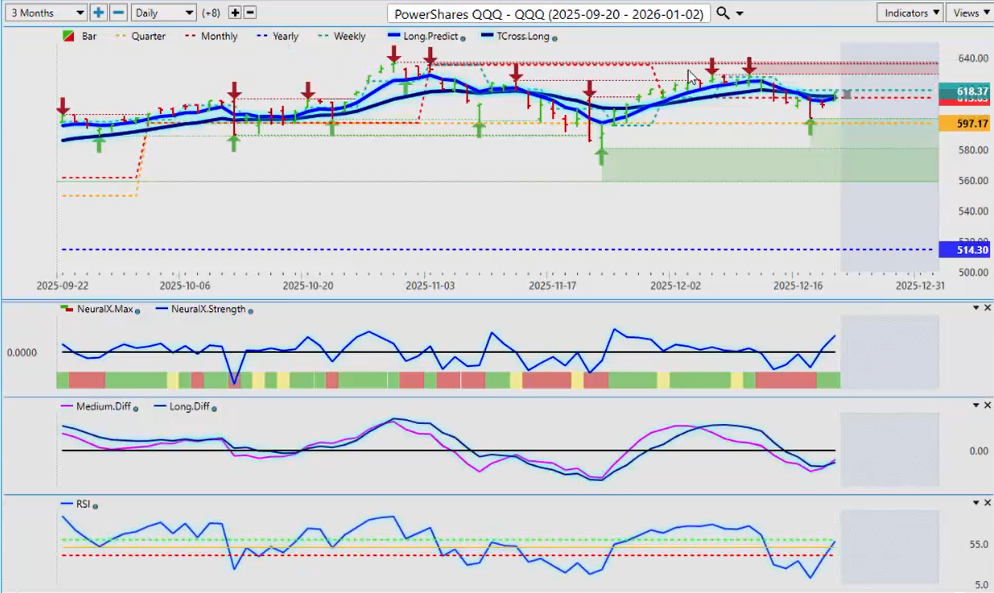
Now, if we look at some of the additional ETFs on the equity markets, the Invesco QQQ Trust (QQQ)—another reason why this quarterly opening price is so incredibly important. Uh, that level currently is at 59717. You can see that we came basically right down to that level, touched it, and completely reversed.
Uh, now a additional buy signal is starting to form with the MA diff cross, the pink line over the red. We’ve got a rising predicted RSI from oversold territory. So again, it looks like a decent week ahead for the stocks appears to be in the cards, but it’s going to be choppy.
Russell 2000 Index
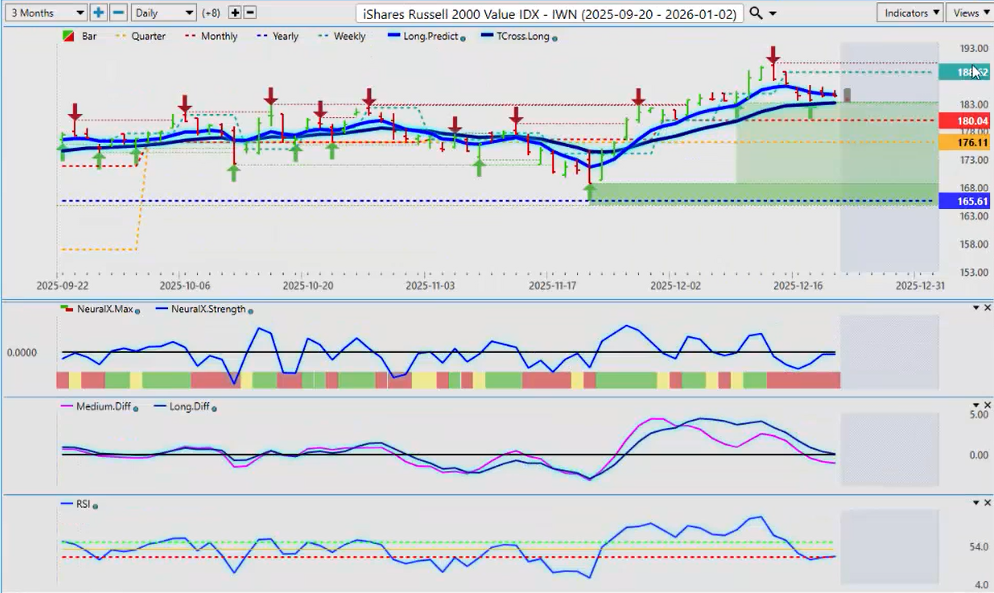
The Russell 2000 Index—I also want to have a look at this because we are at year end now. Now, the Russell 2000 structurally looks the best out of all of these groups, in my respectful opinion only. We’re holding above the TROS long. We’ve never broke down below it. The structural bias of this is fantastic. Monthly opening price at 180, quarterly at 176, and the yearly at 165.
So, longs remain in place. Uh, but again, this has been a corrective move lower, as you can see with the pink line crossing the zero line. A medium-term crossover occurred, but we’re still above that very important TCROSS long at 18393.
DAX
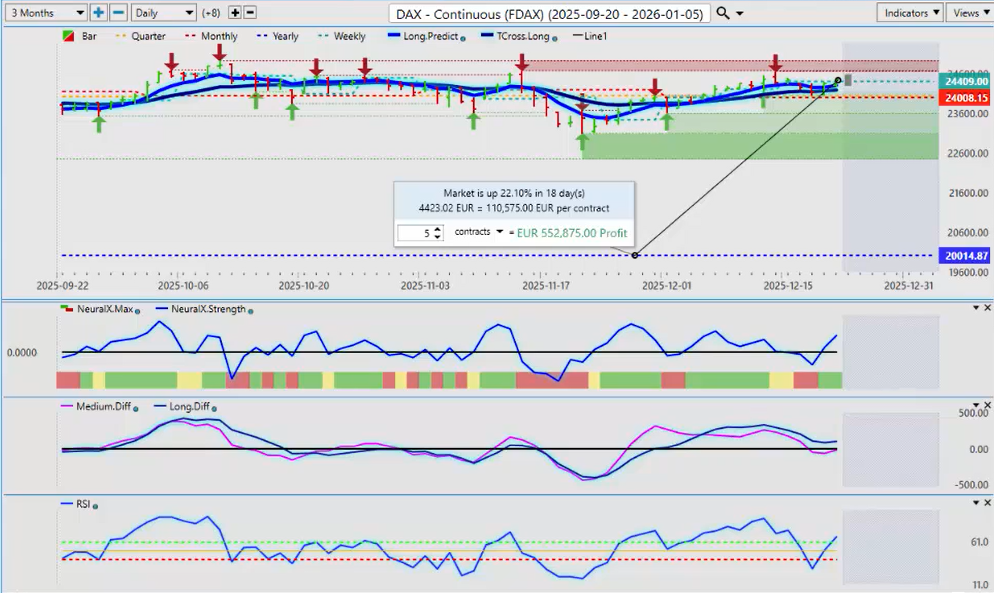
Now, quick look at the DAX here once again to dispel this myth that futures are more accurate than ETF. It’s just not factual, guys. I’m not using futures going forward on these outlooks. I’ve been given direction by Vantage Point, but either way, I agree with their position.
Now, as you can see on the DAX 30 futures, there is false signals to the downside. We’ve got a breakdown below, uh, medium-term crossover, a breakdown below the predicted RSI. Uh, excuse me, let me bring this chart back up here. This is on the, the global DAX first and foremost. Excuse me, I was on the wrong chart there.
22% is what we’re up when we look at the, the, the only—we’re not looking at 20 different ETFs. We’re looking at one, the Global X DAX ETF, right? And if you look at that, it’s grossly outperforming the, the, uh, the DAX futures.
But what I, what I really want to show you is the difference why the ETFs I feel have been better. So, when I look at the signal on the continuous contracts, we have a medium-term crossover. We’ve broken down on the predicted RSI. We pushed below the TORS long. All of that was a false signal.
So when we look at the DAX and the Global X DAX ETF, you can see that we never had a medium-term crossover. We never broke down below the 40 level or even the 50 level on the predicted RSI, and we held right on the TORS long.
So, in my respectful opinion, not only should we be looking at this, if you are trading the DAX futures, you should be looking at this ETF first because clearly it’s giving a much cleaner, far more accurate signal.
So, again, with this DAX ETF, this is the only one I’ll be using going forward. That TORS long is coming in at 4469. The, the monthly opening price or the quarterly opening price down here, uh, the monthly is at 4356. As long as we can continue to hold above this, the DAX looks pretty good.
But again, it’s very important to point out these, the differences between these two and see them side by side. And again, would you rather be up 35% on the year or 20% on the year? That, that’s up to the individ individual trader, but that’s being a little generous because I put that right to the top at 22%. But the, the DAX ETF, it just blown it away. So again, the, this is the one that I’ll be focusing on, uh, going forward.
Bitcoin
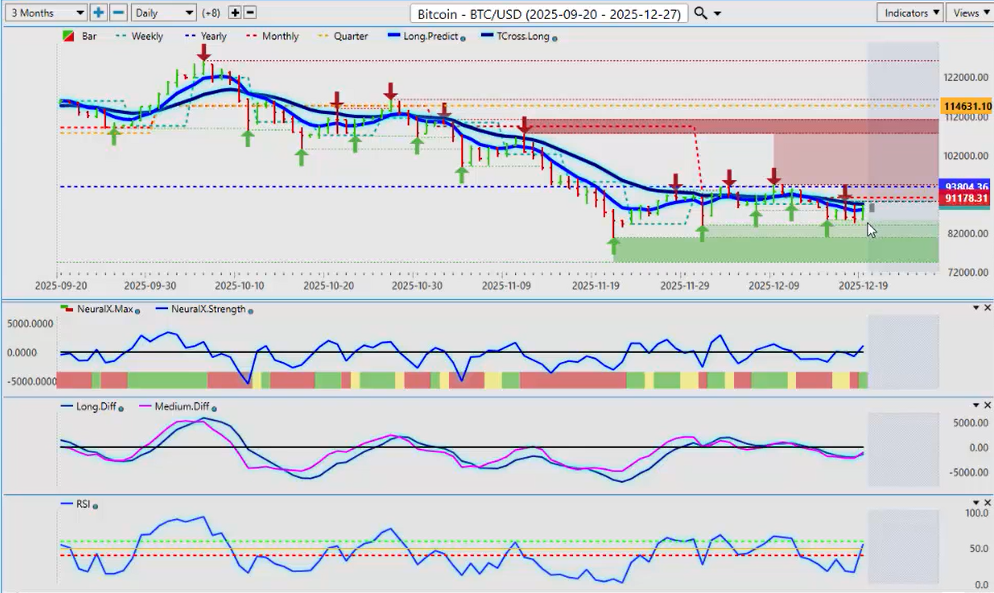
Now, when we look at Bitcoin going into next week, Bitcoin is, it’s holding its ground here, guys, but we’re below that calendar yearly opening price. I’m I’ll remain of the opinion that it there’s a strong possibility we will get finished positive on the year, but probably not by much. 93,804 is the calendar yearly opening price. And that’s the level we’ve got to keep an eye on here, guys.
Very, very critical that we’re watching that because Bitcoin is, is in the third year of a three-year rally. Historically, it would go down next year. But my concern here is the 40%, 35% down that I would be expecting next, next year. Are we in the middle of that right now?
Because when I look at this, uh, this paints maybe a different picture—that it’s possible that next year this was the sell-off we were looking for next year and Bitcoin can rebound.
So again, as you can see from the high, which is a all-time new high up here, we’re down 32, 32.70%.
So again, this is exactly what I would have expected next year. So, if Bitcoin can hold its ground down here and get back above that yearly opening price, maybe 2026 won’t be a sell-off. Uh, but for now, that is a key level.
The TROS long coming in at 89,466. That is what’s stopping us from moving higher. Once, if we can clear that, then potentially we can go higher. And the VP indicators are suggesting that that is going to happen next week.
So, we’ll see how this one plays out. But again, this is an outlook, guys, not a recap of something that’s already taken place.
Gold
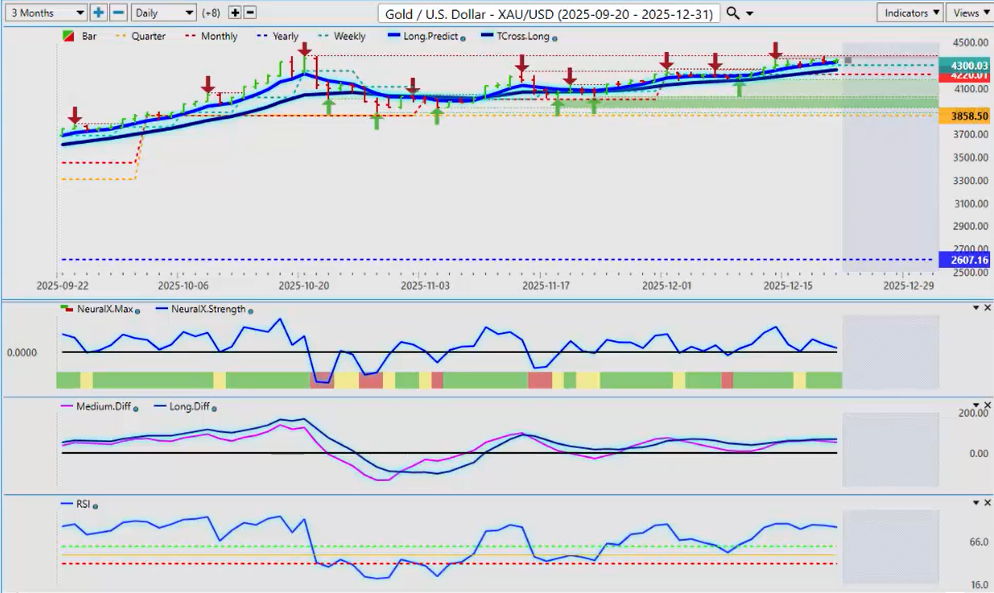
Now, looking at Gold, Gold usually finishes December strong in most years. Uh, so right now, we’re pushing higher. Gold and Silver continue to do well. Our tcross long for next week, 425960.
I anticipate that area will hold, but again, you’ve got your monthly opening price, your TROS long, and the long predicted moving average is all sitting right in that area.
Little bit concerning here that the MA diff is—the pink line is slipping below the, the, uh, the blue line—but again that CPI data was certainly was strong. Uh, I think the estimate was supposed to be 3.1 and it actually came out at 2.7, and the media—you noticed—very quietly just ignored that. Uh, but very, very interesting, uh, number.
So we’ll see how this one plays out. That could indirectly put a little bit of downward pressure on Gold. So, I do want to point that out—that that was a very— inflation is definitely coming down by the numbers, right?
So, if the Fed’s looking at that, he could say, “No, I’m not cutting.” And if he doesn’t, that could hurt Gold. So, we’ll see how it plays out. But the main thing is, guys, know your levels. Okay.
US Oil
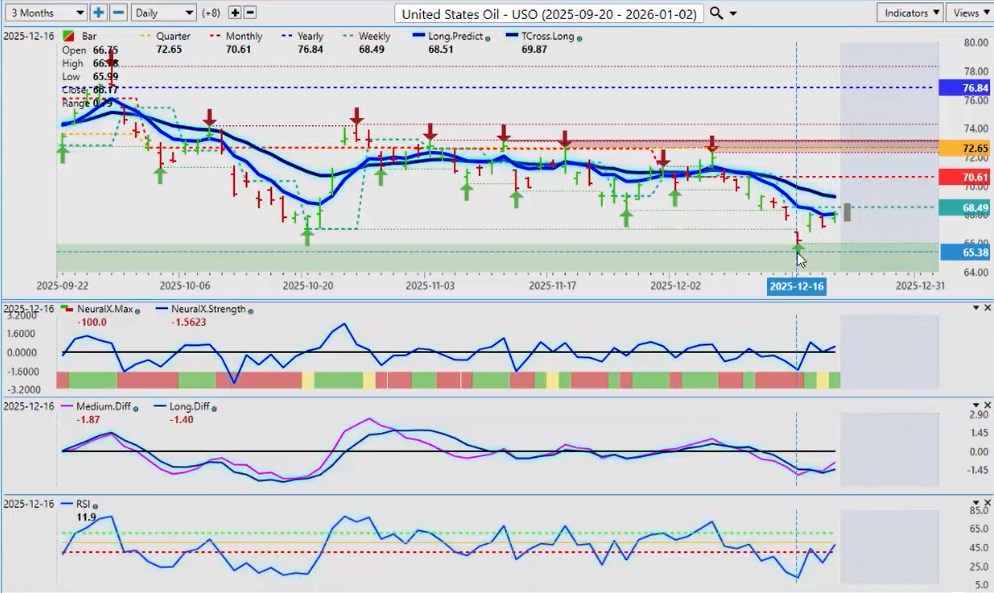
When I look at the, uh, US Oil, Oil is starting to make a rebound here. And once again, our MA diff cross is moving to the upside. Predicted predicted RSI is rising. And when I look at the Neural Index, uh, the short-term signal, everything looks pretty good here.
So, we’ve got a—what I think could be a bottom in place down at the low 6599. And at the very minimum, I anticipate we will retest this TORS long at 69.24.
But either way, guys, we know that Oil starts to move back up as we get into February, March, and April. So, a little maybe premature, but I, I’m not anticipating a lot of downside on Oil. Despite what Goldman Sachs, the media, some of these people are saying, uh, I think we’ll follow our historical seasonal patterns and stick with that.
Volatility Index ($VIX)

Now, again, looking at the, the VIX for this, uh, particular coming week, it would make sense that we do have a look at that to make sure that everything is still looking okay.
So, when I look at the VIX, I’m down below the calendar yearly opening price, 4421, quarterly opening, monthly opening prices. Now, I’ve got my Tcross long and my long predicted slipping below the quarterly and monthly opening. That’s a very bearish signal, guys. So it’s a lot more bearish than the average person would know.
So again, not a lot of buyers of the VIX. The key, the core Vantage Point indicators are all pointing down. So I think, uh, Santa Claus rally could be in play here. We’ll see. But it’s certainly well—Santa Claus rally is certainly well supported by the look of that particular VIX.
Now, what I’ll do is just do about three or four Forex pairs this week. It’s basically all the G7 pairs.
Euro versus U.S. Dollar
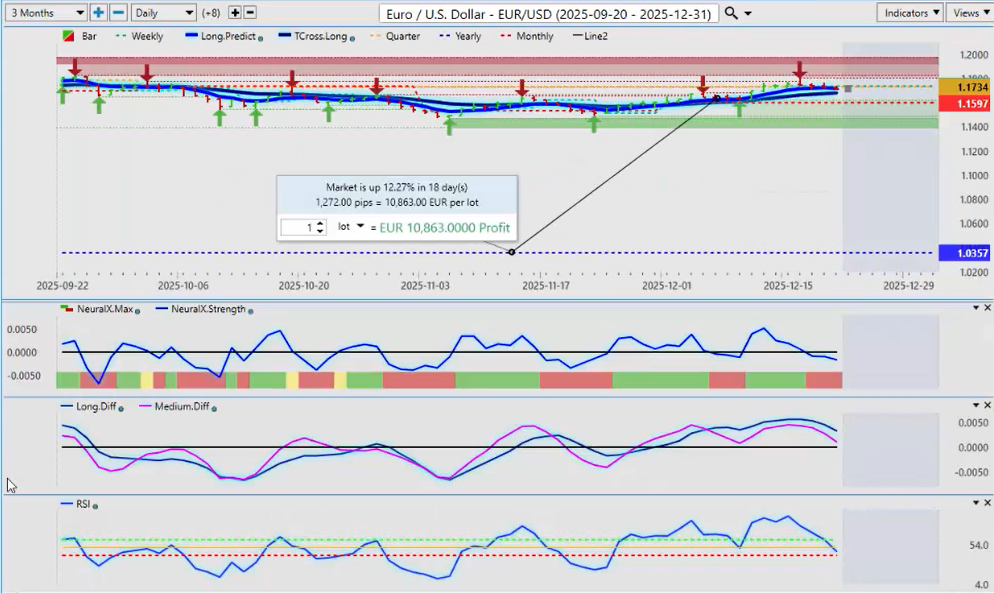
So, most eyes are going to be on the EUR/USD forex pairs pair. That is the number one traded forex pair. Highest volume in the market here. So, the euro continues to have a pretty good year. Uh, but the problem here, guys, is we’re just running out of buyers up here.
So, when we look at the price is just sitting here, uh, in my respectful opinion again only, there is likely going to be a push to either the upside or the downside. And with that stronger CPI data coming out, it suggests that we are running out of buyers up here and we are getting ready to move lower.
So, this is when we look at the core VP indicators. The Neural Index and the Neural Index strength are pointing down. Predicted differences have curled and they’re pointing down. Predicted RSI—if we break the 40 level, then the probability of breaking through the TORS long at 11678 remains very, very high.
So that is the key level that you want to keep your eye on. If we’re holding below 11678 next week, we’ve got to short, and that’s where we would short it from, or right around the quarterly open is a very good entry point too at 11734.
But my concern again is following historic patterns—the dollar usually doesn’t do that great into the end of December. But with the, the hotter CPI or the cooler CPI number, that may help the dollar here. Uh, there is signs of life, but those are the key levels to keep your eye on.
British Pound versus U.S. Dollar
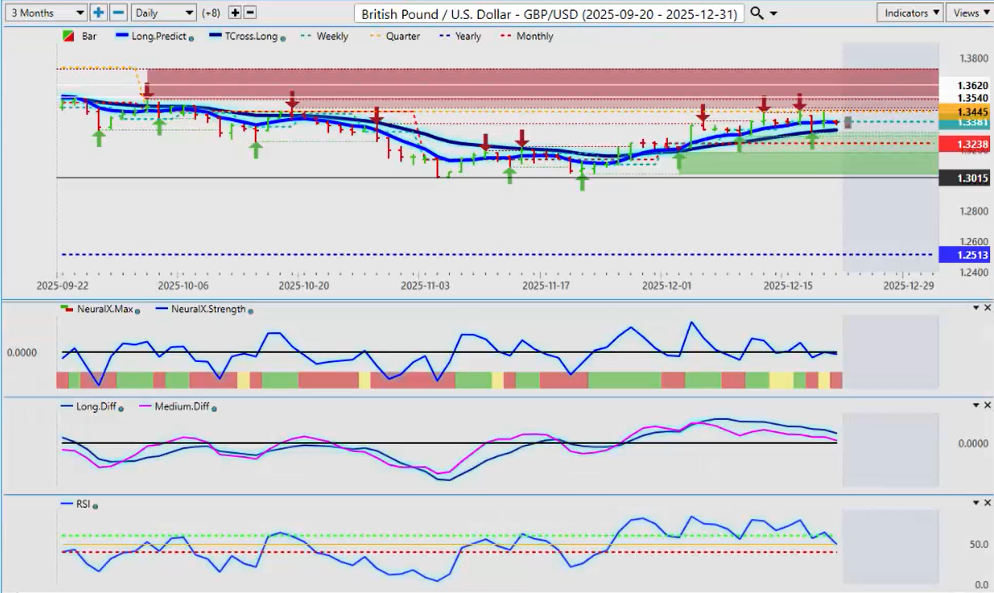
The other main pair—one of the most choppy of the G7—the most volatile G7 pair is the GBP/USD. Now, structurally it looks pretty solid too. 12513, the monthly opening price coming in at or about 13238.
So, the question—what is the only thing, guys—and I’ll zoom this in so everybody can see the importance of that quarterly opening price. You can see that that is exactly where it’s failing.
When we looked at the NASDAQ and the QQQ last week, they, they plummeted straight down and then basically touched the quarterly opening price like it hit a brick wall and completely reversed.
So, the GBP/USD, sadly, is doing the same thing. It’s not getting through here. So, for the right now, basically for the last several weeks, we’ve been trading between the monthly opening price and the quarterly opening price and failing on both sides of it.
So, it’s, uh, we did come down here pretty strong on, on Wednesday, and then we rebounded again.
So, right now, savvy trader could put a buy stop above the quarterly opening price, uh, say 134, 13450, and you could put a sell stop below 13238 because whichever side of this breaks, then you’re going to get a bigger move.
Uh, so again, looking at the VP indicators—this too another warning sign of potential dollar strength here that’s potentially coming. And even if the dollar is strong, that doesn’t necessarily mean automatically mean that the equity markets are going to sell off. They’ve been positively correlated multiple times this year.
So just something to think about there when we’re just assuming there’s an inverse correlation between equities and the dollar.
U.S. Dollar versus Japanese Yen
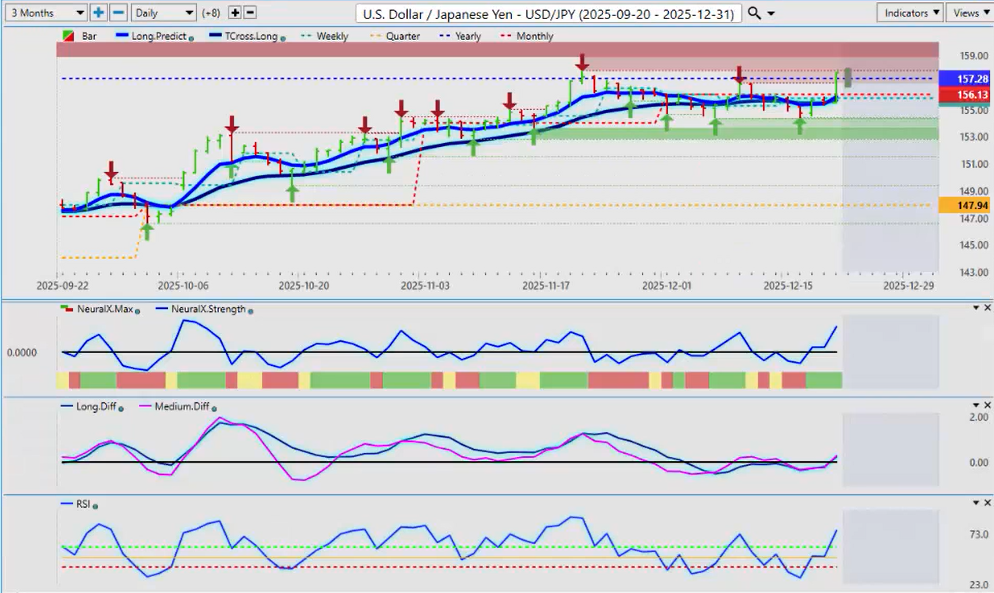
Now, with those two are your two main forex pairs, I believe a lot of eyes will also be on the, the USD/JPY pair.
Now, the USD/JPY—a lot of chatter with intervention, uh, rate cuts—but you can see on that CPI data that is a leading indicator, in my, in my view, of what the Fed is thinking. And you can see that the longs poured right back into this pair.
And that’s, this is the carry trade, the interest rate differential between the Bank of Japan and the Fed. It’s, I believe the market is of the opinion that this Fed will not be cutting and they’re going back into the carry trade.
Again, I cannot believe, in the amount of time I’ve been doing this, that this thing has gotten back over 157. Uh, this is a very, very weak Japanese yen.
So, I believe they’re going to try and intervene. Be careful with this pair, but I would did want to discuss it this week. I get a lot of emails on this one, but be very, very cautious of it, guys. Okay.
Australian Dollar versus U.S. Dollar
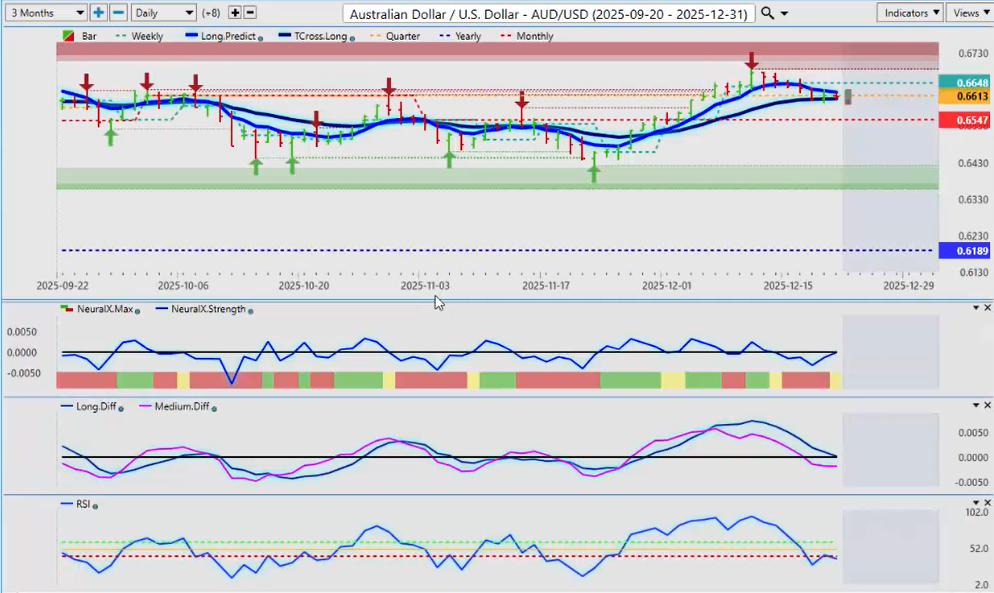
Now, the AUD/USD for next week. Again, these are some of the main forex pairs that I’m, I’m looking at here.
Uh, when I look at the Aussie, once again, we’re coming down. The MA diff cross was absolutely spot on over here, warning us that a top is in place soon.
But when this crossover here takes place, we are not below the T cross long. In your Vantage Point software, you absolutely need to have this setup in there, cuz the T cross long—that number on the Aussie is 6604. That is the line in the sand.
We’ve got to break down below that level. And you can see we’ve paused on there three days in a row. That’s not a coincidence, guys. That’s machine learning.
So again, watch this level very, very closely going into next week’s, uh, trading to see where we are on Tuesday morning. Are we back up above the T cross long, or are we below it? And that will set probably the stage for the, for the move for the remainder of the calendar year.
U.S. Dollar versus Canadian Dollar
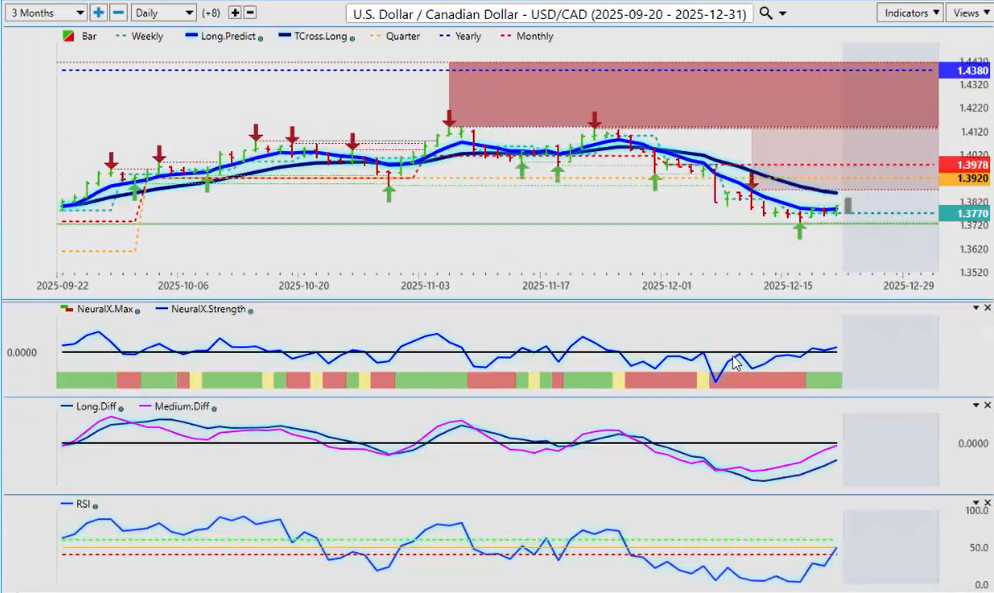
Now, I do get a lot of questions and emails on USD/CAD.
Now, USD/CAD here, uh, with a, with a pretty good rebound in equities and in Oil, it really didn’t help the Canadian dollar much. So, I believe we probably got a short-term, uh, bottom in place here, 13731.
So, keep an eye on that area, that low right there. And if we can hold above that, uh, I believe we’re coming back up to our TROS long.
Still no, uh, tariffs are still fully in place against Canada. There’s no trade deal between Canada and the US. So, excuse me, so very little reason to be buying Canadian dollars other than there is usually some Canadian dollar strength at this time of year because it’s Canada’s fiscal year end.
So, there’s a bit of repatriation of Canadian dollars. It was actually the Canadian dollar was, was, uh, pretty strong last year at this time too.
And another way you can always check that in your software—just going back one year ago—and you can see that USD/CAD was just basically chopping sideways and then ultimately it started going higher up into, uh, February.
So again, um, will be another interesting week, but with that, there will always be ways to profit from these markets.
So, with that said, this is the Vantage Point AI market outlook for the week of December the 22nd, 2025.