


Vantagepoint AI Market Outlook for April 12, 2021
VIDEO TRANSCRIPT
U.S. Dollar Index
Hello everyone and welcome back. My name is Greg Firman, and this is the Vantage Point AI Market Outlook for the week of April the 12th, 2021. Now to get started this week, we’re going to begin with that very important US dollar index. Now in last week’s weekly outlook, we talked about the dollar index and the cycles in the dollar index. What I had stated very clearly is that there are cycles in the US dollar with institutional buying and selling, or mainly institutional buying around the end of the month into the first week of the new month. So what I had stated is the pattern that I have particularly noticed using the Vantage Point software, and more specifically with the MA Diff cross, that usually I get a warning sign that the dollar is going to sell off. And that signal usually comes right after the nonfarm payroll.
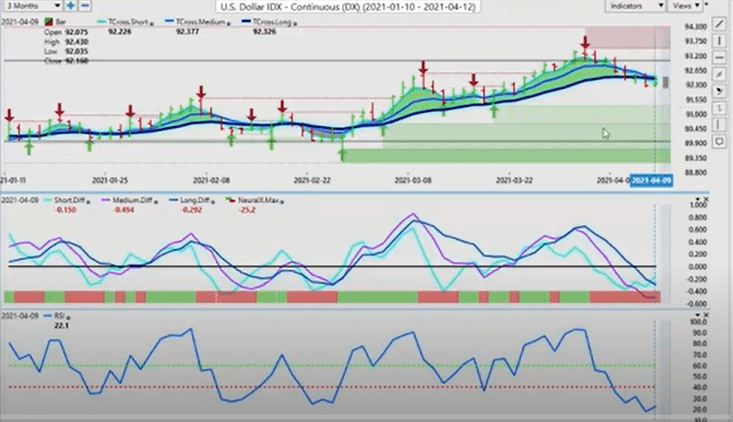
So in last week’s weekly outlook, I stated very clearly that the dollar is likely to move lower. Now we can see the opening of Monday’s bar. We moved just a hair to the upside and the entire week was down. So when we look at this, the number one currency pair that’s going to be effected by a cycle like this is the Euro US pair because the Euro makes up the bulk of the dollar index. So the dollar is continuing to move lower, but in my respectful opinion, the dollar still remains bullish while above the yearly opening price. I’ve discussed equity curves in last week’s weekly outlook. And what a real equity curve actually looks like where we see these cycles, where it goes up, it goes down, but we can actually pinpoint the time when that actually happens, using a very, very powerful tool like the MA Diff cross.
We can see that it tells us when to get in, when to get out, when the cycle is going to turn. Now, no indicator is perfect. I would put the indicator at about 80% accurate. That’s what I’ve seen over the 21 years that I’ve been using this particular program. So when I identify this, we’ve got our key support level, the TCross long. Now this is where most traders get confused. Because the dollar is moving lower, they think that it’s a new trend. There is no new trend in the dollar here guys, until such time as we break down below 89, 90. Now the software tells us the dollar is going to go lower, but as we can see that same thing that had us go short… I don’t think we’re going to see dollar longs for a week or two yet. Because again, if we follow those institutional money flows, they’re usually buying in at the beginning of the month or at the end of the month into the first week of the new month.
So this pink line or purple line whatever, depending what your eyes see, my eyes kind of a purple line. But when that starts to turn back up, it warns us that the dollar may be weak, but the trend has not changed. So the dollar could turn back around. But right now we would be looking for that, MA Diff to cross back over the longterm predicted difference to tell us that the dollar is starting to strengthen again. So once again, we’re in a corrective phase lower until we get closer to the fourth week of the month. The predicted RSI, it’s in heavily oversold territory, but that certainly does not mean the dollar can’t go lower. We would look at those institutional flows. Now again, if we click on our F eight here, we can see that every single day after we broke down below here, the market kept coming right back up to the long predicted. Hitting it, unable to break through it. That represents an excellent buy opportunity on Euro, US or a sell opportunity on the dollar index on a daily basis.
Now again, when we identify this level 92.33, if we can hold above that 92.33 next week, then the dollar will regain its footing. But I think that that’s unlikely at this particular time. Now, if we cross-reference this, to confirm that the dollar is still relatively strong, even though it’s in a corrective move lower. Gold remains unable to break above the levels that I’ve discussed over the last… What seems like the last month and a half here doesn’t it? When we look at this, going back to the early part of March, we’ve had this corrective move back up, but as you can see, the market is getting all tangled up in the Vantage Point, verified resistance zone, but we’ve got verified support down here also.
Gold
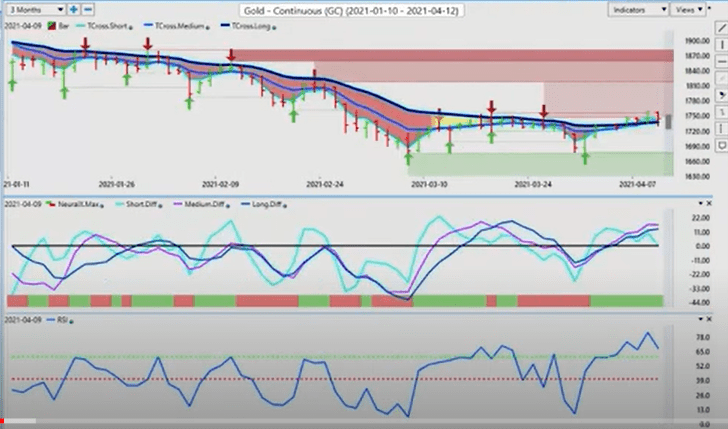
Just going back and forth in this channel, but very little interest in buying gold at this particular time. Myself, I’m predominantly now focusing on Bitcoin. And just on a side note, if it wasn’t for Bitcoin here guys, I would be a buyer of gold. But real money does not appear to be too interested in gold contracts. They are far more interested in Bitcoin. So again, like I’ve said in the Vantage Point live room, if you are a gold buyer and you want to buy gold, I would recommend having buy limit orders, at least at 1762. We would have to clear this level completely to confirm that we’re actually going to correct higher back towards the 1817 mark. But just remember the yearly opening price on gold remains at 1904. We’re down about nine, 10% on the year, still very little buyers.
But if we break down below the TCross long at 1737, then once again, that will confirm a bearish bias and we will continue lower. Now again, the purpose of identifying these levels is because this is a weekly outlook. It’s not a one day outlook where I’m giving trade signals for one day. This is a weekly outlook guys. It’s not a recap of something that’s already happened. We’re looking, going forward and identifying critical levels using the Vantage Point software. Our predicted differences are moving sideways, but our neural index is still green. We’re lacking again momentum, using the RSI solely as a momentum based indicator, it’s telling us we don’t have a lot of momentum up here. So shorts still carry the edge for now.
S&P 500 Index
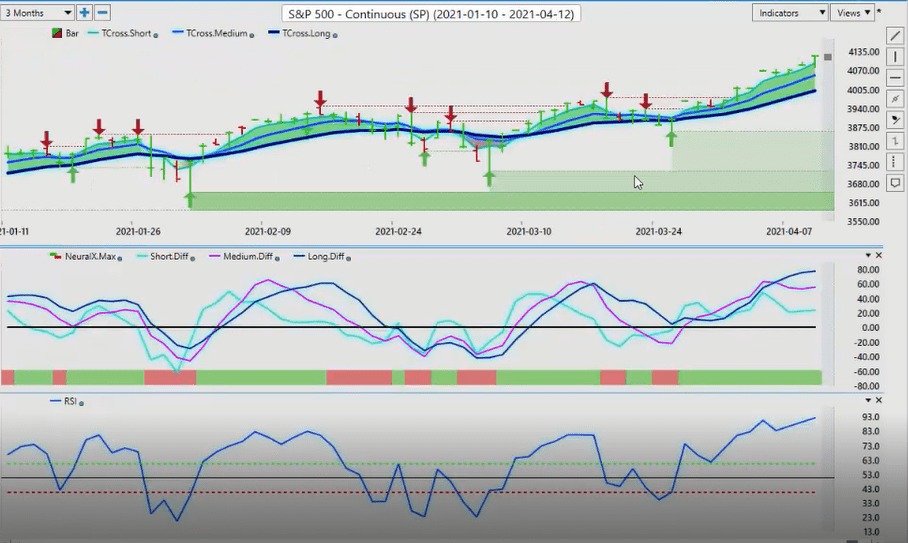
Now when we look at the S&P 500 continues to advance quite amazing actually, but we do have an MA Diff cross here. Now this could be one of the rare cases where the MA Diff cross is going to struggle because you have a lot of institutional interest in getting into this. Now, I also like to use, in the Vantage Point software, I do prefer to use the cash price to check that also. So I’m going to double-check the cash price, and you can see the same signal here. But again, we are grossly overbought at 92.1. It doesn’t mean it can’t go higher here. And this is what most traders using that old technology of overbought oversold, very seldomly is it accurate. In often cases, you’re simply fighting the market. So right now, what we do is we can see that we’ve got 4,004 at the TCross long. If we click on our F eight, this is the key level we want to watch here. And that level is at 4075.
Now, as long as we’re holding above 4075, we’re going to maintain that bullish tone. But I would anticipate a retest of that level very early in the week.
Bitcoin
Now, as we come down to again, one of my personal favorites over the last several years, is of course, Bitcoin versus the US dollar. We’ve still got good buying here. We’re still holding up in the upper 50,000 mark, almost the 60,000 mark. We’re consolidating these gains. But as you can see, the medium-term predicted difference is starting to turn back up. We’ve got our rising RSI, and we’ve been able to close the week above the TCross long at 57240. That’s the level you want to keep your eye on. Now, if I also click on the predicted moving average, one of my favorite strategies, you can use the medium-term predicted moving average by itself, the short, you’re free to use whatever you want here guys, right?
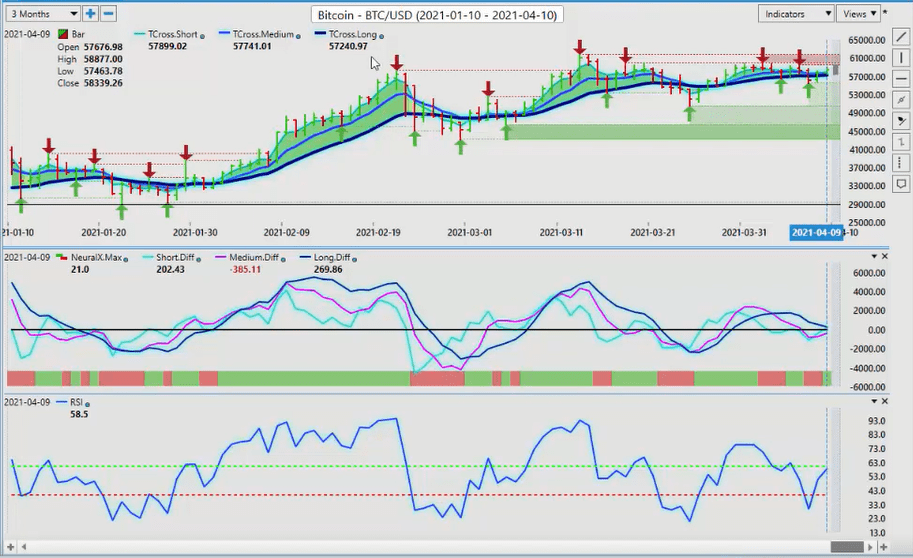
I’m just simply pointing out that I like to weed out a lot of noise. So if I’m using this blue line as a pivot level, that level is 57767. That’s the key level, I want to see the market hold above that. As long as we’re holding above that, Bitcoin and anything related to Bitcoin is going to go higher. Bitcoin stocks, Bitcoin ETFs like GBTC. I remember back in the old days, a year or two ago when we were buying GBTC, Bitcoin investment trust in the Vantage Point live training room, we were discussing that as an alternative to going into the very, very volatile Bitcoin contracts, futures contracts. And instead, we looked at this one. Now this particular… And this is an ETF, going back two years ago, you can see this call from Vantage Point. I always go back and use this as a reference point because we were actually buying this at just over $6 a share. We’ve hit almost $60 a share.
Now, just remember this tracks Bitcoin versus the US dollar. So we always want to make sure that we understand that. As long as Bitcoin versus the US dollar’s going up GBTC, hive techno, any type of stock or blockchain related will also likely be going up. That’s the basis of advanced inner market technical analysis.
Crude Oil
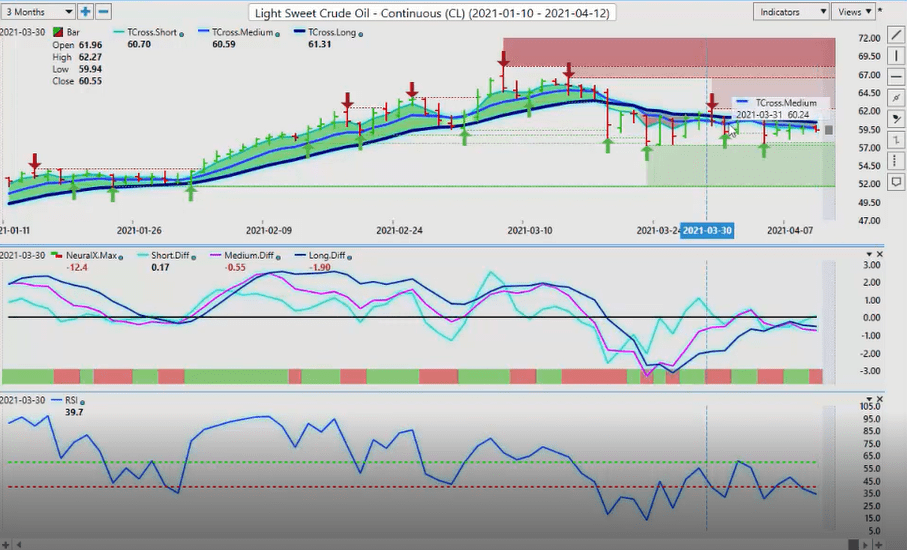
Now again, as we look at oil going into next week, oil struggling here. And again, after the triple EMA cross, we’ve had multiple retracements here. But it just can’t seem to get going above this level. Now I wouldn’t anticipate oil to go higher, but more towards the end of May, beginning of June. So we’re probably just going to consolidate along this verified support low at 57.25, waiting for the next move higher. But again, as you can see, we’ve got our medium term crossing our longterm predicted difference. And it’s saying it’s not really the time to buy just yet.
Euro Versus U.S. Dollar
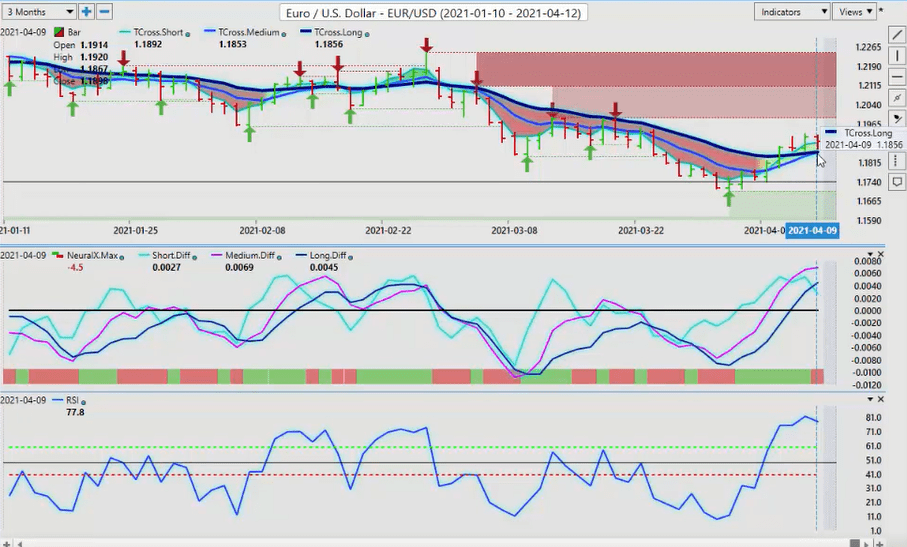
Now, as we go into our main Forex pairs for next week, again the Euro is feeding off what I had stated in last week’s weekly outlook. That institutional buying, drawing up after the non farm payroll number, which forces the dollar index lower at almost the exact same time every month, or very close within a day or two. So right now the Euro is likely to try and take another run at the 1.20 mark 1.1989, but we must hold above this level. Again, being an outlook, I’m pointing out key levels and how to use your software using pivot areas. Now the TCross long 1.1856, that’s the level we want to watch. The RSI is a little bit overbought, but again if we click on our F eight, we can see that once we cleared this level last Monday, then that was the signal to start buying this thing based around the dollar, that we anticipated the dollar index was going to fall based on those monthly cycles.
So for now, the long predicted and the TCross long is right around this 1.1850. So if you’re still a buyer of Euro, US that’s the area you would target on Monday and Tuesday. But if we slip back below those levels, then the dollar longs will be back on the table. Keep a very close eye on the MA Diff cross with the neural index.
British Pound Versus U.S. Dollar
Now the British pound, a little frustrating this past week, I anticipated a little bit more from it. And I did get a couple of emails asking me saying, “Hey, Greg, how come the pound, dollar didn’t go up with the Euro, US?” And that’s a great question that Dave sent in. And the answer to that is Euro, Great Britain. What’s happening here right now is Euro, US is going higher, which means Euro, Great Britain is going higher.
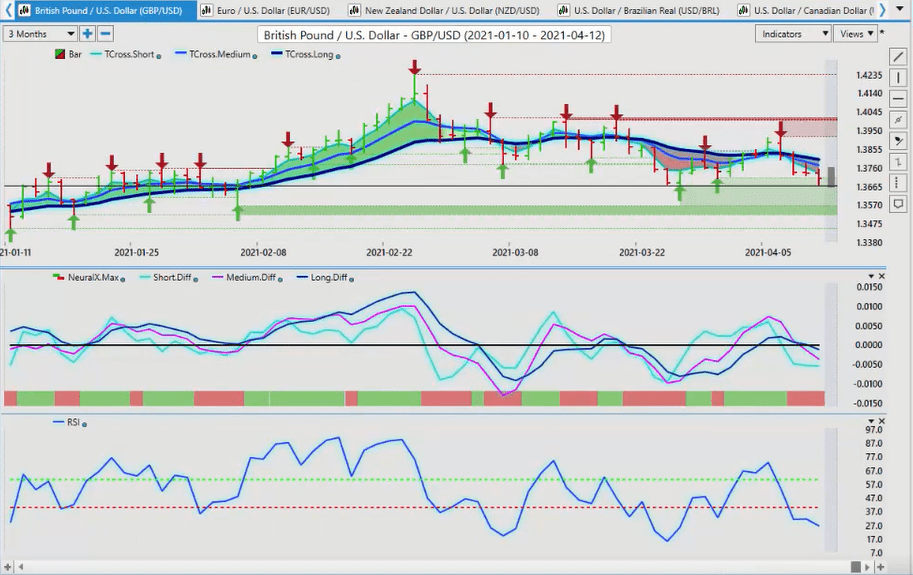
So in order for them to buy Euro, Great Britain, they have to buy Euro, US and sell Great Britain, US. So Great Britain, US and Euro, US are no longer the same trade here because of Brexit, in my respectful opinion only. That’s what I’ve noticed. So a big rally this past week in Euro, Great Britain led to a bigger sell off on Great Britain, US. But I do feel that we’re going to hold here. The yearly opening price I believer is at 1.3643. Watch that level very closely for a reversal. Because again, only in my respectful opinion, there’s a high probability of a bear trap sitting down here. So be very careful at the aforementioned level. Now our predicted difference is down, medium term crossing our longterm predicted difference. We’ve got our neural index down, but again, watch for a reversal. You’ve got people going after low hanging fruit, or you’ve got order flow traders that are waiting to get near that yearly opening price for their long trades.
U.S. Dollar Versus Japanese Yen
Now, as we look at the dollar, yen for next week, the dollar, yen, again succumbing to the dollar weakness on that cycle. But we can also assess that we’re getting all tangled up along this TCross long. 109.44. So if the dollar can regroup itself, and again there’s a lot more positives for the US dollar this year than there was last year. And there’s a lot more negatives for Japan. So always remember what I’ve outlined in these weekly outlooks. There are three main currencies that are tied to gold. The Swiss franc, the yen and the Euro. They have the highest effect. So if gold cannot break out, then dollar, yen is going to reverse. US, Swiss franc is going to reverse back to the upside. I haven’t done Euro, Swiss franc here this week, but US, Japan is the exact same trade here guys.
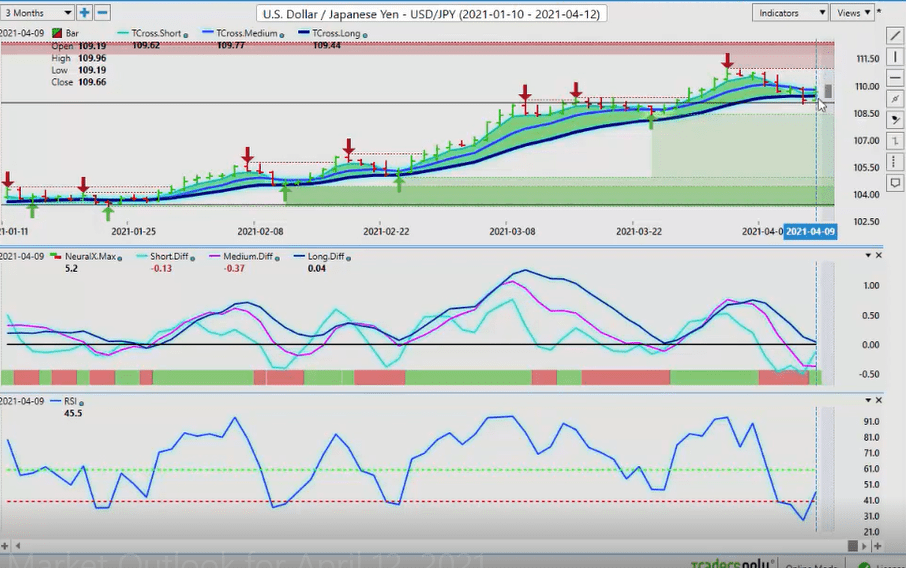
People will go long US, Swiss franc, short US, Japan. And they basically end up with some kind of breakeven. Just remember that these two trades are almost identical and they’re tied to gold. So if gold tanks, Euro, US is going to fail, US, Japan is going higher, US, Swiss franc is going higher. So when we look at this right now, we can already see that that RSI is recovering the predicted RSI, the medium term predicted difference, which measures the medium term trend against the longer term trend, it’s starting to turn. So we’ll keep a very close eye on that. We also want to look at that predicted moving average. Right now, again on this dollar weakness, every single day we’re coming back up to that long predicted. Now that level is 109.75. If we get back up above that level, then the dollar, yen will go into a full recovery mode.
U.S. Dollar Versus Canadian Dollar
Now with the US, Canadian, the Aussie, US, New Zealand, US, these are predominantly equity-based currencies. But even they are succumbing to some degree to this dollar strength. Now with the US, CAD we’re chopping back and forth. We’ve got a verified high at 1.2647 and a verified low now coming in at 1.2502. My biased remains still to the downside on this particular pair because the Canadian economy is feeding off the US economy. And Canada, some will argue it’s in better shape. I wouldn’t be in that camp. We’re in full lockdown in Ontario again. So the virus’ numbers are not good here. But our predicted RSI positioning is breaking down below 40, which suggests there is going to be a downside move here.
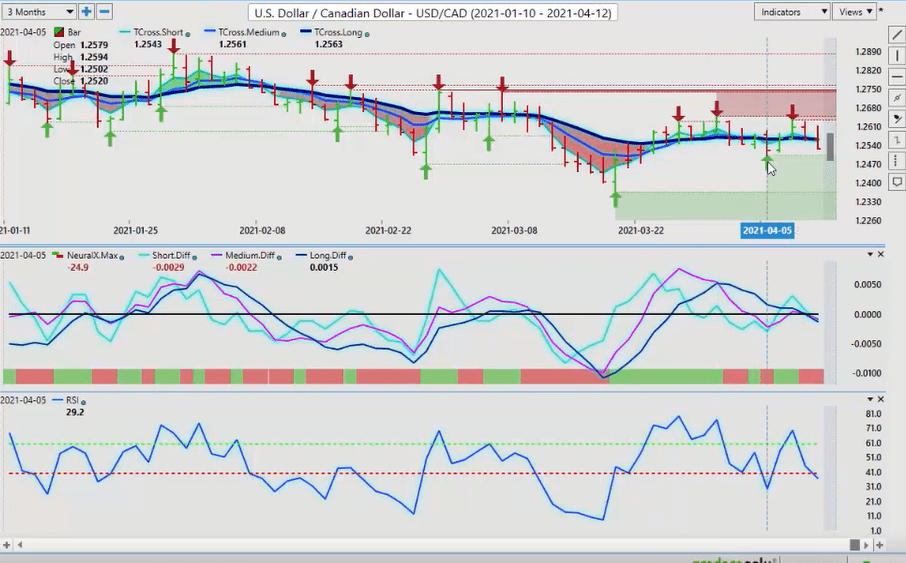
We’re in a period of known dollar strength, so shorts carry the edge. But again, we want to identify for the weak and then you can update your numbers after that. 1.2562, we’ve closed the week below that, we click on our F eight to get our additional pivot area, that’s coming in at 1.2556, so there’s a lot happening in these particular level guys. But that’s where all the action is going to be around that median price. So if you’re a buyer of US, Canada, you would wait for it to move above 1.2570, 1.2580. If you’re a seller, then you would target the aforementioned levels, anywhere between 1.2556 and 1.2570 approximately, to reset those shorts. But always remember US, Canada often does the exact opposite on Tuesday, that what it does on Monday. So if we have a big rally up on Monday, you would short this thing on Tuesday. That’s just the way this crazy pair works. That’s all I can tell you guys. It’s a hint of what I’ve seen over and over and over again.
Australian Dollar Versus Canadian Dollar
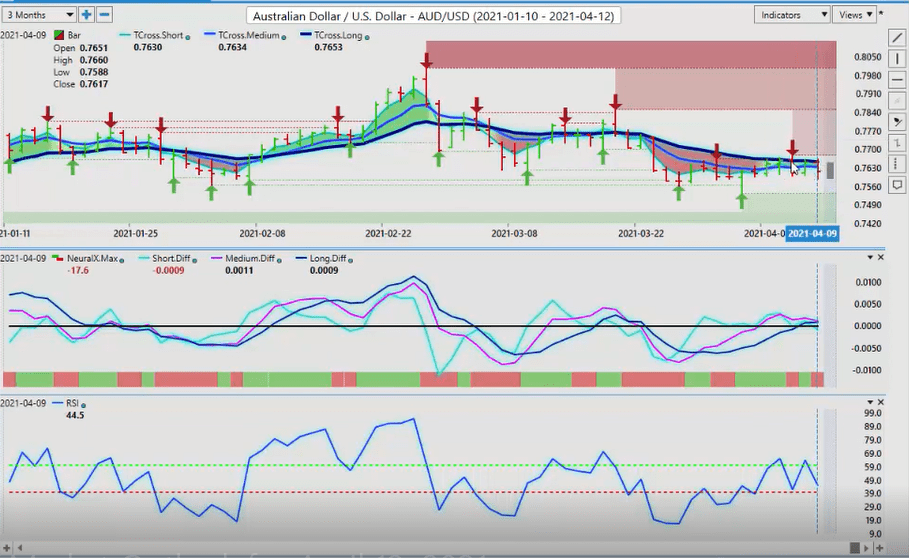
Now with Aussie and New Zealand, they’re basically going to follow that Canadian dollar. So if the Canadian dollar continues to strengthen, then the Aussie and the New Zealand could also. But right now the Aussie, there’s just no buyers. We’re getting all tangled up. And once again, if you’re looking at the software and you know how to identify these key pivot levels, these are very easy, short trades, five days in a row. But again, the Aussie currency does not make up part of the dollar index. Always remember that guys. In the dollar index, you’ve got the Euro at the top of that list, the British pound, the Japanese yen, the Swiss franc, the Canadian dollar and the Swiss krona.
Those are the main currencies in that dollar index. The Aussie and the New Zealand do not make up part of that. So, as you can see, even though the dollar was soft this past week, the Aussie was unable to make any gains. However, if we can break above 0.7653, then the Aussie longs will be back on the table. Right now, we’re just chopping back and forth between the verified support and resistance zones.
New Zealand Versus U.S. Dollar
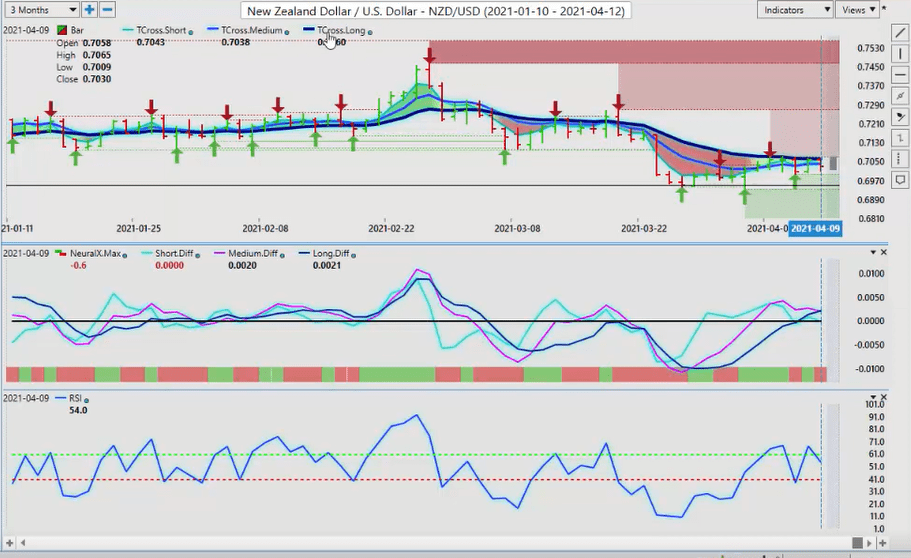
Now, one of the other problems the Ozzie had was the New Zealand currency was kind of beating up on it via the Aussie, New Zealand cross pair. But as you can see, this is the exact same trade guys. We’ve got this key pivot level, 70, 60 on the TCross long, and we’re unable to get above it.
Now that medium term crossing the longterm predicted difference is trying to put out a sell signal. Again, we’ve got another warning here of pending dollar strength against some of these commodities / equity currencies, meeting the Aussie, the New Zealand and the CAD. So if that pink line continues to cross over that blue line, that would tell us that both the Aussie and the New Zealand are getting ready for another leg down. So we’ll keep an eye on that very closely, but as I’ve always stated, trading is tough, but know your levels. So with that said, this is the Vantage Point AI Market Outlook for the week of April the 12th, 2021.
Are you using A.I. yet?


