




Welcome to the Artificial Intelligence Outlook for Forex trading.
VIDEO TRANSCRIPT
Okay, hello everyone, and welcome back. My name is Greg Firman, and this is the VantagePoint AI Market Outlook for the week of May 25th, 2026.
Now, to get started this week, we’re going to begin where we always do with that very important U.S. dollar that is a driving force behind everything we’re trading. Individual stocks, indices, commodities, and, of course, the foreign exchange market.
U.S. Dollar
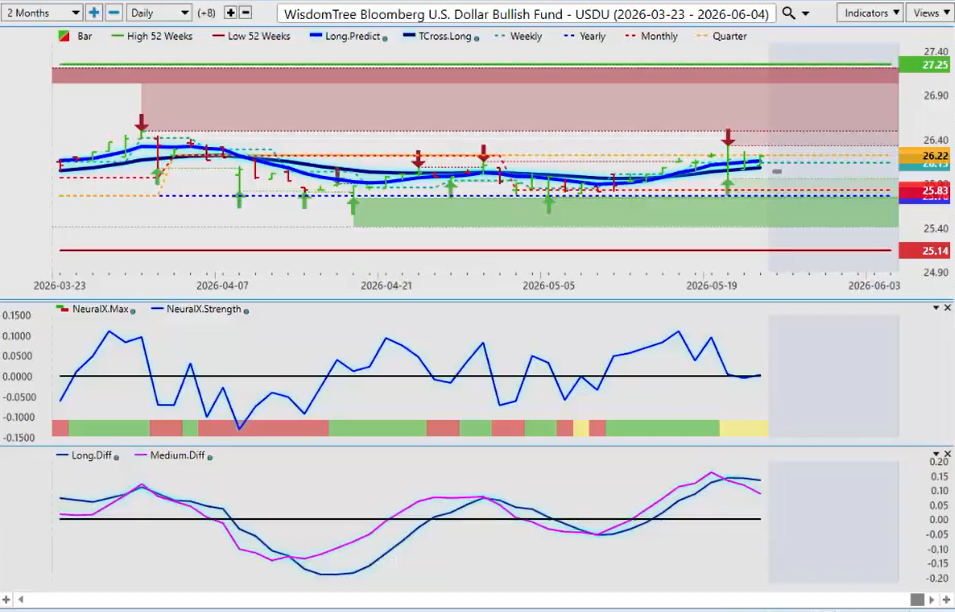
Looking at the U.S. Dollar Index, a broader measurement of the U.S. dollar against a much larger basket of currencies, we’ve had multiple retests of the calendar yearly opening price coming in around 2576.
Now, we’ve tried to push below the VantagePoint TCross long this past week, but we haven’t been able to do it. The MA diff cross, the pink line over the blue line, is warning that we could retrace lower. It’s not necessarily a shift in the trend because we would still need to break below that calendar yearly opening price.
For this particular week, I’ve sweetened the pot a little bit by including not just the yearly opening price, but also the 52-week high and low. Right now, the 52-week range is approximately 2514 to 2725, which puts us basically right in the middle of the range.
Structurally, the dollar still remains bullish in 2026, but there are clear warning signs of short-term weakness potentially developing next week.
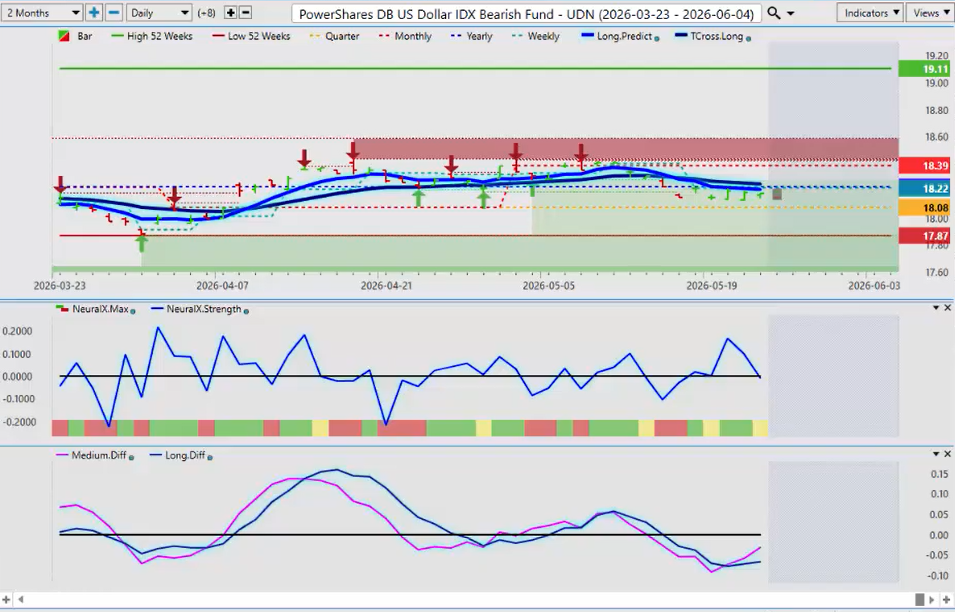
When I look at the UDN, the dollar bear fund, we can see it crossing above the calendar yearly opening price at 1823. We also have an MA diff cross to the upside and a retracement back toward our TCross long.
Remember, this is an inverse ETF. If this moves higher, traders are betting that the dollar is moving lower.
Now, the major headline over the weekend is the possibility of a deal between the United States and Iran. If that happens, it would likely weaken the U.S. dollar and potentially give equities another boost higher.
This is why it’s important to remember this is not a recap of what already happened. This is an outlook for the coming week before the market opens, not after the fact.
Gold
Looking at gold contracts, we now have a 52-week range between 3251 and 5595.
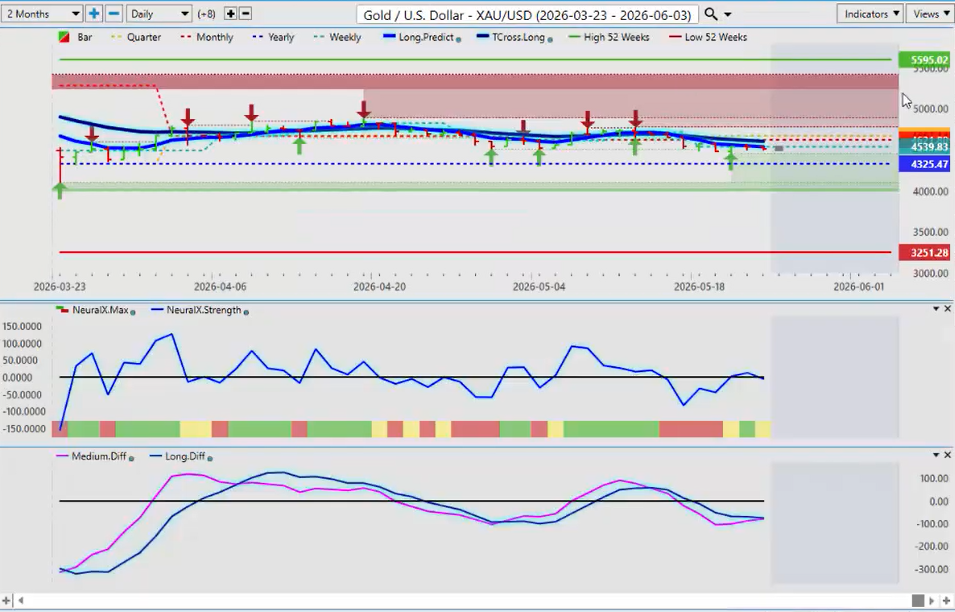
The calendar yearly opening price remains critically important because it tells us what is happening specifically in 2026, not last year.
Right now, gold remains positive on the year. The key level is 4325. As long as gold holds above that level, longs remain very reasonable.
The neural index is mixed, but an MA diff cross to the upside appears imminent. If we lose 4325, then we could target a move back toward the lower end of the 52-week range.
SPY and Equity Markets
Now, this is where things get very interesting.
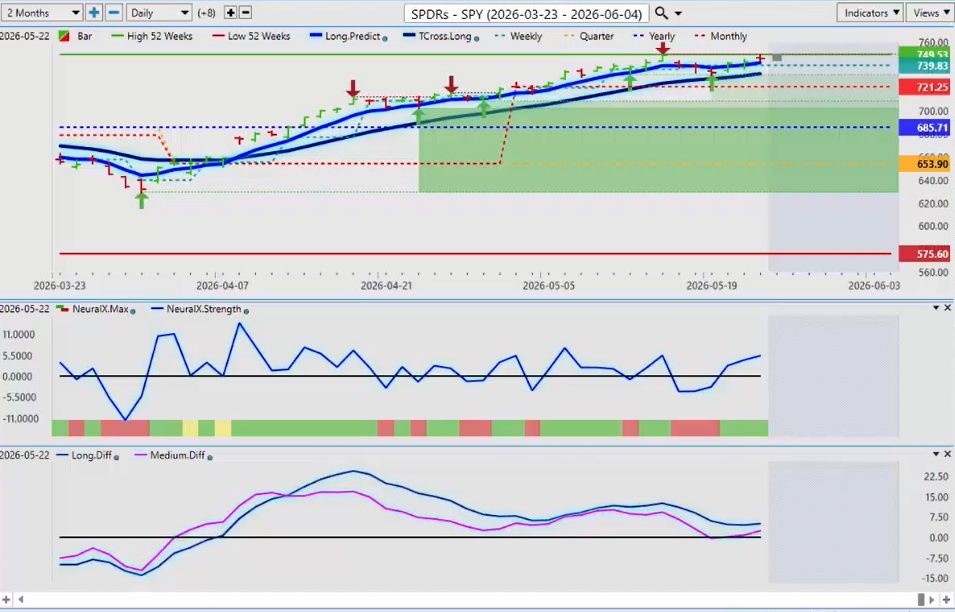
The 52-week high in the SPYs was made this month, in May. That is not always a good sign because markets frequently encounter sellers near fresh 52-week highs.
This is why we blend together the quarterly opening, yearly opening, monthly opening, and the 52-week range.
We’ve had a very strong month in the SPYs, QQQs, Russell, and DAX, but the current 52-week high near 749 deserves close attention.
We did get a medium-term crossover signal, but for traders using VantagePoint TCROSS, the important detail is that price remains above the TCross long at 727.
That means the medium-term crossover is signaling a correction lower, not necessarily a new bearish trend. Structurally, the primary trend remains bullish.
However, I do believe sellers could emerge around the 749 area.
Russell 2000
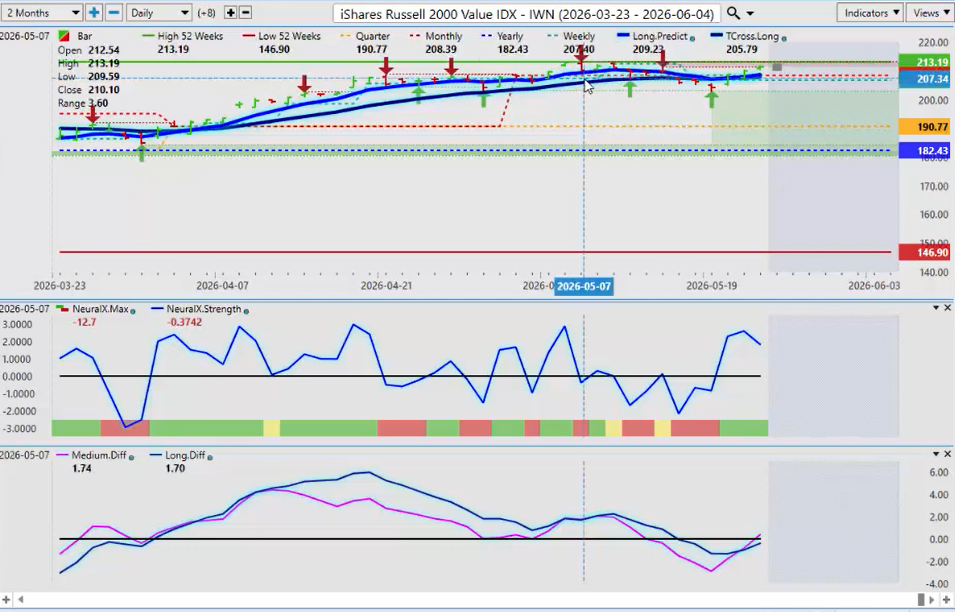
The Russell actually reached its 52-week high even earlier, around May 7th.
But structurally, the Russell remains very strong:
- Yearly opening price near 182
- Quarterly opening near 190
- Monthly opening near 208
Everything remains structurally bullish.
Again, my concern is simply that sellers often appear near fresh 52-week highs. But if positive geopolitical news emerges, we absolutely could see another leg higher next week.
The MA diff cross is warning exactly of that possibility.
The medium-term crossover here is behaving properly because price remains above the TCross long. Above it, we stay long. Below it, we get cautious.
DAX
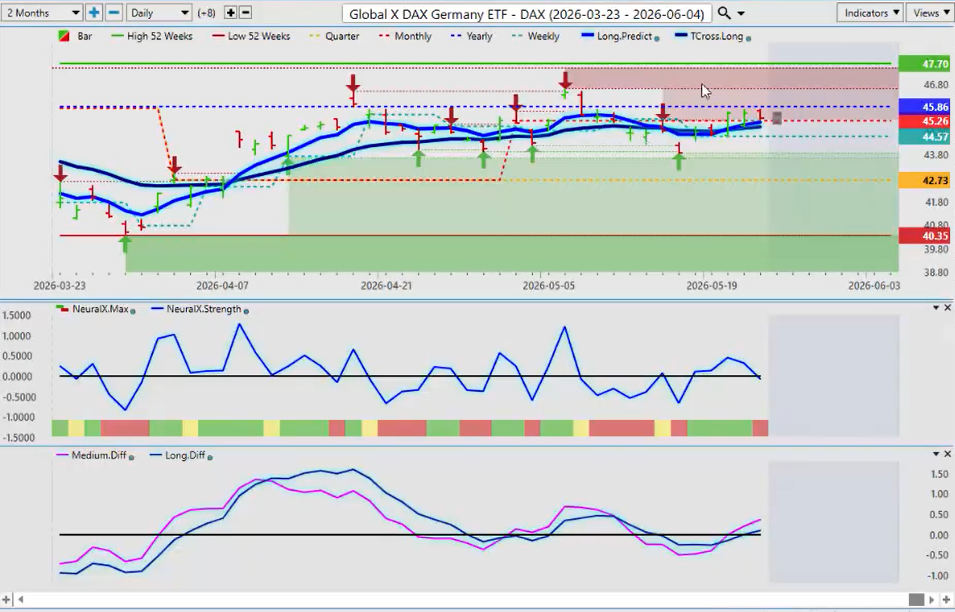
Across the pond, the DAX remains constructive.
We are just below the yearly opening price near 4586, with the 52-week range between approximately 4035 and 4770.
If the Euro strengthens against the U.S. dollar next week, that could provide an additional boost to the DAX.
We remain above the TCross long near 4499, so structurally the setup still favors buying dips.
VIX Futures
Now, this is where traders need to pay attention.
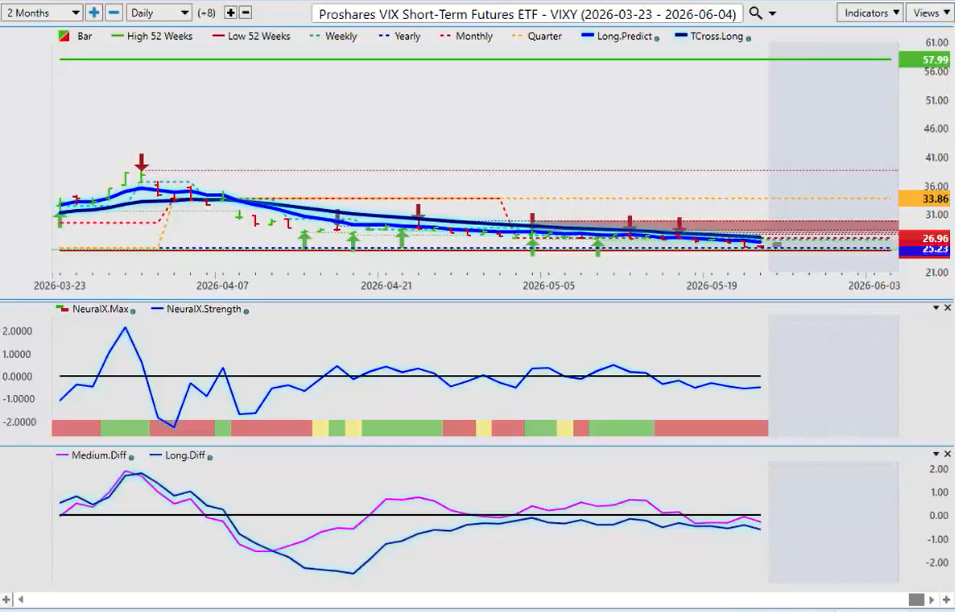
The VIX is sitting near a 52-week low around 2460. That is concerning.
We remain below the TCross long, below the quarterly opening, and both predicted differences remain below the zero line.
That means both the medium-term and long-term crossovers remain bearish for volatility.
In plain English, markets still expect lower volatility and stronger equity prices.
But if there is no U.S.-Iran deal, the VIX can reverse sharply higher very quickly.
Remember this:
The VIX and the U.S. Dollar Index maintain roughly a 95% positive correlation.
If the dollar spikes higher, volatility typically follows.
Bitcoin
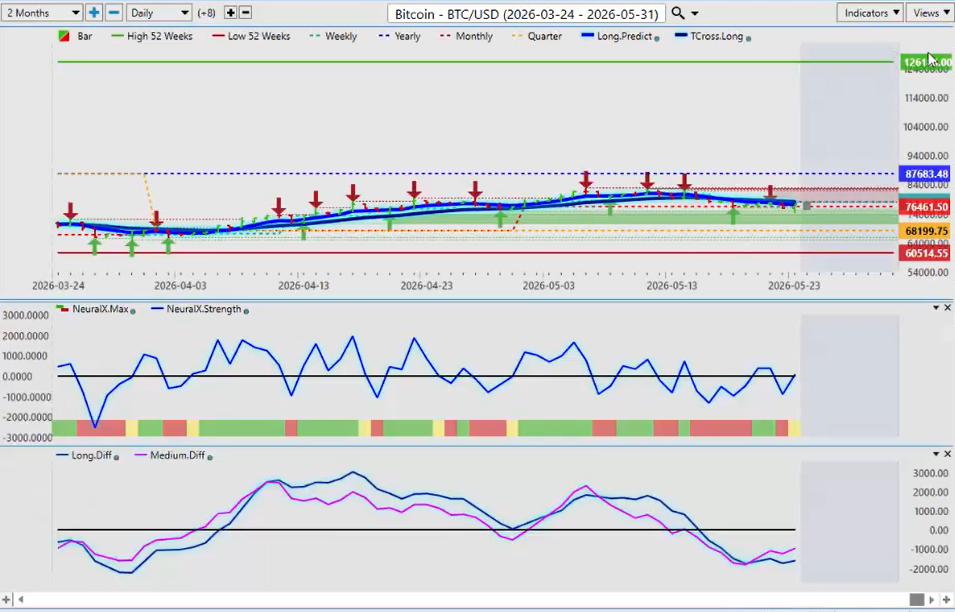
Bitcoin continues to respect the calendar yearly opening price.
The 52-week range is approximately 60,514 to 126,084.
But the critical detail is this:
Bitcoin has not traded sustainably above its calendar yearly opening price during all of 2026.
That’s why the yearly opening matters so much. It tells us the true trend for the current year.
Yes, Bitcoin has climbed off the February lows, but every rally toward the yearly opening price near 87,683 has failed.
Now, longer term, I still believe Bitcoin moves higher into September and October and likely enters another multi-year bullish cycle.
The MACD cross is once again signaling that Bitcoin may be preparing for another upside move.
If equities rally and the dollar weakens, Bitcoin could absolutely test 87,000 next week.
USO Crude Oil
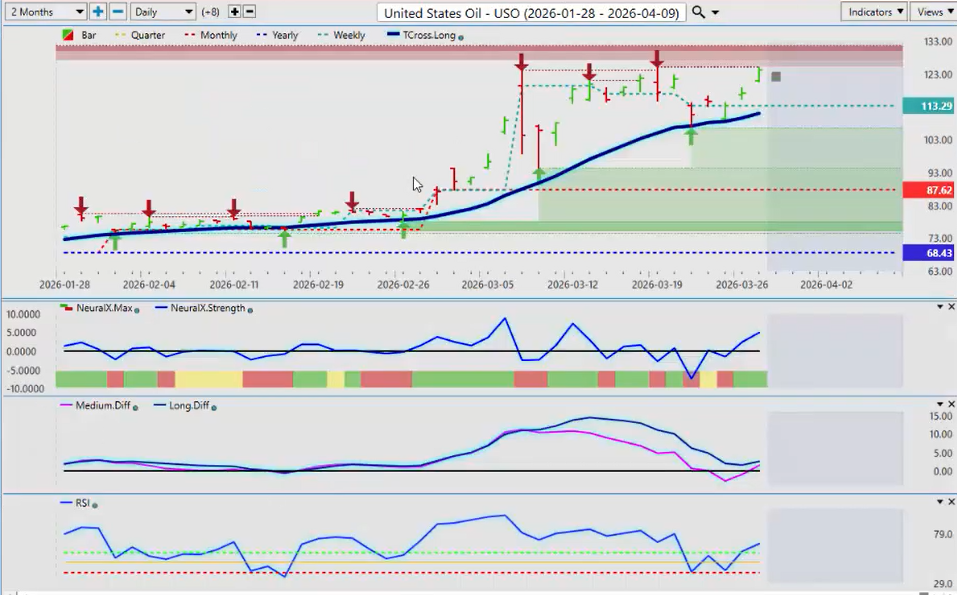
This one is entirely headline driven.
The 52-week high is now near 154 on USO, which is extraordinary considering this ETF typically trades much closer to 68.
Personally, I would not be chasing oil prices higher up here.
If a U.S.-Iran deal materializes, this market could fall very quickly.
The MA diff cross and medium-term crossover are both developing. Price is now slightly below the TCross long near 142.
Technically, this is shaping up as a very attractive short setup if the fundamentals confirm it.
Euro versus U.S. Dollar ($EUR/USD)
A lot of eyes will be on the Euro next week.
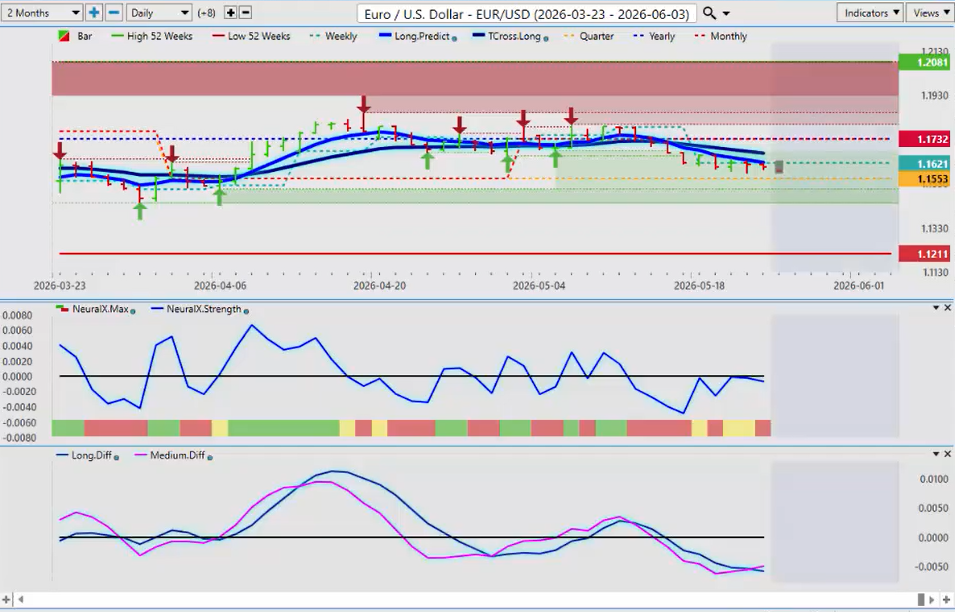
If markets shift into a risk-on environment, the Euro should strengthen.
The quarterly opening price near 115.53 remains major support.
As long as we hold above that level, longs remain favored.
Personally, I would have sell stops ready below 115.40, but until that breaks, I remain constructive on the Euro.
The MA diff cross supports that bullish view.
U.S. Dollar versus Swiss Franc ($USD/CHF)
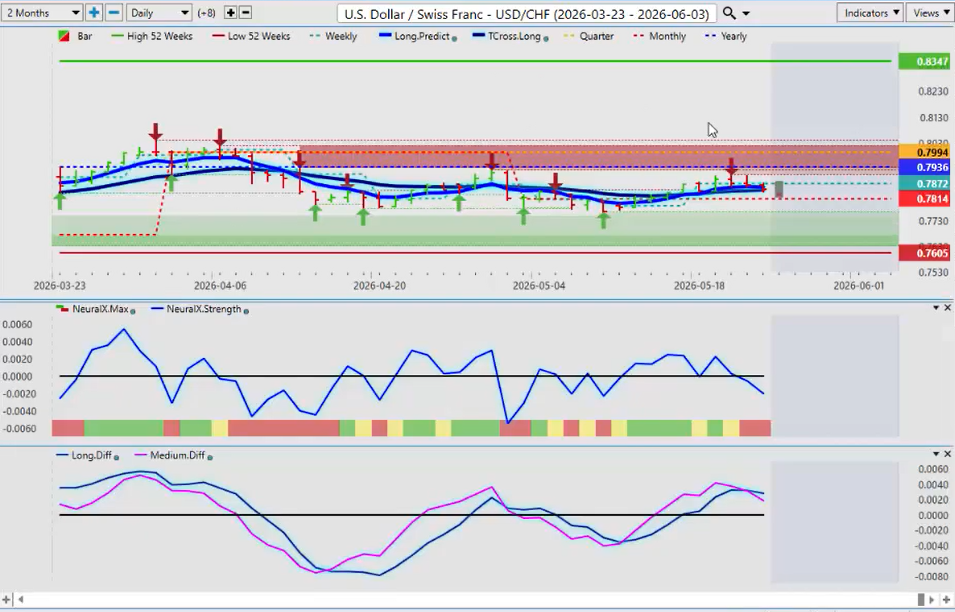
The U.S. dollar continues to struggle against the Swiss franc.
We remain below the yearly opening price, and price is now pressuring the TCross long near 7846.
A break below that level opens the door toward 7605.
The neural index has turned red, the MA diff cross is bearish, and shorts remain heavily favored.
British Pound versus U.S. Dollar ($GBP/USD)
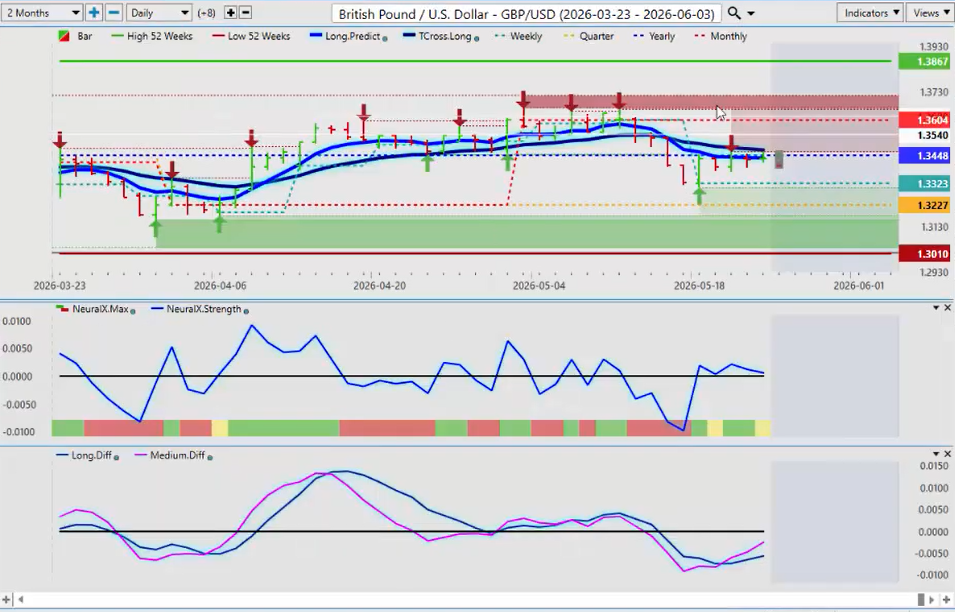
The pound had a respectable week.
However, everything continues to revolve around the yearly opening price near 13448 and the VantagePoint TCross long near 13471.
That area is major resistance.
Aggressive traders can place buy stops above the TCross long, while more defensive traders may prefer sell stops below last week’s low.
We remain almost perfectly centered inside the 52-week range.
U.S. Dollar versus Japanese Yen ($USD/JPY)
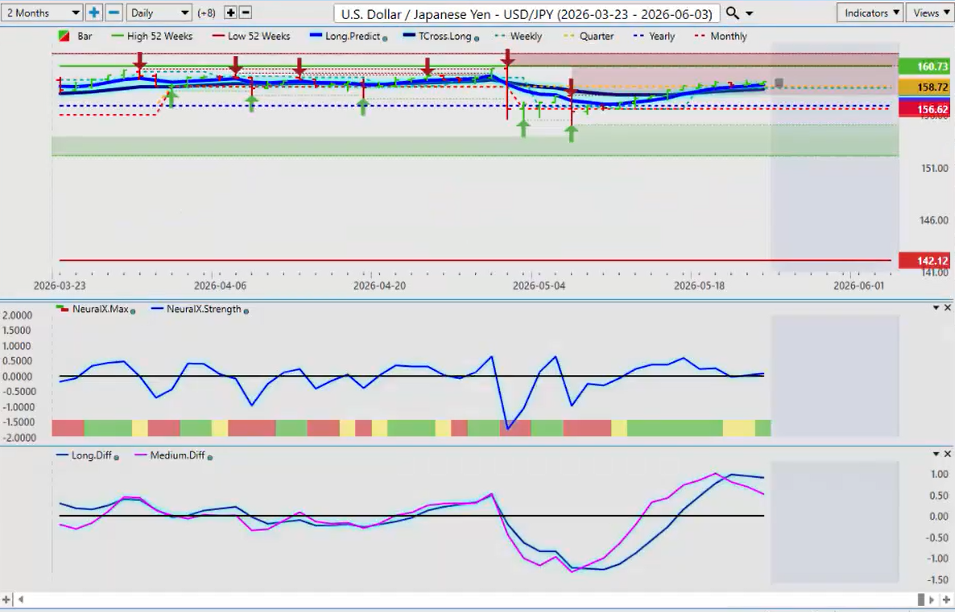
This remains one of the stranger trades in the market.
The 52-week high near 160.73 was recently made, but longer term, I do not believe the carry trade remains sustainable.
I believe the Federal Reserve eventually moves toward rate cuts as softer inflation, softer jobs data, and weaker economic numbers emerge.
Oil prices remain the major inflation driver right now.
The key level to watch is the TCross long near 158.50.
U.S. Dollar versus Canadian Dollar ($USD/CAD)
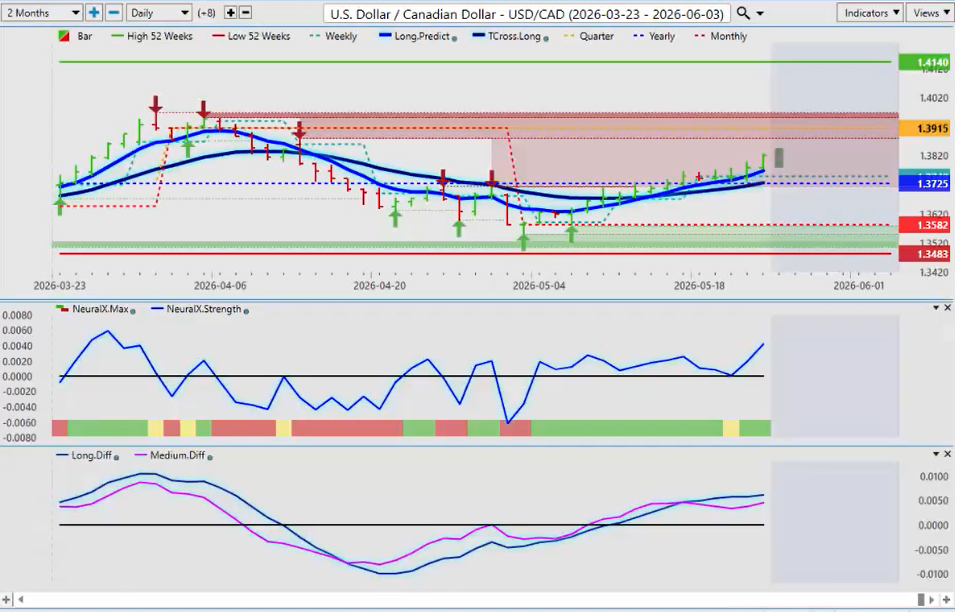
The Canadian dollar continues struggling due to weak economic fundamentals and uncertainty around trade relations.
What’s interesting here is that the VantagePoint TCross long and the yearly opening price intersect almost perfectly near 137.25.
That creates a highly tradeable level.
If we hold above it, longs remain viable. If we break below it, shorts become attractive immediately.
This is about knowing your levels before the market opens.
Australian Dollar versus U.S. Dollar ($AUD/USD)
The Australian dollar has been one of the strongest currencies of 2026.
Importantly, the 52-week highs were made this year, not last year. That means traders should not automatically fear buying strength here.
As long as we remain above the yearly opening price near 66.71 and above the quarterly opening near 69, the Aussie remains structurally bullish.
The Kiwi remains similarly constructive.
New Zealand Dollar versus U.S. Dollar ($NZD/USD)
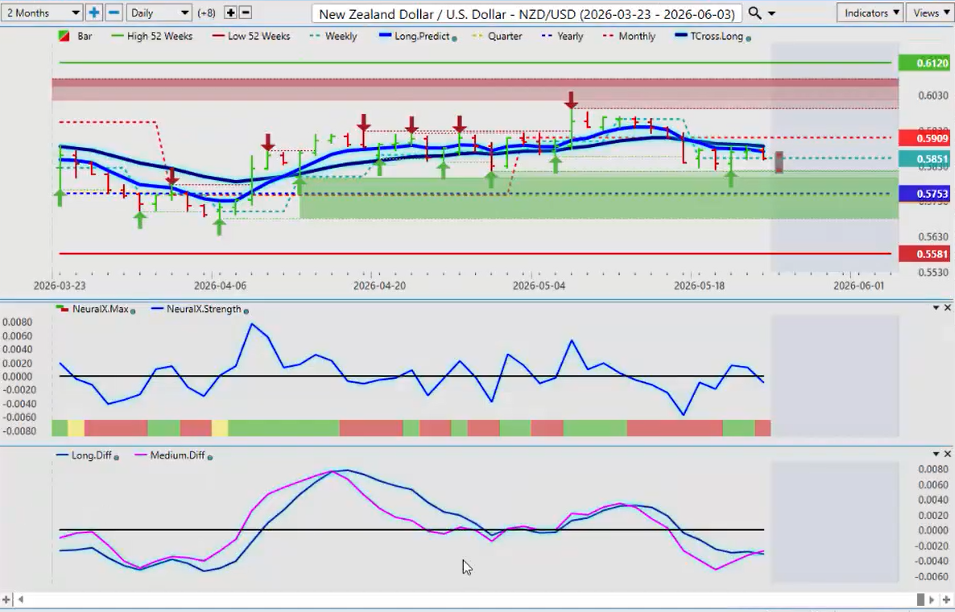
The yearly opening near 57.53 remains the key level.
If equities rally and the dollar weakens, both the Aussie and Kiwi should continue moving higher.
So, with that said, this is the VantagePoint AI Market Outlook for the week of May 25th, 2026.