Welcome to the Artificial Intelligence Outlook for Forex trading.
VIDEO TRANSCRIPT
Okay, hello everyone and welcome back. My name is Greg Firman, and this is the VantagePoint AI market outlook for the week of April the 27th, 2026.
Wisdom Tree US Dollar Bullish Fund – $USDU ETF
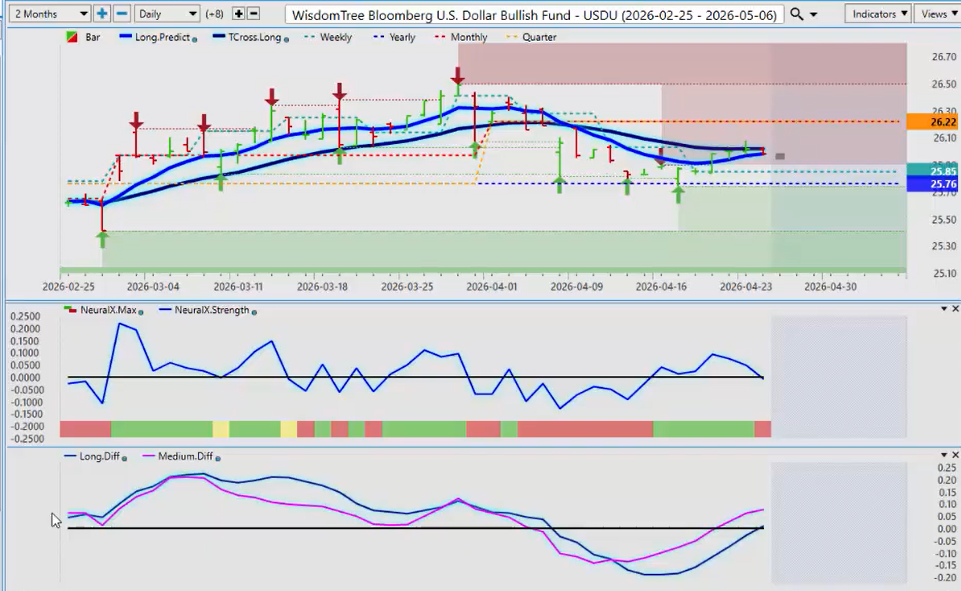
Now, to get started this week, we’ll begin where we always do with that U.S. dollar index. Now, the indicators being used in these presentations on a week-week basis, we’re using the long predicted, which is the VantagePoint long-term crossover without the black line, and the TCross long, only using the main TCross long. So these custom predicted moving averages are being used as pivot levels. I’m also using the calendar yearly opening price that’s coming in at 2576. I’m also using the monthly and quarterly opening, which are both coming in at 2622. That explains the main chart.
Now, down here, I will be using both the neural index and the neural index strength. Looking at both of these two indicators, the neural index, green means up and red means down. But as you can see, the neural index strength can be out in front of the market by a few days potentially. So again, very important that I’m looking at that.
Now, the bottom indicators, the pink line is the strength of the medium-term crossover, even though it’s not displayed on the screen, and the blue line is the strength of the long-term crossover. The theory here is that the medium-term trend will weaken before the long-term trend does. That creates a crossover point right here. So again, using that key level, the TCross long is 2602. That’s that darker colored blue line.
And every chart I use after this will be the exact same in the setup. So right now, looking at this, our TCross long, first and foremost, we have moved higher off of the calendar yearly opening price that is 2576.
In most cases, the dollar is strong at the end of the week into the first week of the new month until the week after the non-farm payroll number. So it’s highly likely that we will break through the TCross long at 2602.
GOLD ($XAU/USD)
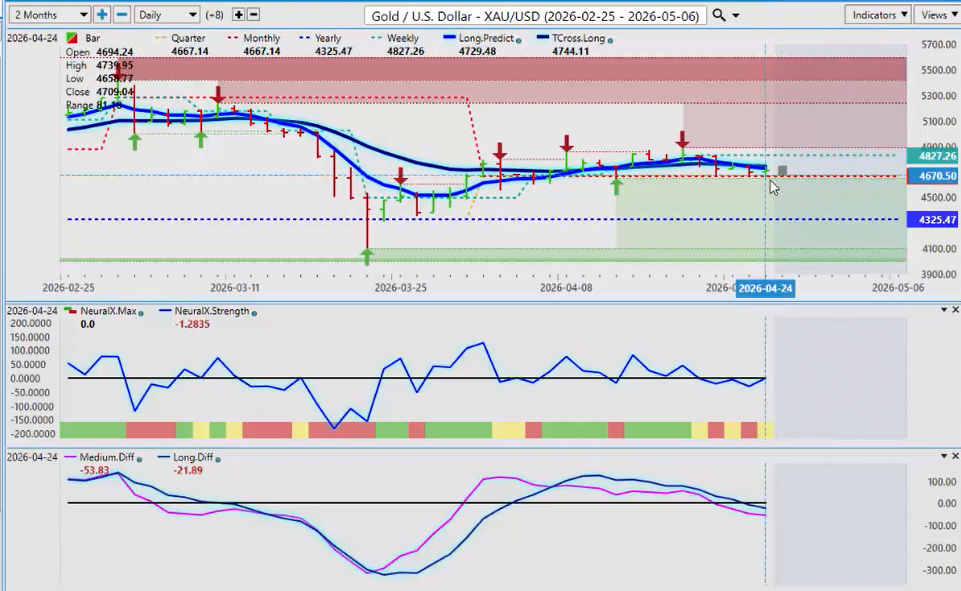
Now, when we look at gold, that should put a little bit of downward pressure on gold. So again, if we look at the exact same indicators, the structural bias here is gold is very strong. We’ve had multiple retests down here of the calendar yearly opening price, only to see it rise.
Right now, we’re holding above the yearly opening price and the quarterly opening price, but we are below the TCross long at 4744. I do anticipate some downside pressure on gold this coming week during that period of known dollar strength that occurs on or about a monthly basis.
So that critical level, as long as we’re below there, gold is likely to gravitate towards the yearly opening price, but I don’t think we’ll get that far because, again, this is a weekly outlook for one particular week. And it’s also an outlook, not a recap of something that’s already taken place.
S&P 500 ($SPY)
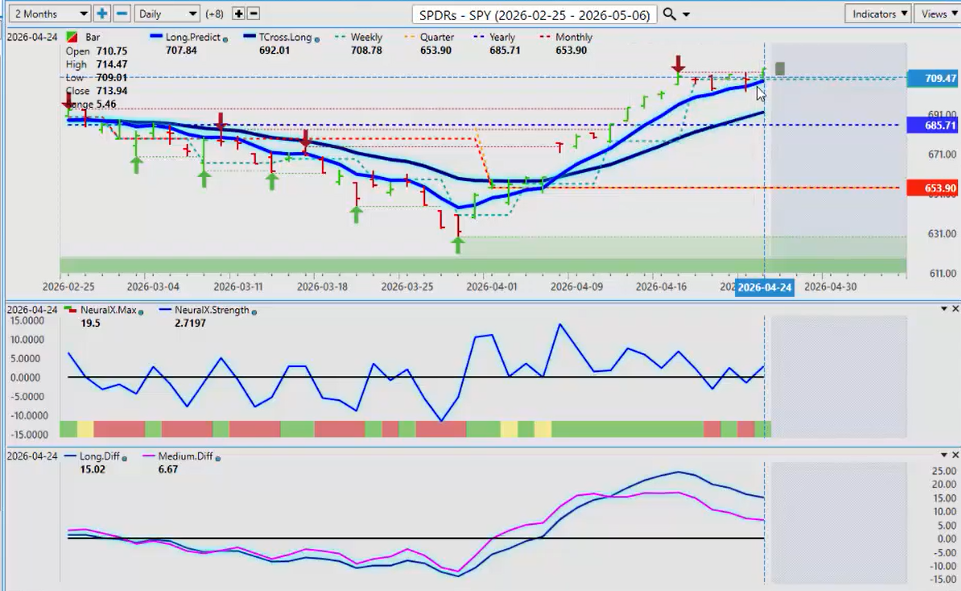
Now, the equity markets, again, if the dollar is rising, then the equity markets would struggle here. They’ve made a big move up. Structurally, they’re very strong.
Again, the orange and red line is the monthly opening price, the 1st of April, 653, 685 on the year. But you can see that we have a new verified resistance high coming in at 712. So that’s the immediate resistance there on the SPYs.
RUSSELL 2000 ($IWN)
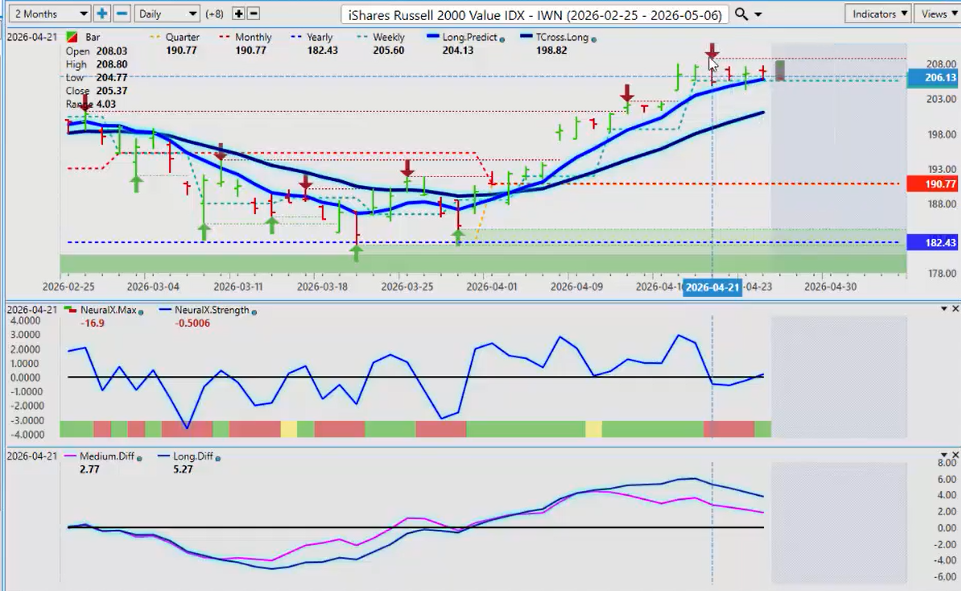
The Russell will be very, very similar here. When we look at the Russell, again, a newly formed verified resistance high there, 20808.
Now, a verified resistance high is when we have a high point and two bars to the left and two bars to the right that are lower than the highest point. But again, we’re using also the long predicted. That’s the long-term crossover without the black line, strictly the predicted moving average.
If we break down below 205, we will likely move quickly towards 20106. That is very likely because you can see that both the medium and long-term predicted differences are pointing down. But we have some short-term strength.
So the initial move I anticipate on the equities to begin the week will be up on Monday and then down on Tuesday. But again, watch these key pivot areas: 20581, 20106.
GERMAN DAX ($DAX)
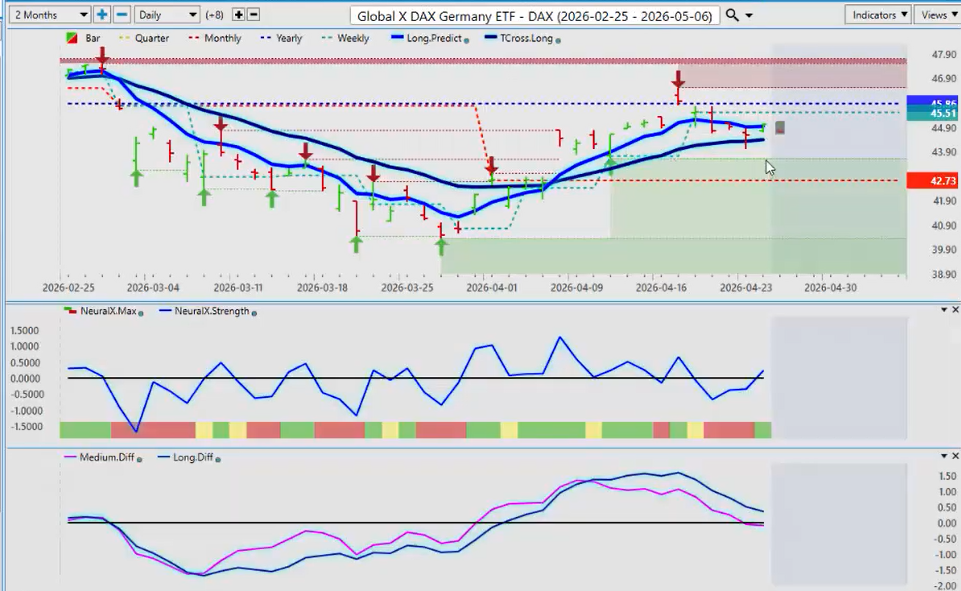
When I look at the German DAX, again, under pressure here. Now, this one’s interesting. The market is trapped between the yearly opening price that’s coming in at 45.86 and the quarterly opening at 4273, which is this line down here.
Now, still technically bullish while above 4273, but very concerning that we couldn’t turn positive on the year. Now, there is a medium-term crossover occurring right here. When the pink line crosses the zero line, this will show a medium-term crossover.
So I don’t really have to have that on my chart because I can see it right there. Now, the long-term trend is still up. Neural index and neural index strength are both pointing up.
So that tells me there’s a bit of strength coming on Monday, but Tuesday, Wednesday, into the end of the week is where you will see the DAX probably fail if the euro continues to move lower.
Volatility Index ($VIXY)
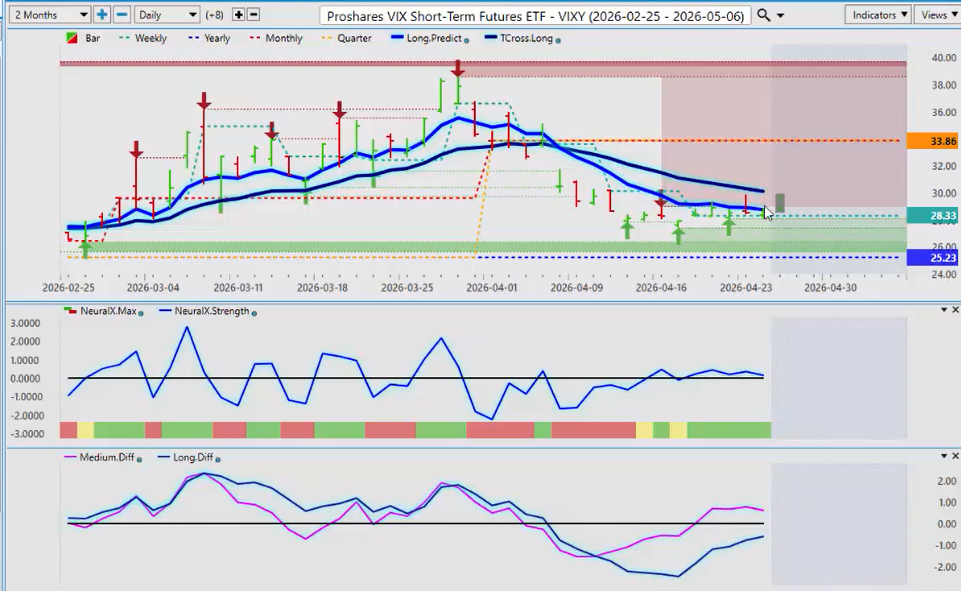
Now again, looking at the VIX, are we above that? We’re still firmly above the yearly opening price on the VIX.
The key level here for this week, 3008. If we hold below that, then again, the equity markets could still extend higher. But as long as we’re below 3008, there is downward pressure on the global equity markets.
Again, the medium-term crossover has occurred as it crossed the zero line, the pink line. But the blue line here, the long-term strength, is still negative.
Neural index is green. So again, very similar situation. Watch for an initial move to the upside, then by midweek starting to break lower.
BITCOIN ($BTC/USD)
Now, when we look at Bitcoin, excuse me, by midweek looking to break higher above the yearly opening price. The VIX is inversely correlated to the Russell, the DAX, the S&P 500.
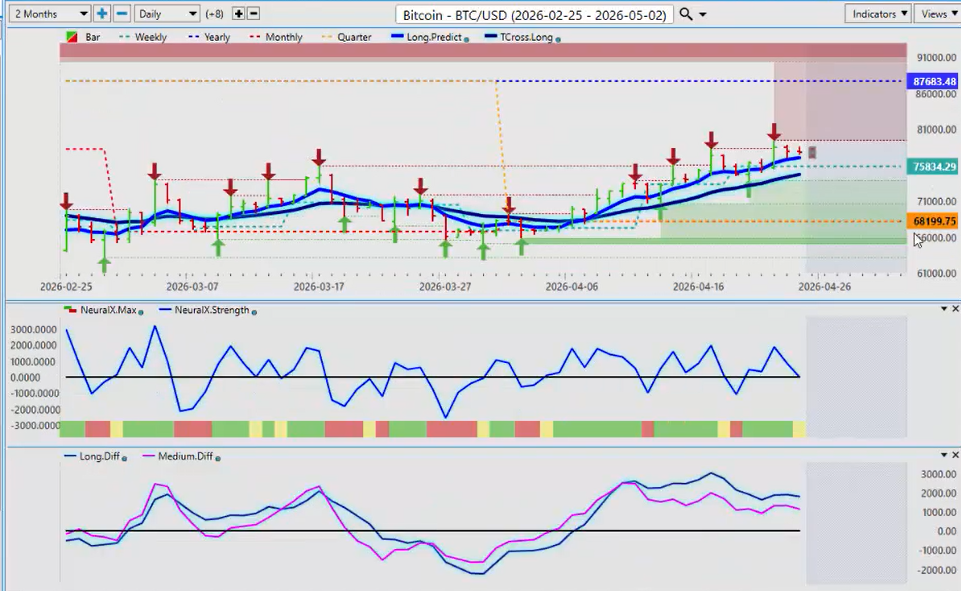
Now, Bitcoin remains trapped. We are moving higher, but again, it’s very important when you’re identifying the actual primary calendar trend. This opened at 87,683. We have been below this level the entire calendar year.
The primary trend is clearly down in 2026, but at the latter part of 2026, I anticipate Bitcoin will move up aggressively, and then we will have three strong years.
Bitcoin runs in a three-year cycle, guys. Three years up, one year down. This is the down year. That’s why it’s down. But the closer we get to the fourth quarter, the stronger Bitcoin is going to get.
So right now, we play the levels between the yearly opening 87,683 and the quarterly at 68,199. In between that is that critical VantagePoint TCross long at 74,763.
As long as we can hold above that, we could potentially push a little bit higher, but ultimately, I believe we go lower before we make that bigger move to the upside.
CRUDE OIL ($USO)
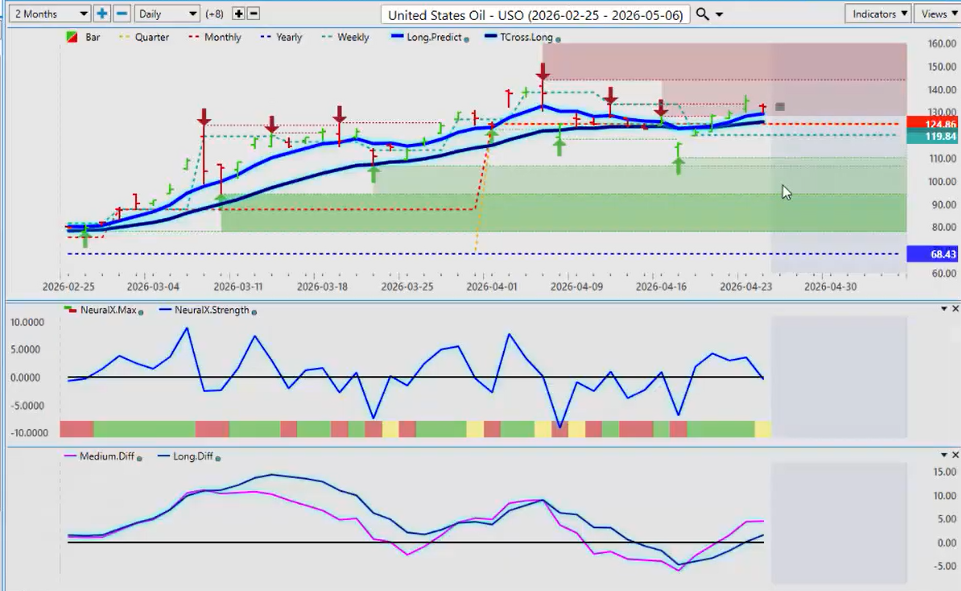
Now, oil prices continue to be elevated. Very confusing. Maybe there’s a ceasefire, maybe there isn’t. It’s got a deadline, there’s no deadline. So very, very confusing.
But for now, the primary trend is up on the year, 68.43. But the quarterly opening price and the TCross long are intersecting at the exact same level, 125.81 on the TCross long and the monthly and the quarterly 124.86.
So they’re basically at the exact same level. So if we remain above that level, then longs still remain in play.
Another way you can play this is put a sell stop below the quarterly opening below 124.86. We break down below that, and then oil starts to tank.
But for now, we do have an MA diff cross. You can see a very accurate MA diff cross. Pink line crossing the blue line. We hit a bottom, and then we start to rise.
So for now, we have a medium and a long-term crossover, which is bullish for oil. But a lot of this is going to be dependent on what happens between the U.S., Iran, and Israel.
Euro versus U.S. Dollar ($EUR/USD)
Now, as we look at our main FX pairs, there is a bias for dollar strength. These are all G7-based pairs trading against the U.S. dollar.
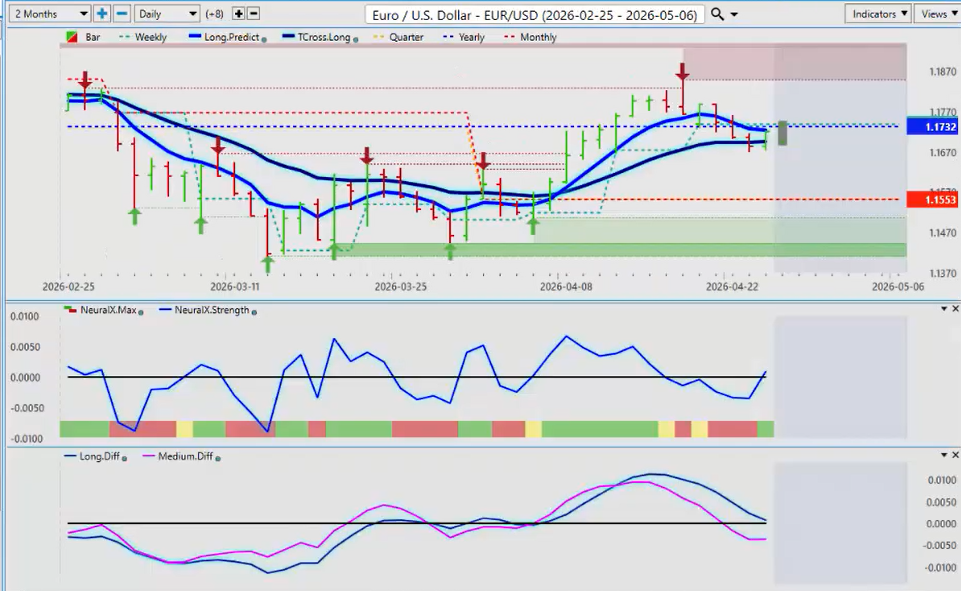
Looking at the euro U.S. pair, we have slipped below the yearly opening price, but the critical level to watch here is 1.1697.
One of the ways you can play this is put a sell stop order below the most recent low, 1.1673. If we break down below the VantagePoint TCross long, then the euro is likely to extend lower.
However, the initial move is likely to the upside. Tuesday, Wednesday, you’re likely to see it sell off. It’s a repetitive pattern.
U.S. Dollar versus Swiss Franc ($USD/CHF)
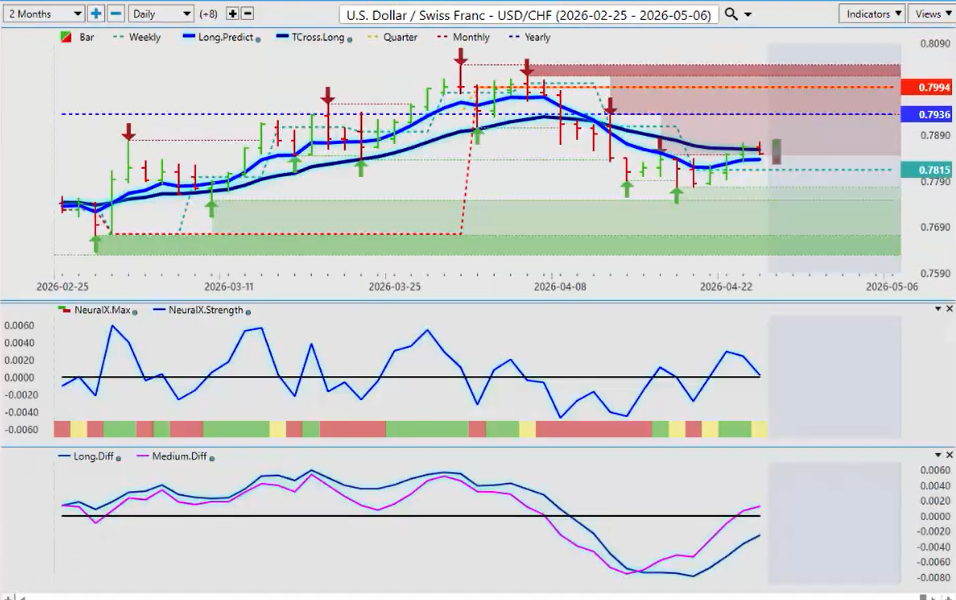
Now US Swiss Franc again the base currency in this particular case where euro US the euro is the base currency here the US dollar against the Swiss Franc there structurally it’s very weak the yearly opening the quarterly opening we’re below both of those you can see the failures up here but uh we do have a medium-term crossover the pink line has crossed over the zero line but the neural index is pointing down so once again if we get a rally up on Monday uh the primary trend 7936. As long as we’re below that, guys, selling up into that level would be a reasonable play. The VP indicators right now are strictly warning of a corrective move higher, not a trend reversal at this particular time. In order to get that trend reversal, we would have to move above 7936 and more importantly move above 794. Okay.
British Pound versus U.S. Dollar ($GBP/USD)
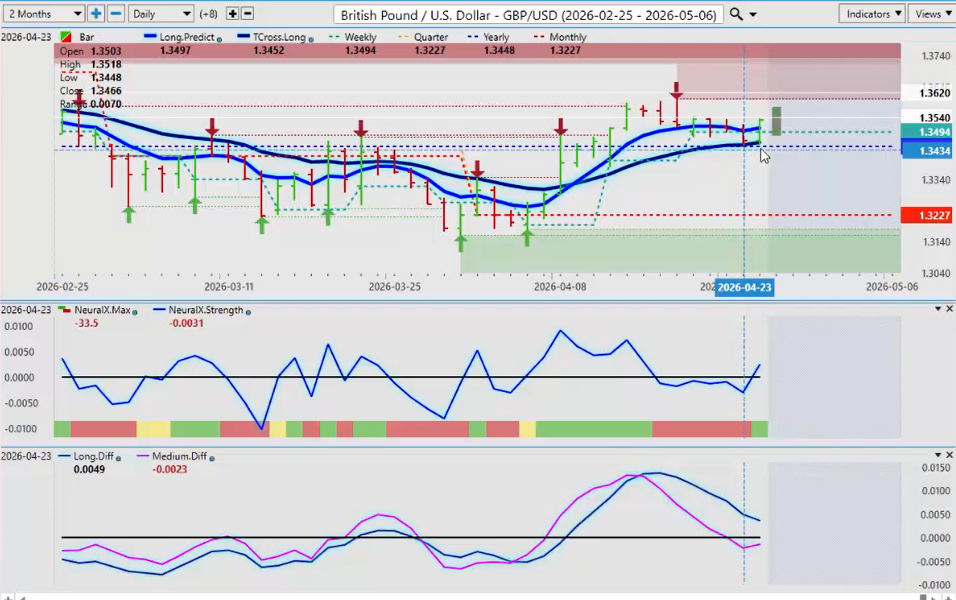
Now, the British pound again, it uh it came right down. And this is where a single predicted moving average can be very beneficial, guys, because it’s a line in the sand. You’re not waiting for anything. It’s sitting there. It’s stationary. So, when the market starts dropping, we can identify these downside levels. The yearly opening 13448 critical level, but now the VPT cross long is also sitting there at 13459. So again, all of your support is sitting right there. If you’re a buyer, that’s where you buy from. Now again, as an alternative strategy, you can put a sell stop below 13559, say 1 or 13459. So you could put a sell stop order or a sell limit about 13450, 13449. If it breaks down below this area as it’s going down, you catch it because you know your levels. The main thing in in trading guys that I can share with you is know your levels. And this is very very critical. The easiest way to identify a trend in any calendar month or year is whether it’s above or below the monthly or the yearly opening. So again in this particular scenario the monthly is way down here. So we could break down below that and then head towards 132 uh 13227. But my optimism on that right now remains guarded. I think there’ll be initial move to begin the week will be to the upside until about midweek and then we fall. So another sell zone area would be the top of this verified zone high 135.99.
U.S. Dollar versus Japanese Yen ($USD/JPY)
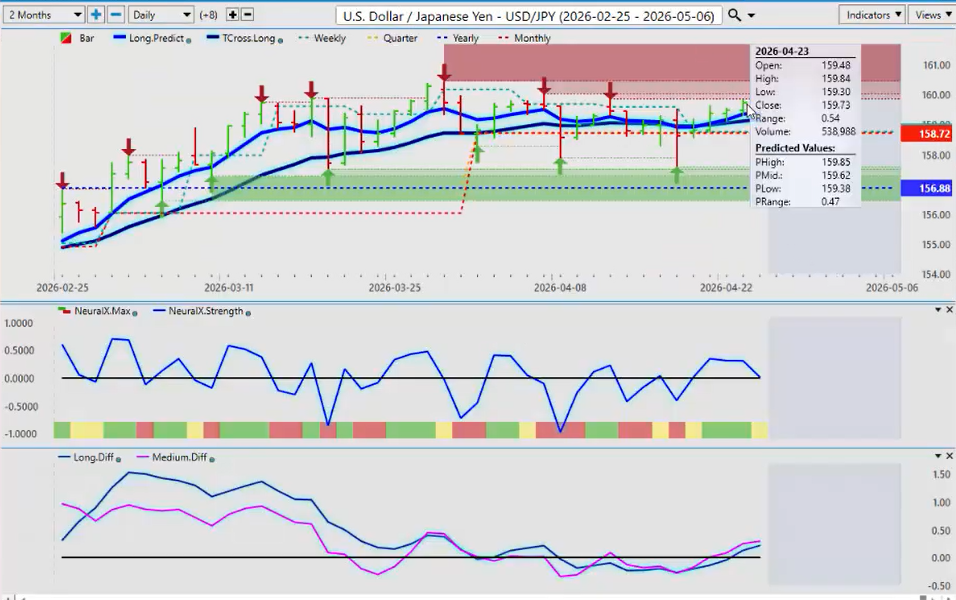
Now the dollar yen once again uh structurally [clears throat] hard to believe we’re sitting up here again in this 159 area but the carry trade is still fully in play. Both of our predicted differences are above the zero zero line. That means we have had a medium-term and a long-term crossover. The neural index, which which is a shorter term indicator, is pointing down. You’re getting a caution yellow. So again, know your levels, guys. And this is how we do it. The trross long 15918, the quarterly opening 15872, and the yearly at 156.88. So, these are our downside support levels that we would buy into at the current time unless the Bank of Japan starts to cut rates and the US uh or starts to raise rates, excuse me, and the US starts to cut rates. So, we’ll monitor it. But for now, going into a period of known dollar strength, longs are favored.
U.S. Dollar versus Canadian Dollar ($USD/CAD)
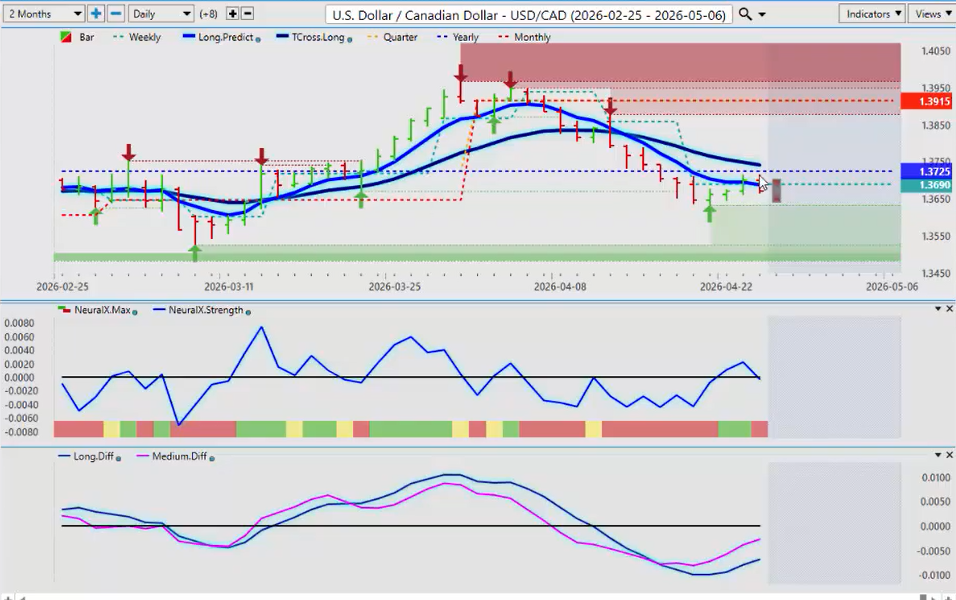
Looking at the US Canadian pair again, we’re slipping just below the yearly opening price, but this one is fairly easy to analyze. We have an MA diff cross back here about a week ago. The market moved a little bit lower, but then you can see it started to reverse back up. So the yearly opening price 137242 25. That’s the line in the sand, guys. If we can hold below that, shorts are still reasonable. But under the the state of the current prime minister and party in Canada, a weaker Canadian dollar in the future is likely once we get past the oil strength. That’s really the only thing keeping the Canadian dollar afloat here. Uh again, so when we look at our upside levels, the yearly opening price 13725 and then our tcross long 13740. So as long as you’re staying below that, then shorts are in play. Another again 13745 a buy stop just above the tross long and if it comes up you can hit it and it will activate a long trade. No recommendation is made being made for longs or shorts. This is for educational purposes, but that’s the way a way to use the VP software.
Australian Dollar versus U.S. Dollar ($AUD/USD)
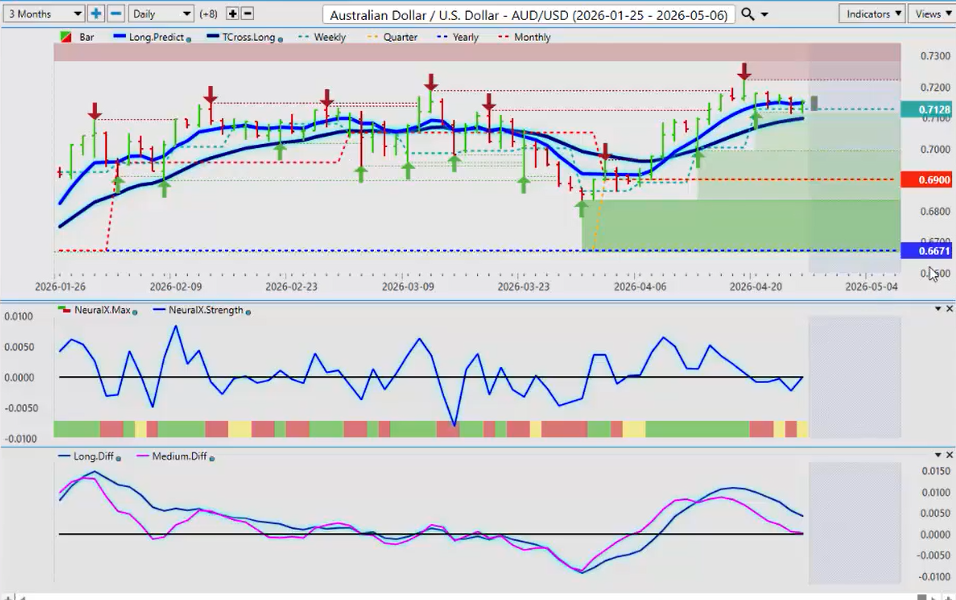
Now, the Aussie and the Kiwi, they remain the stronger currencies in the FX market. Firmly above 6671, the yearly opening price structurally on this particular quarter 69. So this is what I would look for being above the yearly opening price but the quarterly opening for a long trade also above the yearly opening. So once again the neural index very mixed tier. Uh predicted differences trying to show weakness. Uh this pair if we do get any weakness next week we should be using that as a buy opportunity down to our tcross long 7098. But uh I’m it’s not beyond the realm of possibility that we could move towards the 69 area before the dollar uh sells off again and the Aussie continues to move higher.
New Zealand Dollar versus U.S. Dollar (NZD/USD)
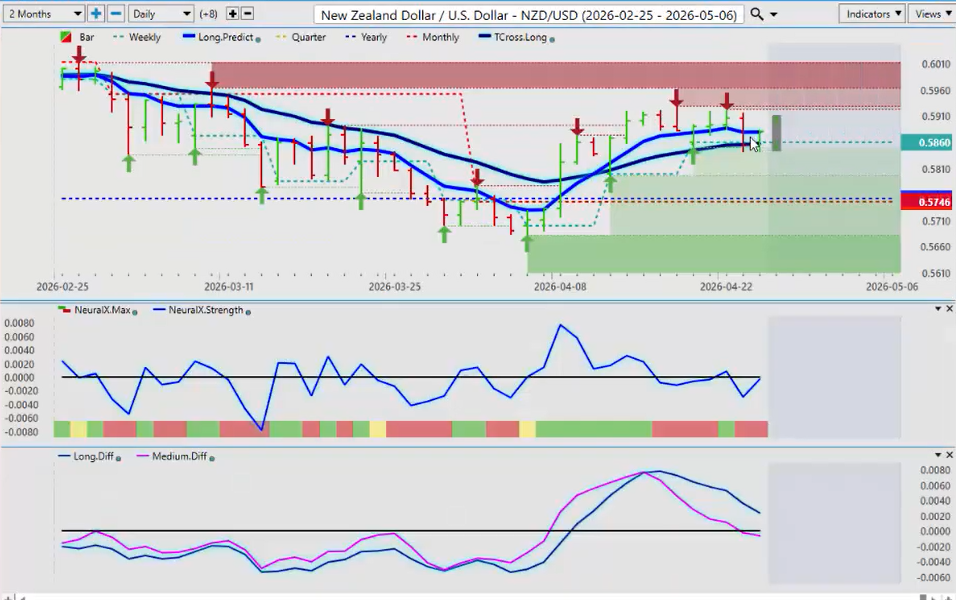
Based largely around interest rates and the Kiwi, the same thing, guys. When we see this one here, uh I think it’s just a matter of time before this one breaks down. But again, we want to buy a dip all the way down to the yearly opening price, which is 5753. That’s really only about a 100 pips from where we finished on Friday, guys. So again, if you’re buying this thing, buying it down, using that hard pivot line, I do have a medium-term crossover, so there is likely to be some downside, but any downside here should be used to reset longs. But for next week, expect another volatile, choppy week until things settle down between the US and Iran. But with that will always come opportunity.
So with that said, this is the VantagePoint AI Market Outlook for the week of April the 27th, 2026.