


VantagePoint AI Market Outlook for the Week of December 1, 2020
VIDEO TRANSCRIPT
U.S. Dollar Index
Hello, everyone and welcome back. My name is Greg Firman, and this is the Vantage Point AI Market Outlook for the week of December 1st, 2020. Now, to get started this week, we’re going to begin where we always do with that very important US dollar index. Now, with the dollar index, it’s been under significant selling pressure with all the current events, which we all know about. However, we’re coming in to, again, a very significant support level.
Now, the reason why this support level is, is important is we have seen a dollar cycle where the dollar strengthens in the first week of the new month, around the non-farm payroll, the week of the non-farm payroll, which, of course, is this coming week. Now, I’m not overly concerned with the employment numbers, because obviously because of COVID, it’s impossible to really gauge those numbers or the U-6 number, but the fed is going to speak also this week. Powell is going to testify before Congress, I believe. So it is still going to be a choppy week.
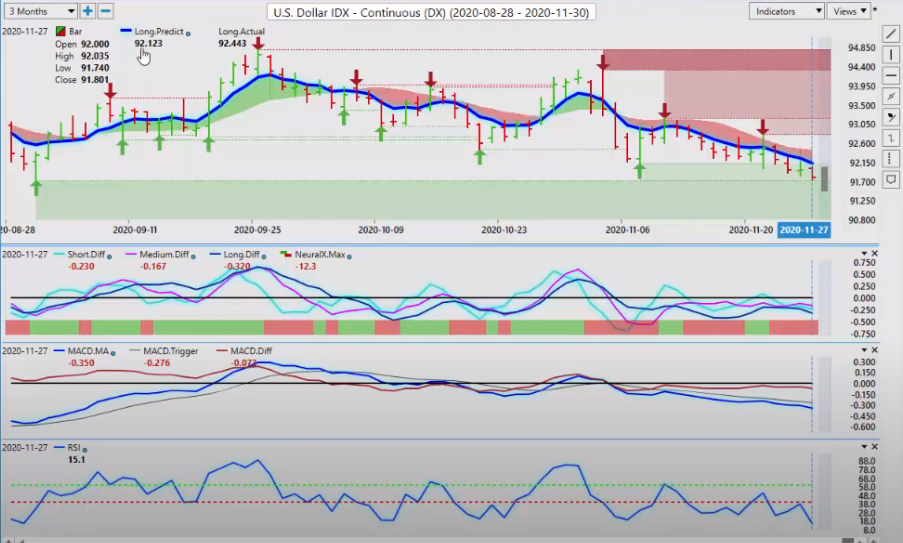
What we look for right here, again, around a support level, there’s a couple of things. Our T cross long 92.51. We know that the further we move away from this level, the more likely it is we’re going to retrace to it. When we click on our Vantage Point predicted moving average, our key moving average, our long predicted is getting closer to price at 92.12. We also know that the further the market moves away from this level, the more likely it is we’re going to retrace to it. Our neural index is firmly down. Our predicted RSI is at 15.1.
Again, just because something is oversold, doesn’t mean it can’t go lower here, guys. But the thing we want to watch here to begin the week is, of course, this low at 91.71. What I suspect will happen is there will be a big push in dollar weakness on Monday, only to see it completely and utterly reversed on Tuesday, Wednesday, Thursday, Friday. Keep a close eye on that, but the key level you want to watch to begin the week in your trading is the 92.12 level. If we get over 92.12, then the dollar strength will come to fruition.
Gold
Now, when we’re looking at that, obviously gold moving aggressively lower here, losing those major support levels that I’ve been discussing for what seems like at least two or three months now, holding along that 18.48 level. We can see it here, 18.57. We had a slightly lower low there coming down to I believe, yes, 18.54. When we lose that level, we go lower. But what I will warn everybody here is that when we look at the six month range, we’re also coming in to a very, very heavy support level.
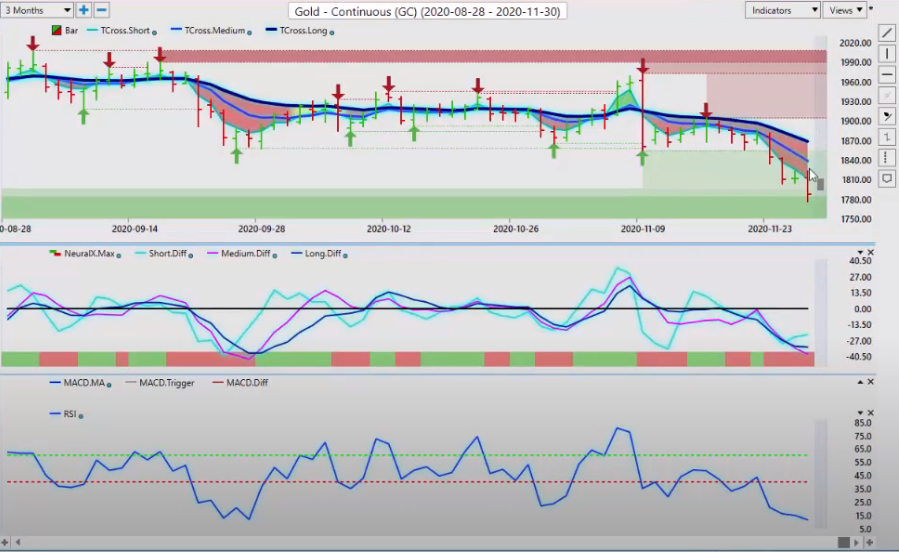
At this particular time, there’s likely going to be either the dollar is going to go higher and gold is going to go significant lower, or the dollar is just going to kind of flatten out and gold is going to recover. My view is keep a very close eye on 17.84 to see if we can hold. We have additional support on gold going down into the low of 17.36, and then basically the line in the sand, which is basically game over for gold bowls, which would be low at 17.02. But again, guys, let’s not get ahead of ourselves.
Let’s focus on the key level here to begin the week at 1784 and see if we can hold. The Vantage Point indicators are grossly oversold here, the predicted differences, the predicted RSI. But once again, what concerns me is when the market moves too far away from the predicted moving average. That key pivot area is now 18.34. So keep a very close eye on 1834 to begin the week to see if we can get back up above that level, but I think it’s very unlikely at this particular time or this particular coming week, barring some economic catastrophe, COVID cases, something along that line.
S&P 500 Index
The S&P 500, once again, fully recovering its move, its downside move. Now, again, when we look at the long predicted by itself, we can see that when the market pauses, it usually gets back up above it. So we want to make sure we’re using the T cross long and the long predicted to identify the trends. For now, the S&P is still moving kind of sideways after this big move up into this high of 36.67. I’ve seen some very aggressive calls for this for 2021, 4,00, 4,400. I don’t know if I would be in that boat or not yet.
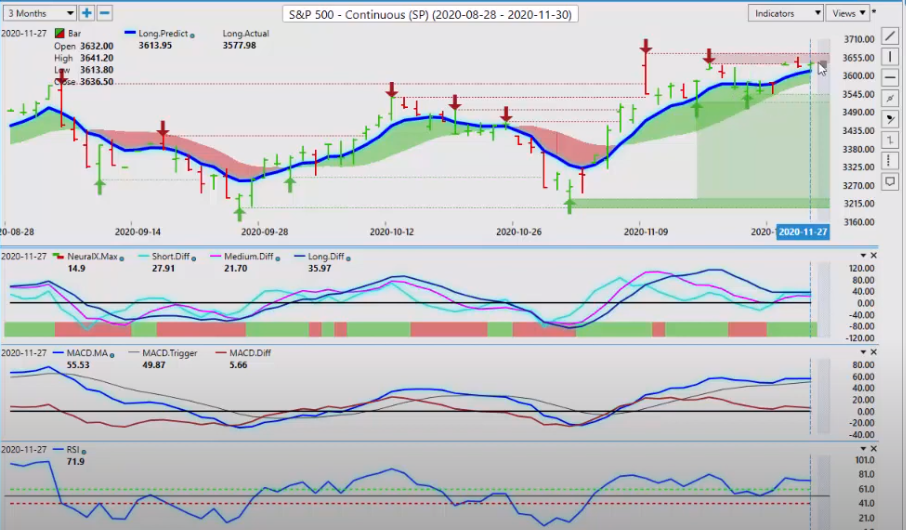
We’ll continue to monitor this. But for now, the S&P 500 remains bullish, again, while above 36.13. This is the level to watch to begin the week. Now, when we look at light sweet crude oil, light sweet crude oil is really getting a boost from the equity markets. We’ve moved above this rather aggressive resistance high at 44.37. The concern that I have here guys is that very often when we take out a level like this, it’s a bull trap, and then we have a significant retracement lower.
Crude Oil
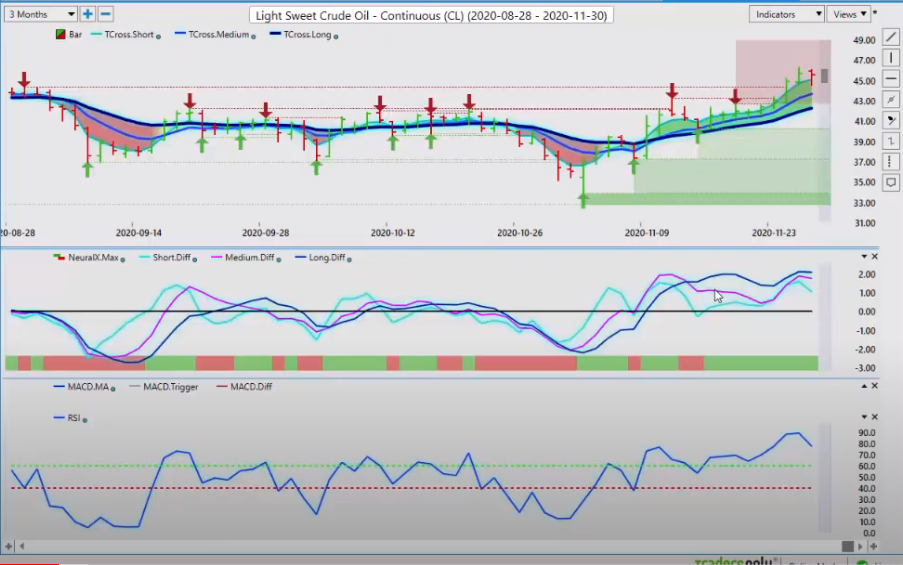
So if you are so inclined to buy oil next week, you would look for the T cross long. 42.26, excuse me, is your main support level. When we click on our long predicted, we then have another critical level at 44.20. Our indicators are getting very, very toppy up here, and again, at a major resistance level. So if the oil is going to fail, it would likely be next week. So keep a very, very close eye on those particular levels. Now, when we look at one of my favorites here, which of course is Bitcoin, probably a decent opportunity yet again.
Bitcoin
Remember what Bitcoin trades against here, guys. It trades against the US dollar. If we’re coming into a period of known dollar strength, then it’s perfectly normal for Bitcoin to retrace. Now, one could argue that we’ve had a significant failure above 19,000, and Bitcoin is now going to start moving lower. I’m not necessarily in that camp, guys. I think that one could argue that Bitcoin is slowly becoming a treasury reserve currency to some degree. You’ve got corporations now that are putting money into Bitcoin, not into dollars.
So again, the future looks very bright for Bitcoin, not so much for the US dollar. Using this as an opportunity to potentially buy I would think is certainly a reasonable strategy. Now are predicted RSI turning around, not staying below that 40 level. We’ve closed the week at 47.8. I don’t expect a huge run-up in Bitcoin this particular week, but I will be monitoring it very, very closely for picking up for buying on dips. Now, this big sell-off we’ve had here, you can see that’s coming down to 16,259. Nothing goes straight up and nothing goes straight down, guys.
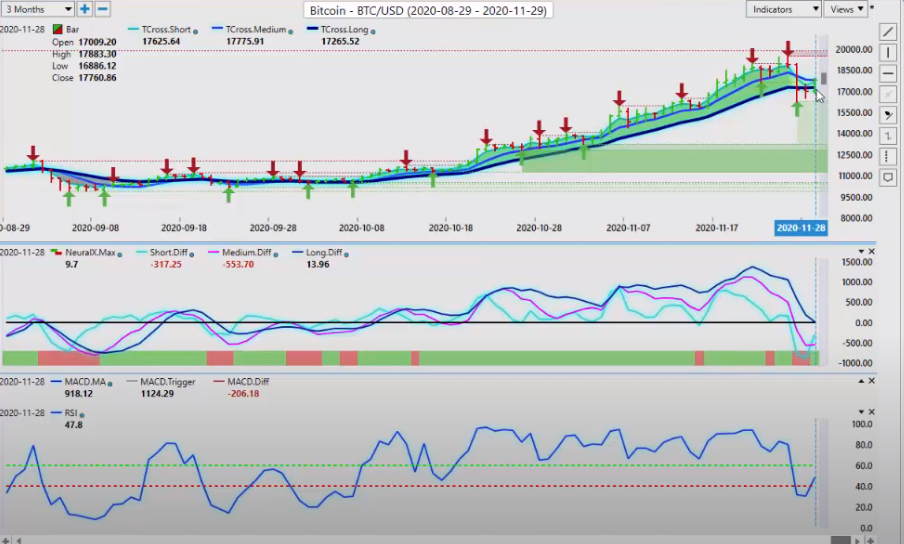
We have normal retracements. And you’ll notice how sneaky Bitcoin is, that it managed to close back up above the T cross long, our main pivot area. Now, when we click on our F8, you can see that we’re already after that big drop. And that, by the way, guys, a holiday short week in the US Thanksgiving. And in that US Thanksgiving, we don’t trust price. We don’t ever trust price on holiday short weeks. You’ve got some profit taking here. Now those same people that took profit are going to likely be looking to come back into the market.
So again, we will monitor that. But if we can get back up above the long-predicted at 17,735, then Bitcoin is likely back on its way to the 20,000 mark.
Euro versus U.S. Dollar
Now, as we come into some of our main Forex pairs, again, the euro, while not having a bad week, I wouldn’t really say it had a great week either. Towards the end on Friday, we got a big move up here on Friday. But once again, if we’re looking for places of value to buy dollars, going into a dollar cycle, then the euro would probably be a better bet than say the pound-dollar or Aussie-US or New Zealand-US, the ones that have high correlations to the S&P 500.
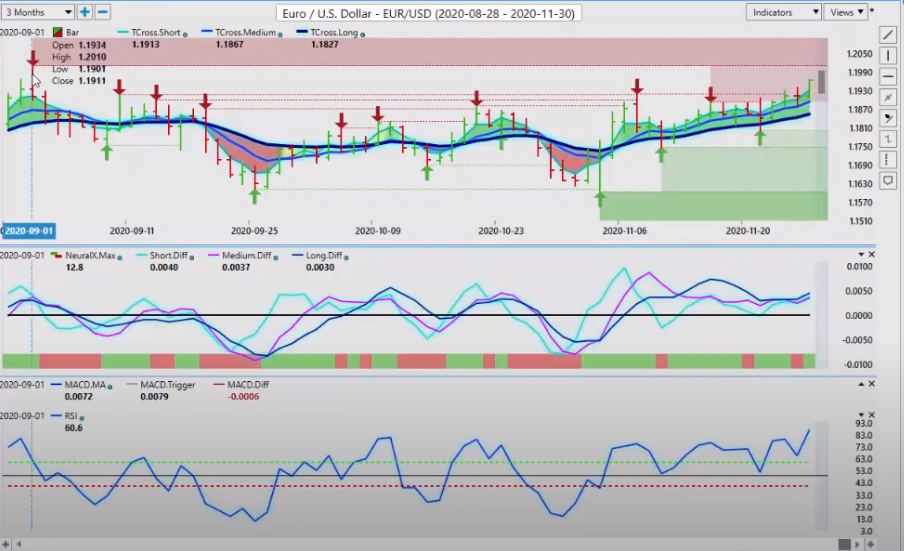
When we look at this right now, the euro really has done nothing since it hit the COVID high back in September of 120.10. Now, again, the euro has had a decent year, but largely because of the COVID virus. The euro, excuse me, following gold higher. It’s reasonable to suggest that if gold is done up here for a bit and it’s going to flat line and start moving lower, the euro would follow. Watch the 120 level to begin the week, but right now our main primary trend is indisputably still up while we hold above 118.55.
When we click on our F8, very important to monitor the long-predicted 119.02, so we can see that that predicted moving average is getting closer and closer to the current price. It’s just a matter of time here, guys, before it slips back below that blue line. So again, to begin the week and throughout the week using your Vantage Point software, make sure that you’re watching to see if the market can hold above 118.55, and more importantly, the 119.02 level.
British Pound versus U.S. Dollar
Now, as we look at the pound-dollar going into begin the week, the pound once again has had a very good run up basically on, in my respectful opinion, on euro weakness. What I mean by that is the euro-British pound cross pair has been under… The euro has been under pressure. It recovered on Friday. That sent pound-dollar lower. So understanding that the US dollar is not the only one in play here, euro-Great Britain cross pair, again, is a very important cross. If they want to buy euro-Great Britain, they have to buy euro-US and sell Great Britain-US.
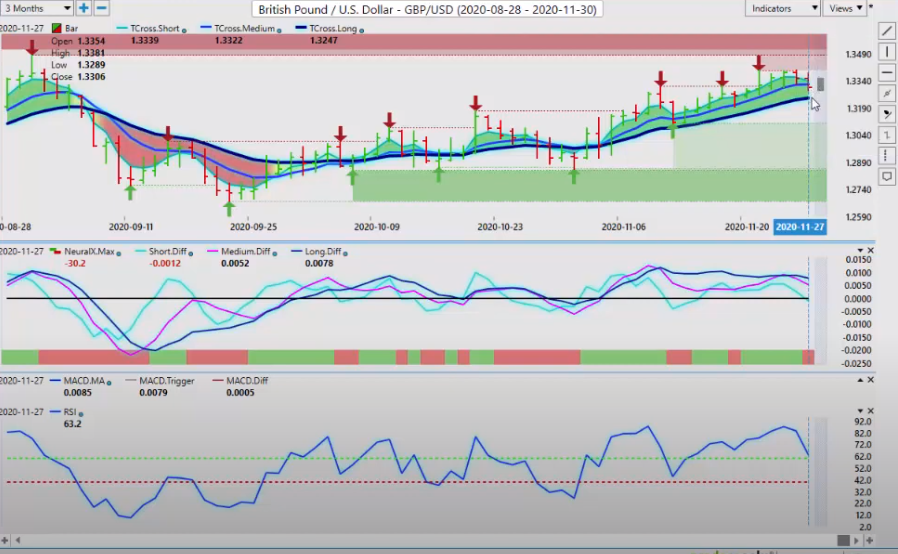
That’s how those cross payers work. So right now it would appear the British pound is in a corrective phase back down to the 132.47. I will also highlight that that is the yearly opening price of the British pound-US dollar pair. It is critical that the pound stay above 132.47. If it can’t, then, well, we’ve got a problem. Once again, the verified resistance zone formed at the beginning of the week, we haven’t really been able to get above Monday’s high. That’s what I find very interesting.
Once that high hits and we don’t make another one, the verified resistance goes across the screen and blocks us here at the high, which is 133.97. So in short, we must get back up above 130.97 in my respectful opinion quickly. And we also further need to hold above that critical T cross long, which you can see the T cross long, but more specifically, the long predicted 133.39. So watch this level at 133.39 very closely to begin the week here, guys. If we can’t get back up above it, you can see how the market is.
It’s been in constant contact with that Vantage Point predicted moving average. If it can’t stay above that line, guys, the general theory, above it we’re long, below it we’re short. So to begin the week, it does have a bearish… It is setting up to be somewhat of a bearish tone. Now, the dollar-yen made a bit of a run to start the week here. Once again, you’ve got to watch this Monday price action here, guys, because it can be frustrating for the average person.
Because you can see Friday, Thursday, Wednesday, Tuesday, Monday, big bull run up here and then it just does nothing the rest of the week. Monday often will be used as a fake price. So what I mean by that is it makes a push up or down, then on Tuesday, Wednesday, it just completely reverses. So like I said, with the dollar index, we’re one step ahead of the game. We’re looking for a big down move on the dollar on Monday, only for it to completely reverse the rest of the week.
U.S. Dollar versus Japanese Yen
What I suspect with the dollar-yen is we will move back into this lower part of the range at 103.68. And then mysteriously on Tuesday, there’s a high probability we turn around. So keep an eye on that right now, this verified support level, very strong, our medium term crossing our longterm predicted differences, warning us of further longs here. And in most cases, the yen is weak in that, again, the week of the non-farm payroll number, which is the first week of December. Next week.
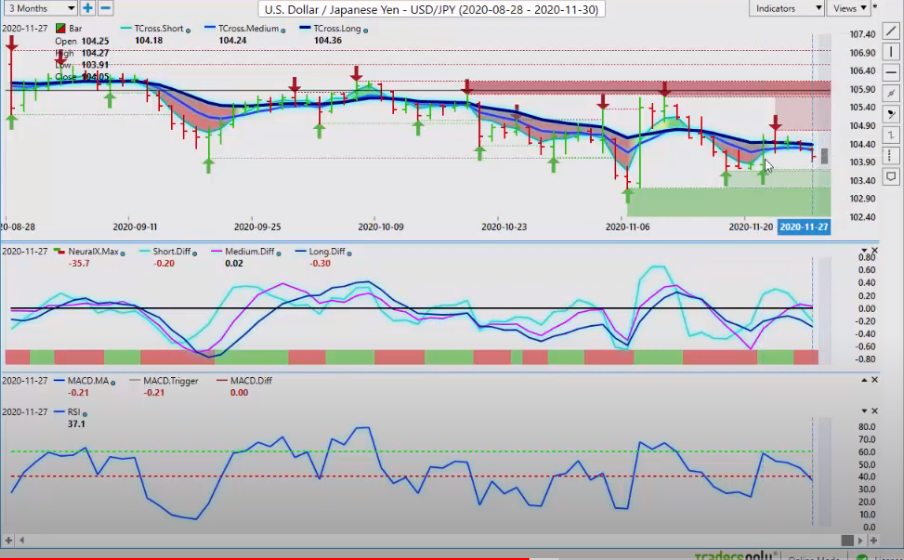
So again, watch this for a potential reversal higher until at least Thursday or Friday. Now, as we hit some of our main… Again, I used to call them commodity currencies. The CAD still kind of is, but they really are equity-based currencies.
Canadian Dollar versus U.S. Dollar
The CAD, the Aussie, the New Zealand, they’re going to follow the S&P 500, guys. As long as the S&P 500 is moving higher, the US-CAD is likely to move lower. But again, this week, the Canadian dollar, often the Canadian dollar feeds off of US dollar strength, because the two are the two biggest trading partners, the US and Canada.
So if the US is doing good, in most cases, the Canadian is doing pretty good. But the COVID cases in Canada are running wild. Lockdowns are back in place. I believe that this could hurt the Canadian dollar next week. So again, we will watch these critical levels. You can see that we have a buy signal trying to form here, the pink line crossing the black line. I’m watching that very closely, but we want that crossover to take place with the neural index. Okay, guys? I believe we will get that by Tuesday and a long set up.
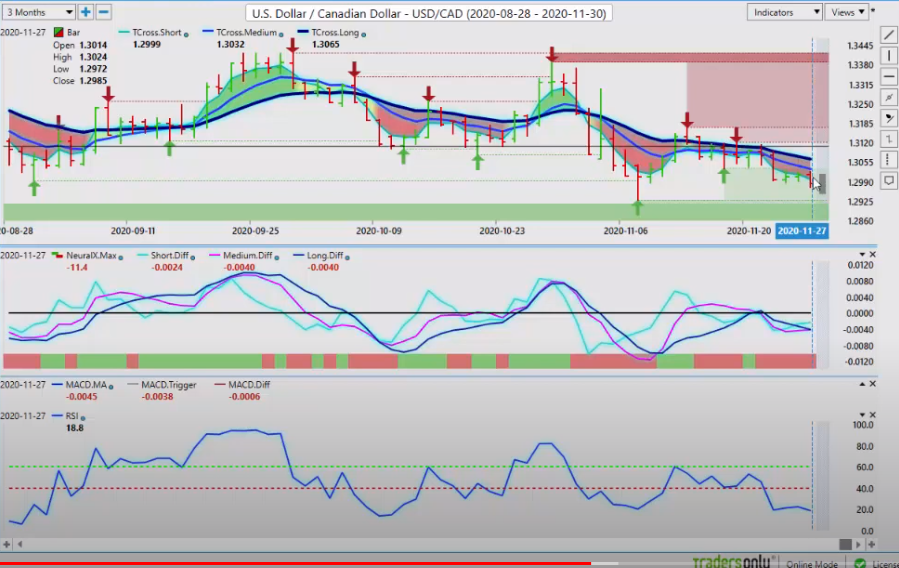
Now, we’ve got a big push low here down to the 129.29 area. But more importantly, around 129.85, we have the yearly opening price. So US-Canada really is at a make or break level here. It is either going to go significantly lower, excuse me, or we’re going to hold about the 129.50, 129.80, and this thing is going to go significantly higher. The first target on the upside, 130.65. But again, when we use our blue line by itself as a pivot level, we can see that the market is banging into this multiple times.
And if we get back up above 130.17, this is how we get close to price, guys. If we close above this level, then the pressure may be off the downside on US-Canada. It’s had a significant move lower from 134 down to where it is now. So again, we will continue to monitor that. But on a break of 137, this is a very easy play here guys. All we do is set up limit orders about the VP line of 130.17, say around 130.30, 130.35. And when it breaks and closes above this blue line, that will tell us that we are going higher.
Australian Dollar
Now with the Aussie and the New Zealand, again, I’m not expecting too much out of these two pairs next week. Virtually the Aussie-US and New Zealand-US is the same trait for the most part under normal trading conditions. So we’ve pushed above the yearly opening price on both payers. The key VP level to start the week, again, how we read our software going forward as this is an outlook, not a recap. We’re talking about what we’re doing next week right before the markets even open. When I look at this, right now I’m saying, okay, 72.93.
I’m trading up here. I’m closing at a 73.97. I’m about 100 pips, 120 pips from that key VP level. Then I click on my F8, come back down to the blue line by itself, and I can say, okay, the long predicted 73.52, we need to hold this particular level. What are the indicators saying? Well, we’re a little overbought on the RSI. MACD is definitely overbought. Also, when we look at this here, again, this screams of a corrective move here, guys.
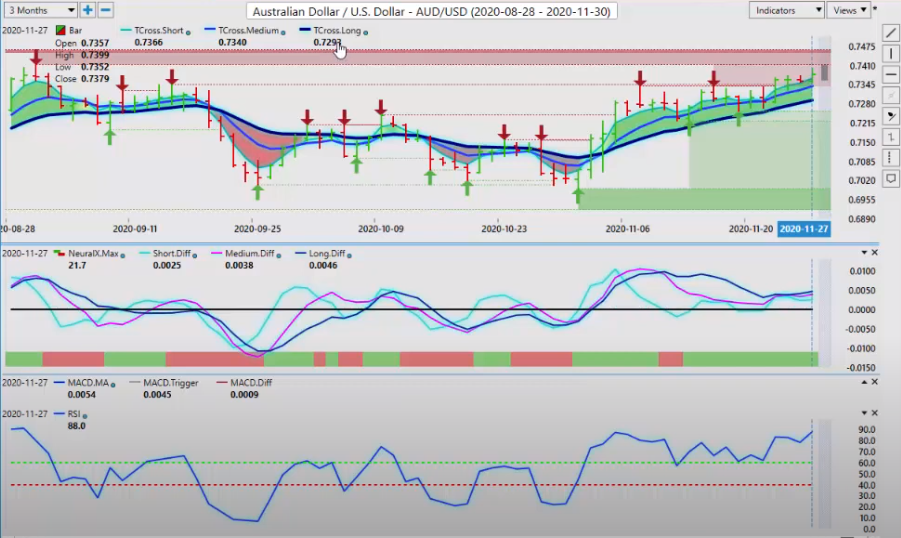
The beauty of the neural index is when we have a long green bar like that, that means that the neural index has been forecasting the market to go higher every one of these days. When that neural index goes from green to red, which I anticipate could be by week, then that’s a very fast easy warning sign that we’re going to at least have a corrective move lower. We can assess here. If we look at the New Zealand dollar and put it up against the Aussie, it’s the same thing here, guys, right?
We’re looking for the market, again, for that neural index to give us a warning that we’re going into a corrective phase. That could be fairly significant. With the close here of 70.20 and the T cross long at 68.95, remember what I said earlier in the presentation? The further we move away from the T cross long, the more likely it is we’re going to retrace to it. If we click on the F8, again, you can see using the Vantage Point software, using that blue line by itself as a daily entry point, it is a very, very powerful tool.
New Zealand Dollar
Right now, when we look at this, 69.85, we’ve closed the week out here at 70.20. Once again, we’re getting very close to the flame, so to speak here. And if we slipped below that blue line with the neural index, then we definitely are going to have a relatively easy corrective move on the short side. Now, once again, when we look at using overbought, oversold signals, we have to be very cautious.
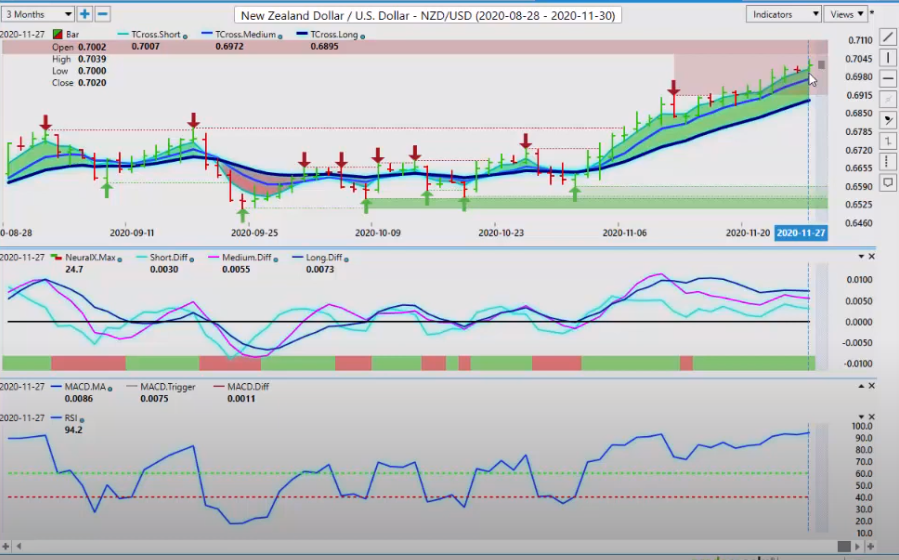
Because you can see whether it’s the RSI or accumulation distribution, whatever you want to call it, the reality here guys is that these indicators often go into overbought or oversold condition before the move has even started. It’s basically three days in, we get that. So again, we want to make sure that we’re not using the indicators separately. We want to use the blue line and gauge the strength of the market by using that predicted moving average. So with that said, this is the Vantage Point AI Market Outlook for the week of December 1st, 2020.
Are you using A.I. yet?


