


Welcome to the Artificial Intelligence Outlook for Forex trading.
VIDEO TRANSCRIPT
VANTAGEPOINT AI MARKET OUTLOOK
Okay, hello everyone, and welcome back.
My name is Greg Firman, and this is the Vantage Point AI Market Outlook for the week of December the 29th, 2025.
Now, this will be the final outlook for 2025. We’re looking to see if we have a Santa Claus rally potentially in place here. So, let’s get started.
Wisdom Tree U.S. Dollar Bullish Fund ($USDU)
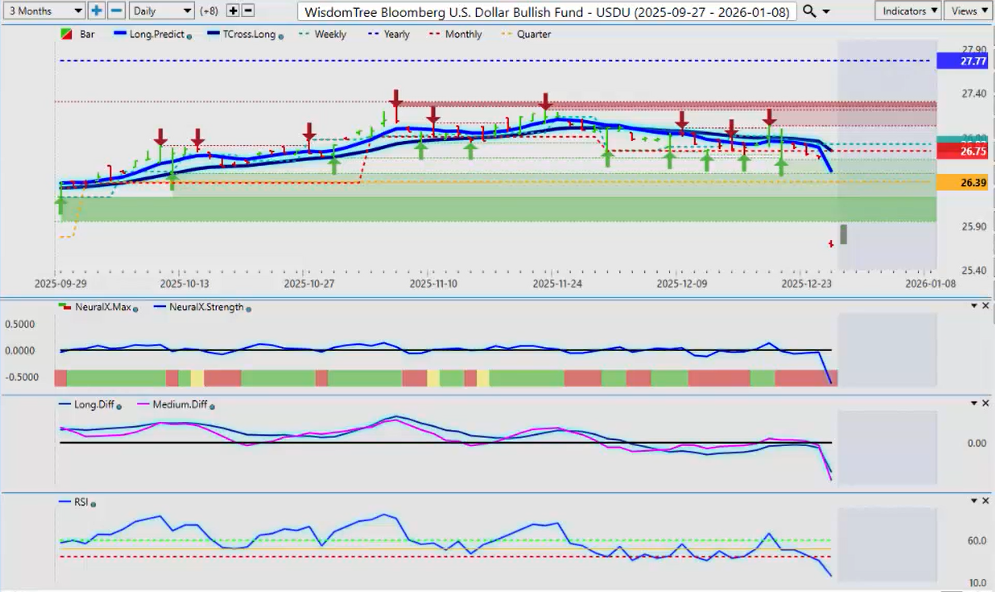
First thing we’ll look at is the U.S. dollar itself with the USDU ETF. Now, this one’s very interesting. The dollar coming under, again, significant selling pressure here as we round out the year, negative on the quarter. So, when we look back at this right now, my concern going into the final week of trading is a significant gap in downward price. Usually, that tells me that a move is coming to an end very soon. When I look at the bull fund, the same thing: we’re holding below the previous week’s weekly opening. So, again, some signs of dollar strength here. The data coming out of the U.S. is very, very strong—the CPI coming lower, GDP blowout number, I believe it was over 4%. So, again, the media continues to push the narrative that the Fed has to cut, when in actual fact I really don’t think that’s the way this is going to go in 2026, but we’ll see how it plays out. But for now, there’s a very significant gap between where the market is closed and our TCross long. That’s all the way up at 27.68. So, not exactly super bearish here—uh, a retracement, if nothing else, to the mean. The mean revision between the TCross long and the long predicted seems imminent at this particular time.
Gold
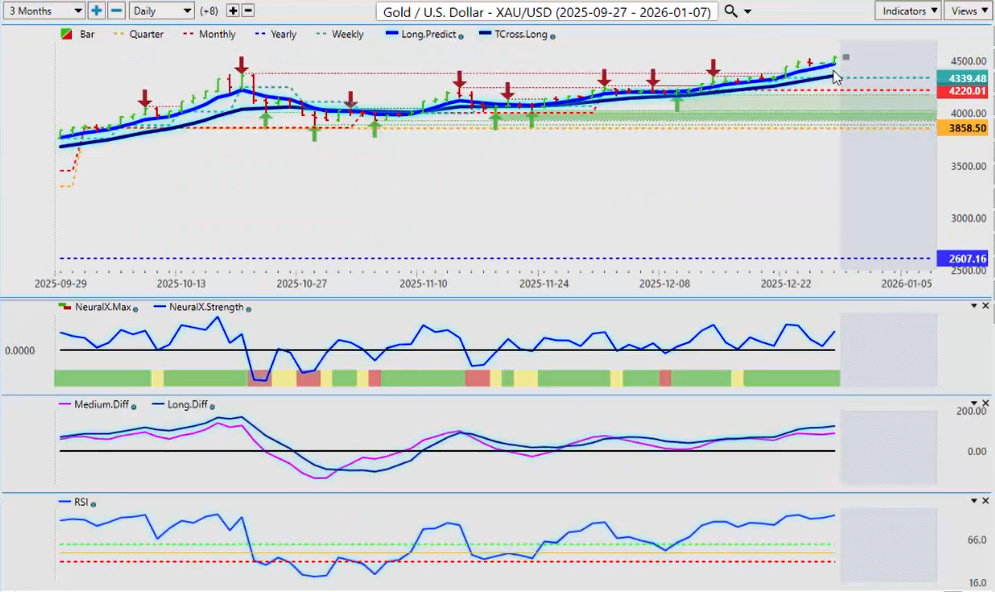
Now, when we look at Gold going into the final stages of 2025, gold always does very well in the month of December. But silver is actually outperforming gold here. Both are still looking pretty good. My concern here is we’re going to get into some profit-taking for some of the trading for next week, but really our focus does shift to 2026 as we leave 2025 behind. But a very, very strong year for gold for the final week of trading of 2025. Keep an eye on your TCross long at 43.60. I believe we will retrace back down to this particular level, and gold is likely to struggle a little bit after this very significant rally.
Silver is actually outperforming gold here, but both are still looking pretty good going into year end.
Bitcoin
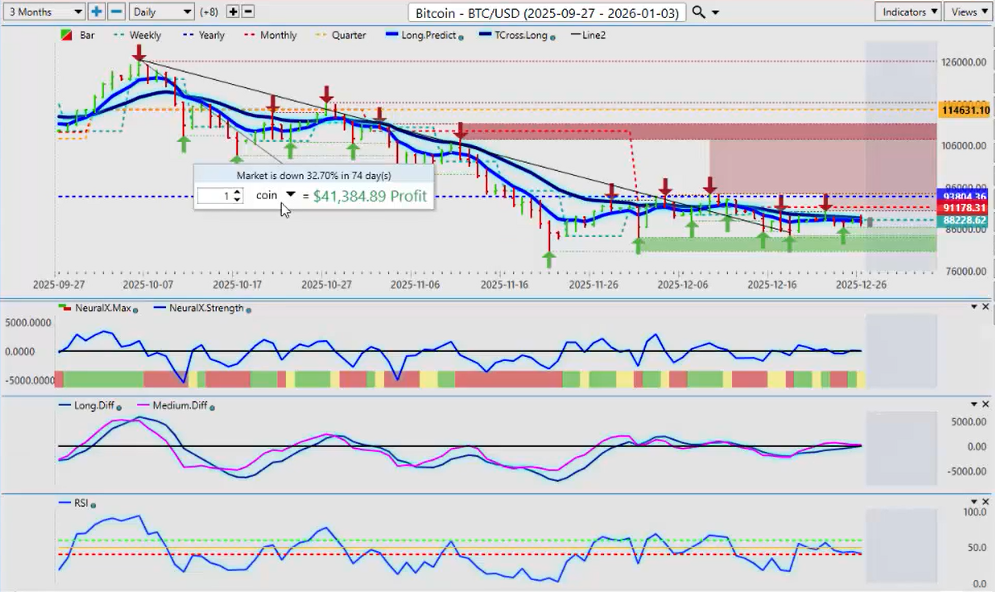
Now, when we look at Bitcoin finishing out the year here, we’ve had a significant move down from October to present day. And, in my respectful opinion only, this is the move I would have been looking for in 2026, not 2025. So, again, we’ll see how this one plays out. But right now the signal is actually somewhat bullish on the VP side. We’re below the TCross long, but we just don’t have any sellers below these most recent lows around 83,980. The lowest point we’ve got here is 80,742, which is consistent with December seasonal patterns. But again, right now, for this coming week, the TCross long is the one to keep your eye on—88,648. Can we get back up above that? That is the area you want to watch very, very closely the entire week right into Friday of next week. So, again, the question is, can we get above that? The VP indicators are medium-term crossover, long-term crossover. They look like they are trying to move to the upside, and the predicted RSI is showing no downward momentum at the current time. So, again, we could see some bullishness coming out of Bitcoin going into the latter part of the week.
Volatility Index ($VIX)
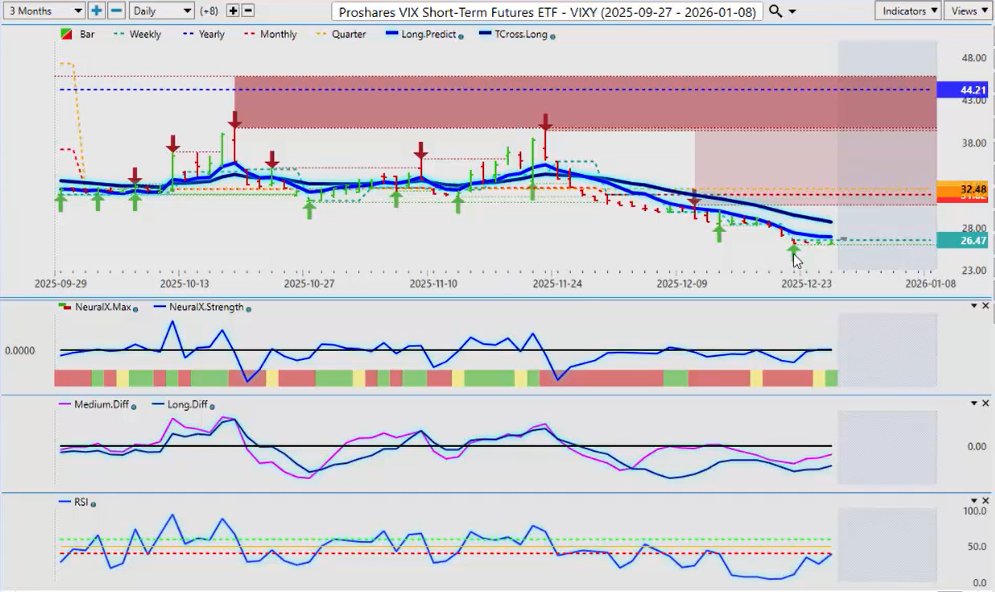
Now, when I look at this week, I’m going to start with the actual VIX to see where we’re actually at here. So, the VIX this entire prior week has remained below the TCross long, below the long predicted. It’s even held below the weekly opening price for pretty much the entire week. So, the indicators here are still dead flat on the VIX. That is somewhat of a green light here to buy stocks.
SPY
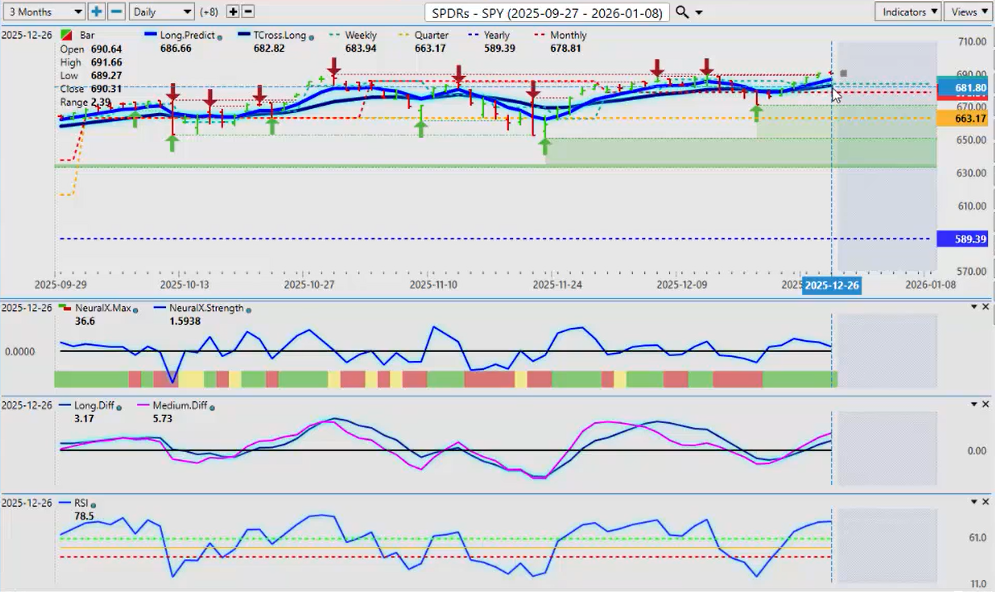
So, from here, we want to move in and look at some of these indices via the ETFs. The SPY right now has recovered. We remain above the quarterly opening. SPY is looking very, very good here. The monthly opening price is coming in at about 678.881. Our TCross long is at 682.82. So, all of our support is sitting right there. Structurally, the monthly opening, the quarterly opening, the yearly opening price—the trend is clearly up here. So, the probability that we get stock buying into the end of the year is very high.
Global X DAX
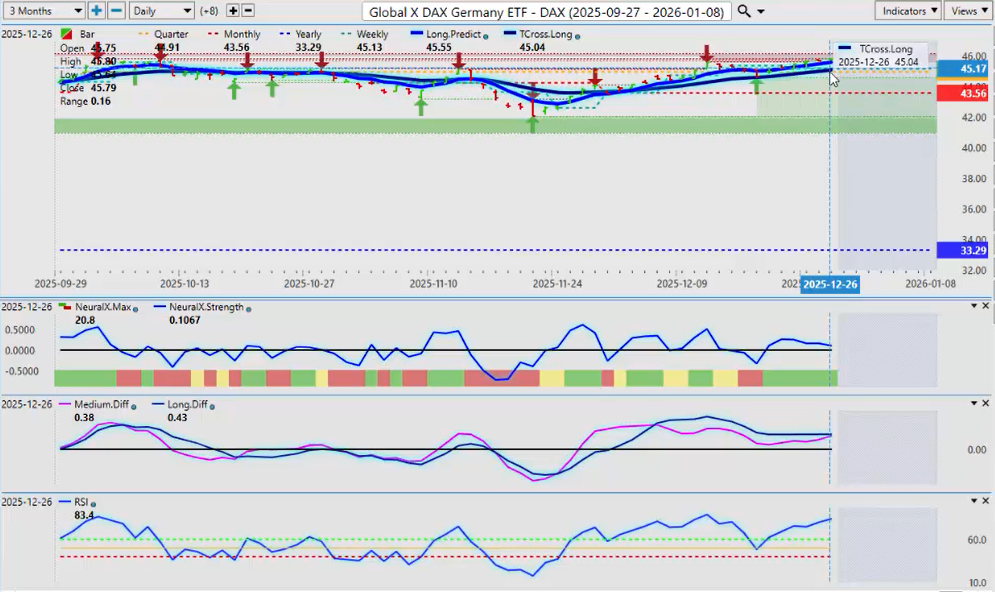
If I look at the Global X DAX, again, we’re only looking at one ETF when it comes to the European equities, and it is the Global X.
I explained last week that it has grossly outperformed the futures contract. We’ve had much smoother price action. So, again, if you are trading DAX futures, you should be looking at this ETF because it is a leading indicator with the volatility on the futures side.
So, for now, we remain very positive on the quarter, on the month, and on the year. And another buy signal is actually forming right now.
That pink line here—we’ve had our retracement lower. You can see that we’ve hit the TCross long right there to the number. And I will point out again, the futures blew through that area, and it was a false signal to the downside.
The ETF—very smooth. And again, it’s the same trade, guys. No matter how you look at it, it’s the same trade. This is just much smoother. It’s outperformed the DAX futures.
So, for now, for next week, our TCross long, whether you’re trading the DAX ETF or the DAX futures, it doesn’t matter. It’s the same trade. This one’s just smoother.
So, the TCross long, 454—
As long as we’re holding above that, you’re free and clear to buy the DAX futures.
The other interesting point about this particular week from last week—we’ve now got the TCross long above the quarterly opening price. That is a whole other potential bullish signal forming.
We just need to hold above that. And that quarterly opening price comes in over here. As you can see, we’ve closed the week at that particular level, which is about 45—we’re closing out at 45.29.
So, that’s where our quarterly price is just below there at 44.91. As long as we can hold above that and our TCross long, everything looks good.
QQQ
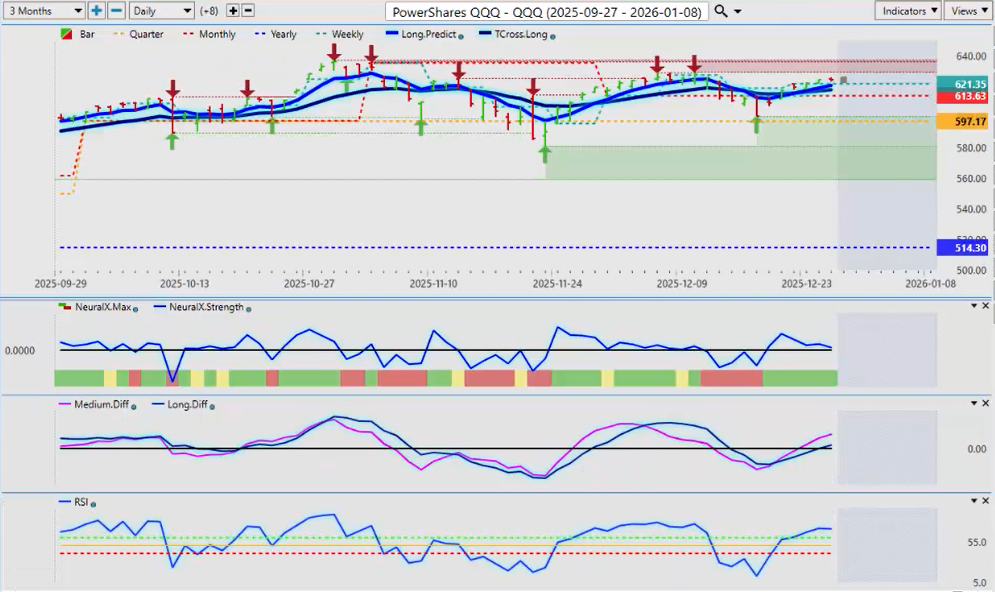
All right. Now, when I look at the alternatives to this, when we’re looking at, again, focusing a little bit more on the equities going into year end, if we look at the QQQ, they’ve retaken the monthly opening price.
So, we look at the structural bias of this market from a price action standpoint. We’re positive on the year, positive on the quarter, positive on the month, and we finished the week above the weekly opening price.
That looks pretty good going into year end. So, we just have to identify those support levels—the quarterly at 597, monthly at 613.
Yearly is not in play here at all, in my respectful opinion, but the TCross long is 617. That’s the area, the key level we want to make sure we’re keeping an eye on.
IWM
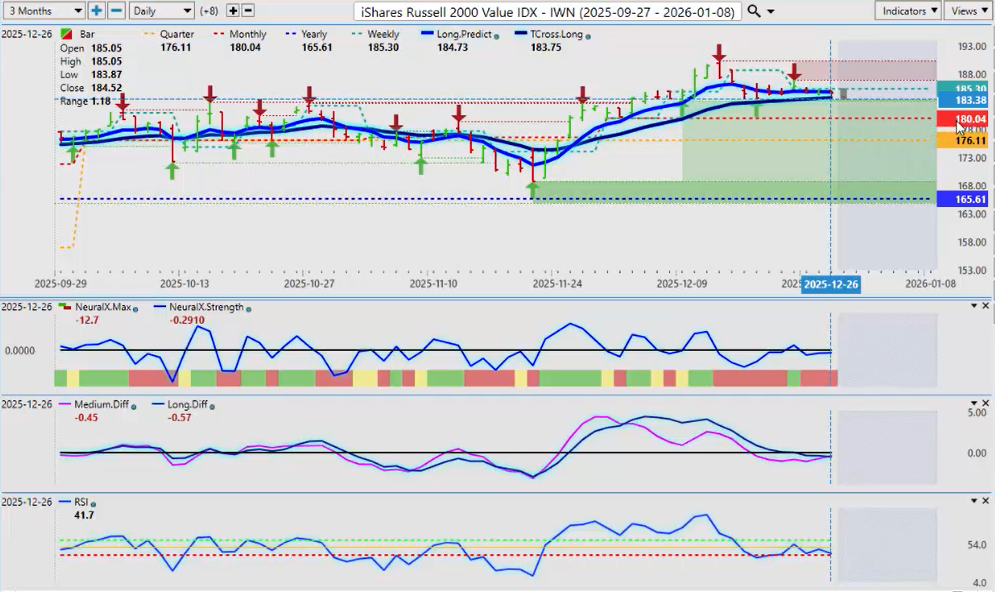
And, of course, the IWM—the Russell—looks very interesting going into next week.
So, again, we’re right just slightly above our TCross long at 183.75 on the IWM. So, again, we look at the structural bias of the market, and they’re stacked up very nicely, with the monthly at 180, quarterly at 176, and the yearly at 165.
So, that structural bias then leaves us at the TCross long at 183.75.
Now, on top of all this, we have an MA diff cross that is occurring right now. We have no downward momentum on the predicted RSI. So, it’s looking pretty good across the board for the global equities going into year end.
United States Oil ($USO)
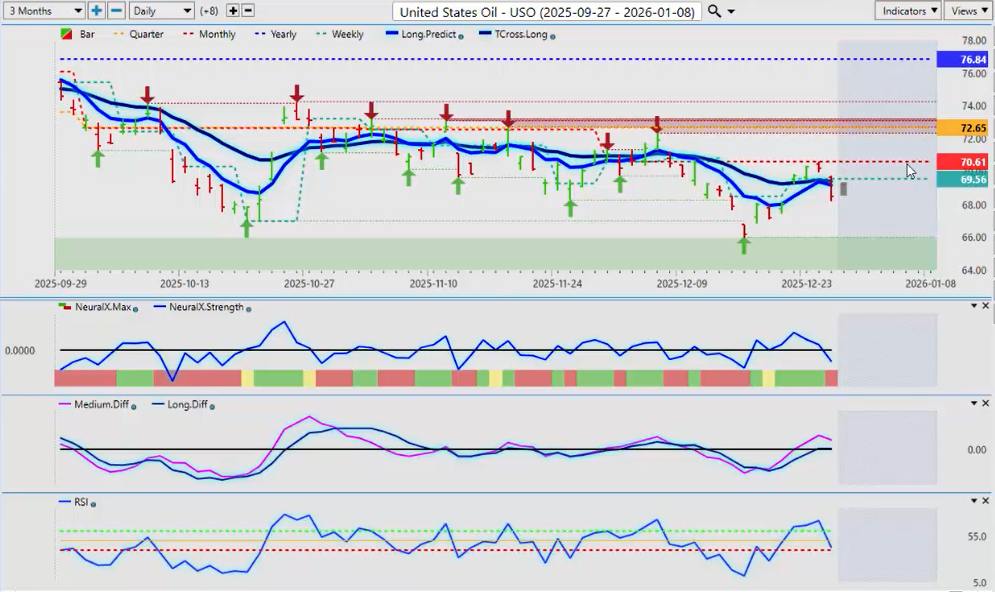
Now, when we look at Oil, one of the main commodities we should keep our eye on, we’ve had—this is why the monthly opening, something as basic as a monthly opening price, is very important because it tells—it shows us more than most people will ever realize—that we need to clear that monthly opening price to really turn bullish.
But again, negative on the year, negative on the month. But I do believe oil longs will be quite good in 2026. Probably not until about the mid-February area, but for now oil is holding in there, and longs are slightly favored over gas.
Euro versus U.S. Dollar ($EUR/USD)
Now, when we look at a couple of forex pairs going into next week, I don’t think we need to look at too many at year end, but we do want to keep an eye on the euro.
That is basically 100% inversely correlated to the dollar index. So, one way of measuring the entire G7 forex pairs—Euro U.S., Aussie U.S., U.S. Swiss franc, Great Britain U.S.—all these have one thing in common: they’re trading against the U.S. dollar.
So, right now, one of the easiest ways to measure broad dollar strength or weakness is to look at the EUR/USD forex pair.
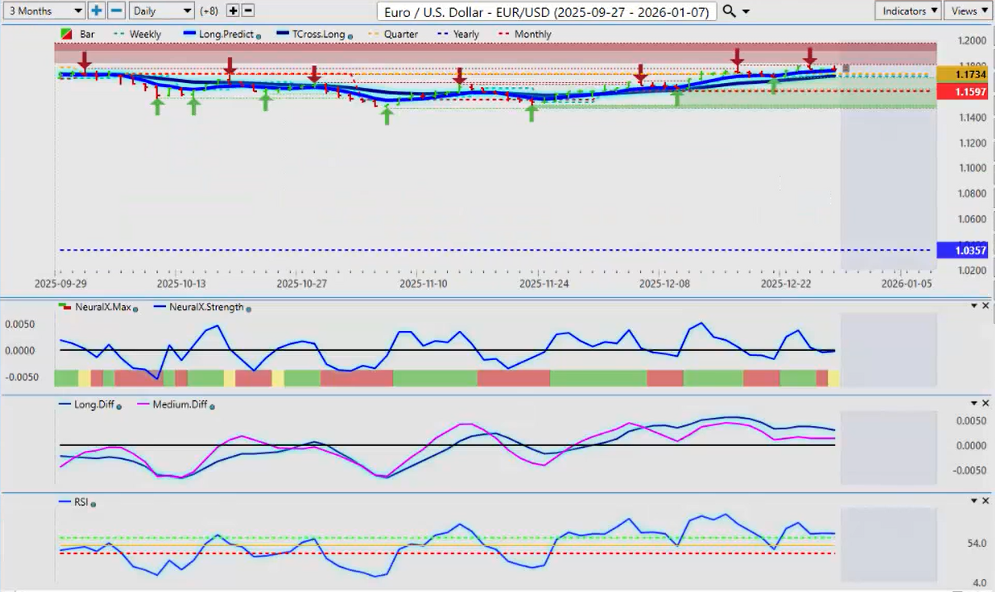
So, for now, again, structurally we are looking very strong here going into year end. Very good year for the euro, holding above the yearly opening price the entire year at 1.0357, the monthly opening price at 1.1597.
And to end the week, we’re holding above the quarterly. But as I had started off this presentation, that dollar index is a little bit concerning—that big push down we’ve had.
And it’s to each their own how we interpret what the Fed is going to do or not going to do. But if we’re still doing what we’re supposed to be doing, which is focusing on the economic data showing the U.S. is actually a powerhouse here, with a very, very strong GDP number coming out.
The unemployment numbers are a little bit soft there, but that could change going into 2026. So, I don’t believe the Fed is going to cut any more than once or twice, but we will have to analyze it on a month-over-month basis.
So, for next week, the TCross long, 1.1718—that’s our retracement point—but the quarterly opening price at 1.1734, that’s a big level. We also have the long predicted at 1.1763.
So, the beauty of the software here is we can identify whether we want to buy or sell, but we can identify critical price points. And we can use the correlation of 31 other markets when using the neural index, the neural index strength, the predicted differences, and even something as simple as the predicted RSI with a 60/40 split.
It really does tell us: do we have downward momentum? No, we don’t. Not at the current time. So, again, we’re running kind of sideways here.
I’m not expecting a big blowout to the upside in the euro to finish year end. I think we will retrace a little bit down into this lower mid-17 area.
But if the market believes that the Fed is going to have to cut multiple times, then euro longs will do well again in 2026. But my optimism on that at this current time remains heavily, heavily guarded.
British Pound versus U.S. Dollar ($GBP/USD)
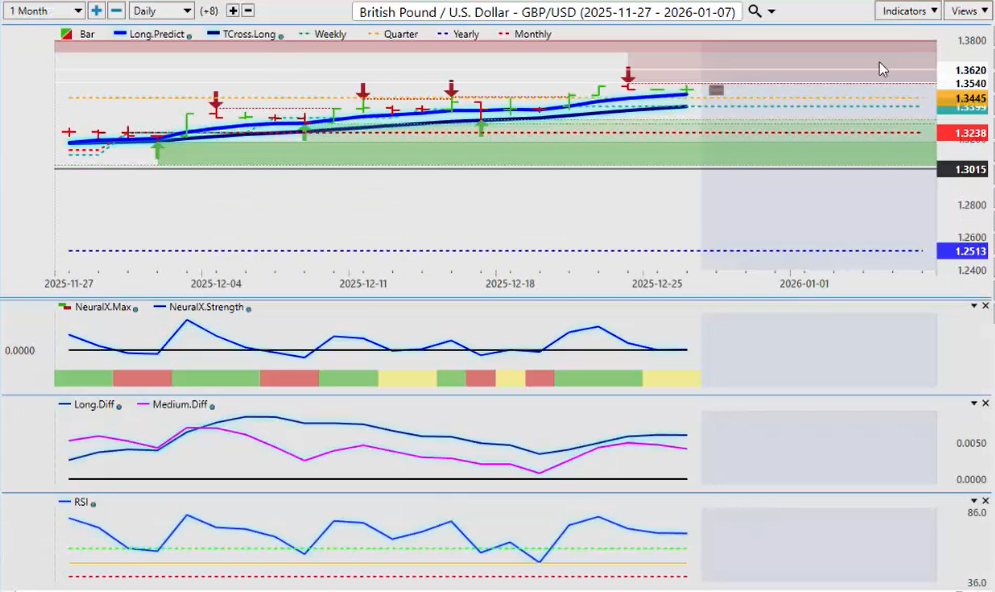
Now, the GBP/USD for next week—we can see that we’re structurally, again, it looks very good. Positive on the year, the month, the quarter, and the week.
So, our TCross long is our main area for next week, 1.3396. The indicators are a bit mixed on this one. A little bit sideways on the neural index, but that is showing correctly, I might add, that it’s hit a top there and it’s slowly grinding lower.
But this is a retracement, guys, not a full-blown trend reversal. That’s why we have these additional levels to measure the strength in the market.
So, again, the pound is holding in there, but there are signs of weakness there. So, keep an eye on your neural index strength this coming week.
U.S. Dollar versus Japanese Yen ($USD/JPY)

A lot of eyes in 2026 are going to be on the USD/JPY. And when we look at the dollar yen right now, we tried yet again to push above and turn positive on the year, but we haven’t been able to do that.
We’ve come right back—our mean revision to the TCross long to the number. We did not close there. We held on two levels. Then we had actual buyers coming in on Friday, pushing it back up.
But that yearly opening price at 157.28—that is the key level to keep your eye on until the clock turns over to 2026, because right now that is a critical resistance point.
So, if we remain below that and we break down below the TCross long, there is going to be a much bigger sell-off. And if the market believes the Fed is going to have to cut—which I personally don’t—then that’s going to be a problem for the carry trade.
If it starts to come unwound in 2026, the dollar yen can fall very, very quickly. So, be careful of this one. It’s going to be volatile. But at least for now, there isn’t a lot of downward momentum.
U.S. Dollar versus Canadian Dollar ($USD/CAD)
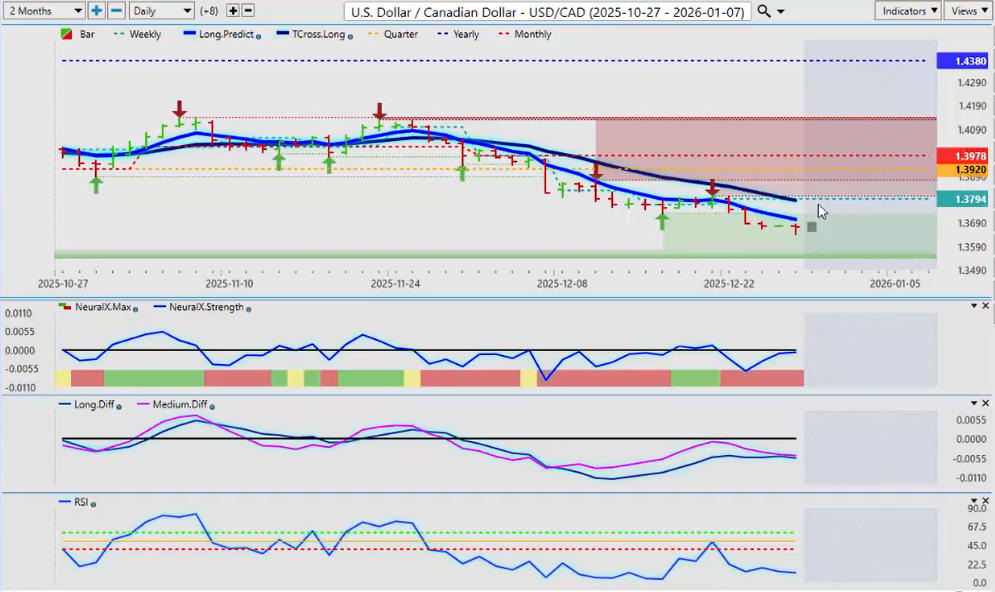
Now, the USD/CAD pair—I will do one more after the U.S. Canada pair—but for now, this is basically we’re holding below the yearly opening, the monthly.
And realistically, there’s very little reason to be buying Canadian dollars at this particular time. But there may be a light at the end of the tunnel if there is some kind of trade deal between the U.S. and Canada as Carney meets with Trump next week.
So, keep an eye on the headlines with this, because if some type of trade deal comes out of this, that could be positive for Canada. But I don’t think that’s going to happen. I don’t think anything is going to come out of that meeting.
So, we’ll see. But keep an eye on it. That’s the event risk for next week, along with, of course, the FOMC minutes.
I believe that FOMC minutes could be the trigger that turns the dollar around, because I further believe there are going to be dissenters in there that are going to say, “We’re not on board with rate cuts. The economy is moving along just fine. Rates are going to stay where they are.”
So, the minutes is what we really need to see, because when they do the Fed announcement, they’re simply telling us—Powell is giving us his opinion. He’s talking about what he thinks.
No, I want to hear what the FOMC panel, the board, thinks. And I don’t think they’re in agreement with him.
So, we shall see on this one. But for now, I definitely could see U.S. Canada retracing back to the TCross long next week at 1.3787.
Australian Dollar versus U.S. Dollar ($AUD/USD)
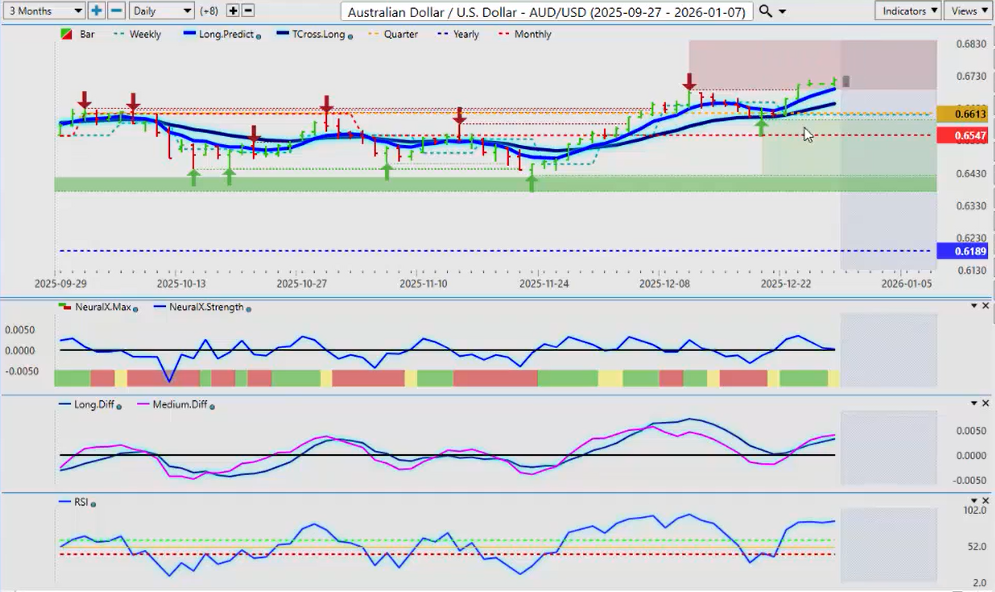
Now, on the Asian-Pacific side, I will do the Aussie, and that will be it for this year. So, we’re looking at the AUD/USD.
Now, this is a very interesting way of looking at what a mean revision really looks like using the predicted moving averages. We move higher. We hit a point like this. The market comes back down between the long predicted and the TCross long, hits the TCross long while still above the monthly and the yearly opening price.
And then you can see we just simply have no sellers here, and up it goes again.
But here’s the deal, guys. If that Fed minute—if those Fed minutes—say what I suspect they’re going to say, that there’s a crack in the dam inside that FOMC, plus you’re going to have a new chair in 2026, so a lot to think about going into year end here.
But I believe the Aussie will have—and the Kiwi will have—a pretty good year in 2026. But again, we first need to get through and finish 2025.
So, with that said, this is the Vantage Point AI Market Outlook for the week of December the 29th, 2025.


