


VantagePoint AI Market Outlook for the Week of December 7, 2020
VIDEO TRANSCRIPT
U.S. Dollar Index
Hello everyone, and welcome back. My name is Greg Firman, and this is the VantagePoint AI Market Outlook for the week of December the 7th, 2020. Now, to get started this week, we’re going to begin where we always do, with that very important US dollar index. When we look at this, we would normally expect dollar strength at the end of the month into the first week of the new month, approximately. I’m not going to split hairs here over specific dates.
What we’ll do is, what I’ve done here to field some of the questions is that I’ve put up a chart here of the entire calendar year of 2020. We can see on January the 1st, 2020, we rallied on the 5th, the week, a very strong rally in the dollar. February the 2nd, the same thing. When we look at March, the rally started on the 8th. Again, I’m not going to split hairs guys, over one or two days. I’m telling you, in most cases, around the beginning of the month, the end of the month, you’re going to see some sort of dollar buying, and it’s usually significant. We can assess here on March the 29th, it happened again. The end of the month into the first week of the new month or so. Then we look at this again going into May. May the 3rd. Essentially, then June, we can see here, June the 7th, so again, a calendar day, seven days, but again, I don’t want to get into splitting hairs, guys. When you look at this, the first half of the year, this is basically almost 100%.
When we look at July and August, if you’ve been in the VantagePoint Live training room, I’ve also discussed that there’s three months in the year where basically the signal is not usually there. That’s July and August because we have thing illiquid trading, and usually the month of December is a wildcard also. Now, if we look at this again, coming out of summer trading, we can see. September the 6th, we had a significant rally in the dollar. In October, on the 11th, that was delayed a few days. Not rocket science there, guys. The US election, right? We didn’t know which way this thing was going to go, so, again, you got that volatility, but once it started to smooth out, away it went. Then again in November on the 8th. So again, we’re looking at around, you could even clarify this if you want between the 29th and the 8th, you should expect some sort of dollar strength. The charts support this. This is crystal clear in this here, but again, I don’t want to get into splitting hairs over one or two days. If you look at the volatility we’ve had in 2020, with COVID, with lockdowns, with all of these things, I’m actually shocked that it actually held this well, considering.
As we move into trading here, and the final point I’ll make on this too, if we look at November, on November the 8th there, and, again, you can see this. The week prior to that, you had this huge down move in the dollar. This bar, from this previous trading week, looks almost identical. This has taken a big hit down for a number of different reasons. Of course, the COVID, but mainly you’ve got the Powell testimony on Monday and Tuesday that absolutely kills the dollar. So again, once that wears off, or is this just a setup, and what they’re doing is they’re getting everybody going the wrong way, they get everybody pouring into dollar shorts only for it violently to whipsaw right back up.
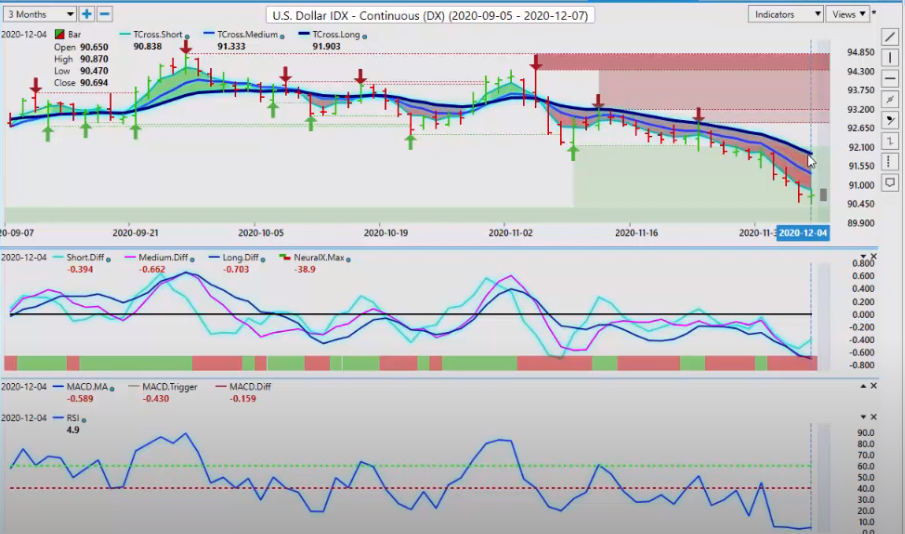
We’ve come out of the non-firm payroll number on Friday. In my respectful opinion, it was not that bad of a number at all. The U6 number is going in the right direction. It’s going down. Again, I’m not going to split hairs over the U3 number. It’s a survey number. The U6 number is the one we’re looking at. The unemployment rate is moving lower, but again, this is, once again, somewhat of a self-inflicted wound here, with these lockdowns. When we look at the current week going forward in the dollar, if the dollar was going to bounce, then it would likely be this week. There’s a very week by signal trying to form on the medium term crossing the longterm predicted difference. The neural index, however, is still down.
When we look at the predicted RSI, it virtually has nowhere to go here, guys. 4.9. Once again, I think that if I was a dollar bear, I would probably be taking profit here, expecting some kind of debt, even if it’s just a debt cap bounce. There’s likely going to be something. The T-cross long, 91.90. That’s our retracement point, but if we click on our F8, this is the hot zone, right here. The blue line. 91.17, so at the very least, the likelihood is we’re going to retrace back to that particular level. Whether the dollar can get on more of a sound footing, that’s left to be seen.
When I look at this selloff and the rally, what I find interesting here is that, on a huge dollar selloff on the week, showing you that bar for the week, not getting all tangled up with hourly and 15 minute timeframes or even the daily, look at how it did on the week. Very poorly. This is a classic, one of the most powerful by signals you will see in the VantagePoint software in my respectful opinion only. When the medium-term crosses the long-term predicted difference with the neural index. We put in a verified support level and then up we go.
GOLD
But again, what I find very interesting here is that, despite extreme dollar weakness, gold was unable to break the key VantagePoint level, which is 18.52. This was a very powerful support level for months and months and months, and there it is right over here guys, to see. 18.54. So we’re coming right back up.
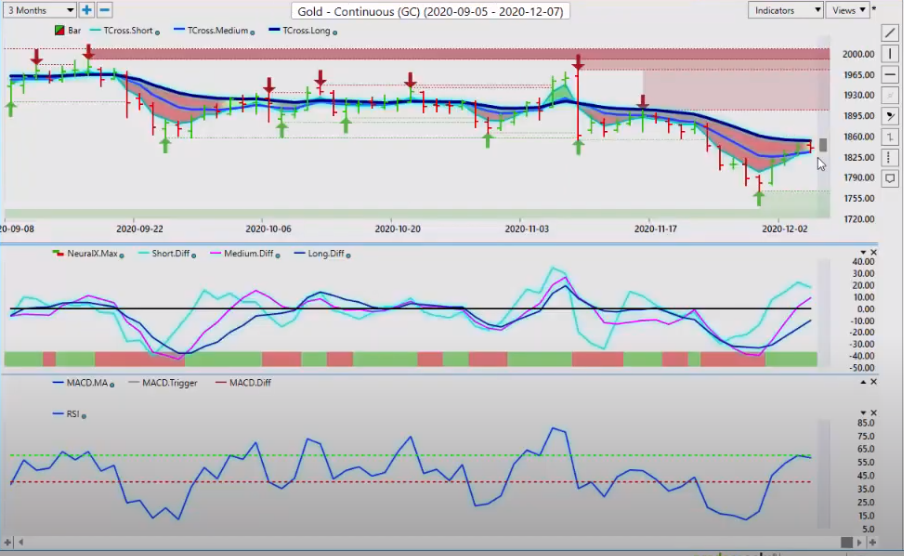
This week will be a make or break level for gold, to see if it can push back up above here and get more into bull territory. My optimism on that at the current time remains heavily guarded. Now that we’ve got the vaccine, or they’re telling us we’ve got a vaccine, the risk off trade is not really, the things that have been fueling the gold rally, they’re starting to very slowly be dealt with. Whether gold, like I said, to start the week, if gold is going to fail, it’s going to likely fail just above this T cross long at 1852.
S&P 500 Index
Now, the equity markets continue to scream higher here. When people talk about a Santa Claus rally I’ve got to kind of laugh. I think Santa’s been around for a very very long time on this particular rally. When we look at the S&P over the calendar year, this is, once again, this is quite the rally, I must say. Very, very impressive. We had the big COVID selloff right here, back in February. Down we go, and then we’ve been basically going up ever since. Again, when we look at these charts, nothing goes straight up and nothing goes straight down, guys. There’s retracements inside these broader trends. However, for now, again, a Santa Claus rally here wouldn’t surprise me, but once again, the stocks are getting a little overdone here, but obviously shorts, very problematic.
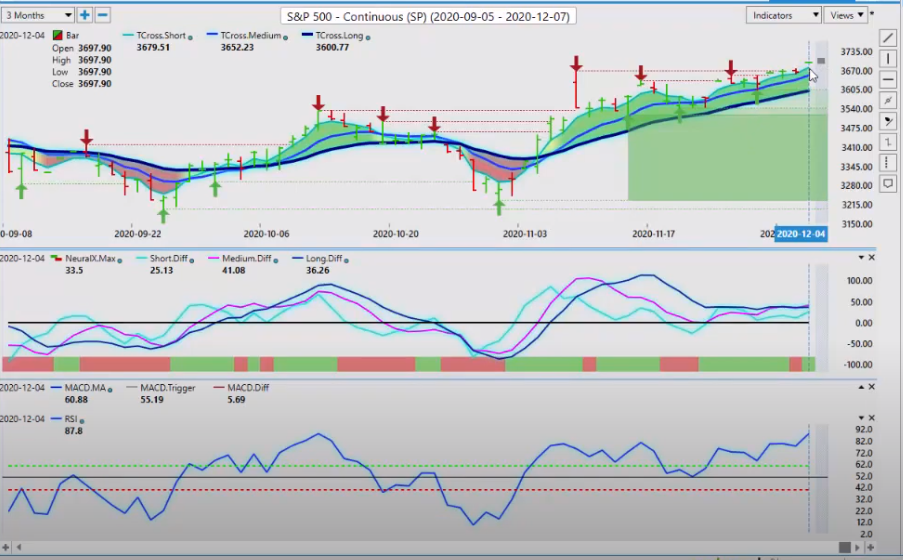
What we do here with the vantage point software is we look for key levels to hold above the T cross long, which is 3600. When we click on our F8 in our software, our next pivot level comes in at 3656, so if this rally is going to continue, we want to make sure we’re holding above those two particular levels. Our predicted differences are firmly up. The RSI is in a little bit overbought territory, but don’t let that spook you for now. As long as we’re holding above this key predicted moving average, it’s likely going to higher.
Crude Oil
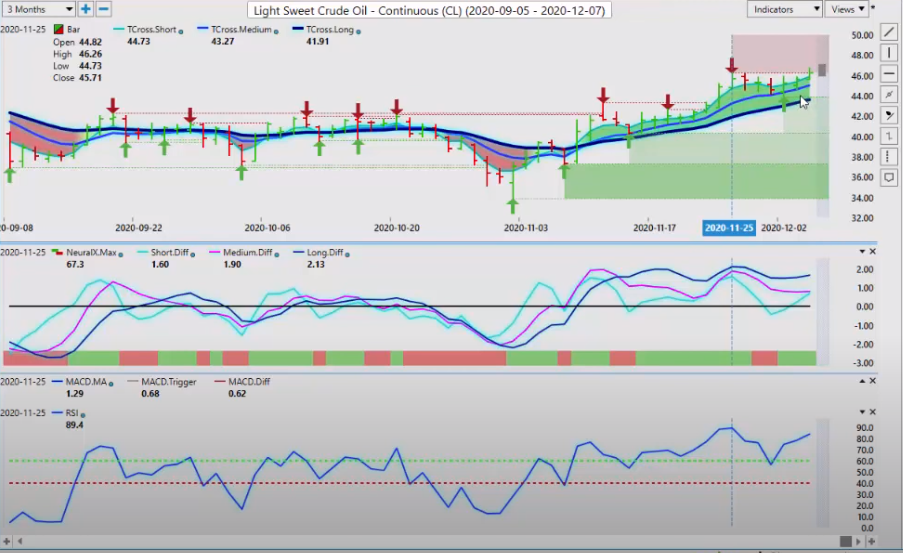
Same as light sweet crude oil here, guys. This is basically an equity trade, but if oil is going to fail now, we’re putting it in a top here for the entire week, and despite that dollar weakness, oil really didn’t do that much this week, did it? It just kind of hovered around this verified resistance high at 46.26, and you can see it struggling to try and close above that, so we’ll continue to monitor oil contracts, but this is normally not a time of year where oil is overly strong to begin with, so I do believe that it’s simply latching onto the equity rally, and if the equities take a breather, sell off a bit, then oil is more than likely going to follow.
Bitcoin
Bitcoin has had, again, a heck of a week. You can see we’ve had a retracement, then we’ve rallied back off this key T cross long here. That rally started down at 17.265. I’ve been a very, very strong advocate for bitcoin. Is it a reserve asset or a reserve currency? I think it may be, or it may be moving in that direction. All I know is corporations, along with individual traders, are pouring into bitcoin. It’s becoming more legitimate. Right now, very stiff resistance up here, there’s no question about it, up around this 20,000 mark. We keep flirting with it. I think it’s just a matter of time before we take this level out.
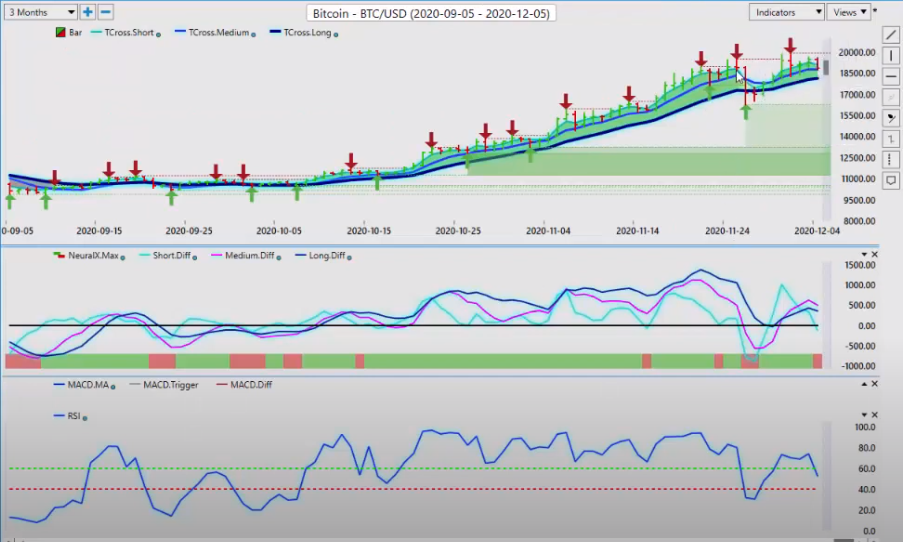
For the start of next week, the T cross long 18,123, but, more importantly, when we use our blue line by itself, the predicted moving by itself, by clicking on the F8, you can see exactly when this rally, it started back up. As soon as we overtook this blue line, we then used that blue line as a daily pivot level to get back into this particular trade. So if we close below this two days in a row, then bitcoin could suffer a slightly deeper correction, but, once again, not a lot of momentum in selling. 52 on the predicted RSI. The predicted differences are starting to roll over a little bit with the neural index, but, again, watch that 18,889 and see if we can hold above that particular level.
Euro versus U.S. Dollar
As we look at some of our main forex pairs, obviously on that Powell testimony, the printing presses are firing back up, the Euro feeding off of that. But again, I think the market is, once again, we look for places of value if we are going to buy something. Right now the T cross long is 119.55. You can see that we’re actually starting to get a little bit toppy up here. That payroll number, again, don’t let the talking heads tell you it was a bad number. It was a decent number, and remember, next month, that number could be revised upward. The previous month can be revised. So we always look at the U6 number in the unemployment. It’s not like the Euro zone is in any better shape than the US. In fact, one could argue they’re in worse shape.
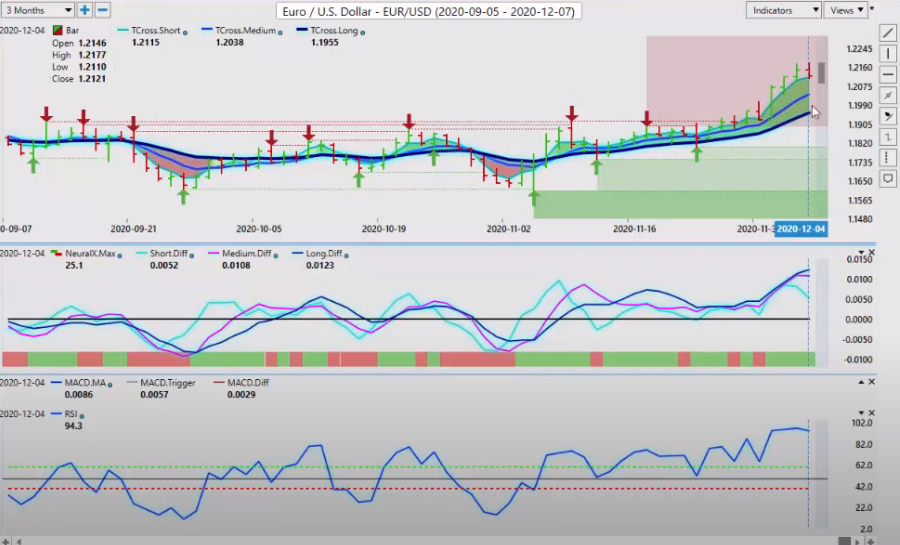
So, if I look at this, our predicted difference, this is not a cross, but you can see that the medium-term predicted difference is flattening out and it’s breaking away from the longterm trend, so that tells me that the Euro could be getting ready for a corrective move lower. Those target areas will be 119.55. If we click on the F8, I can almost guarantee you by Tuesday we should come down and test the 120.69 level, but the real level to watch here, guys, is the breakout point of the 120. When the Euro broke through that 120 level, that was the level that triggered additional longs going up here, around the 119.20, then again around the 120.20 level.
So we go back, we can see here, on the Euro/US pair, once again, one could argue that we’re simply waiting for the dollar bears to throw in the towel here and start taking profit to get this thing to accelerate. Now, one of the questions I was also asked: is the Euro going to go to 114 or 126? My comment on that, guys, is that you’re not going to get those kind of moves by year-end. It’s very, very unlikely that we hit either 126 or 114. Those are targets that are way, way off. You have to stay within the real mean of price, and at where we currently are. If we look at this, using the verified zones, even if I go back over a year here, you can see that the Euro is recovering, but not overly that great. The Euro has been down for quite a few years and, in my respectful opinion, that largely has to do with its correlation to gold.
Again, we have to break this down into that perspective and say, look, we really need gold to break through 1850 if we’re going to keep buying the Euro/US pair, but trying to target something out from today to say are we going to 114 or 114.26, that’s an unrealistic expectation at the current time. Stay within the current ranges, what we’re dealing with. Now we know where the bottom end of this range is. It’s down around 120.20, approximately. The long and short of it is that we have a shot of getting to 126 if we can hold above 120, but it more than likely will come back to 120.30, 120.40 before it goes any higher, so keep a very close eye on that level.
British Pound versus U.S. Dollar
The pound has got a big push this week, and, again, one of the other things that helped sink the dollar this particular week is, again, the media, telling us that Brexit is going good. Brexit is resolved. That is actually not what the negotiators were saying. Once again, it was the media spinning this thing, saying, “Okay, Brexit is resolved.” They immediately came out with a statement and said, “We’re in a heated part of negotiations. We never said that this was resolved,” but the media did. So the pound goes flying higher, the dollar gets hit again, but again, I think we would all be better off if we actually quarantined the media for 14 days, because then we could actually see more accurate. Because what we’re getting with a lot of news channels now is 20% fact and 80% opinion. I don’t want the opinion. I want facts. Is Brexit settled? Yes or no? The answer is no. It is not. That actually does not help the pound, and that deadline is coming hard and fast, I believe in July. Excuse me, January. So I don’t believe they will come to a deal, personally. But I could be wrong. But we’ll see.
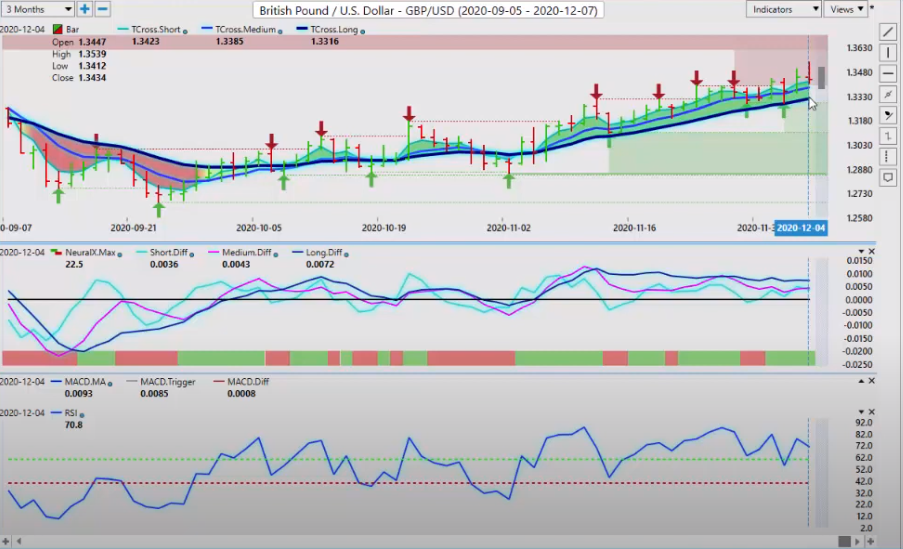
For now, the pound is likely to try and retrace here. 133.16. But again, if we click on our F8, you can see that the market is unable to hold below this blue line. That key pivot area is 134.02, so to start the week, basically our indicators are running a little bit flat here. It’s still carrying a slightly bullish tone, but keep an eye on those two aforementioned levels for potential entry points or reversals.
U.S. Dollar versus Japanese Yen
Same as the dollar/yen. If the dollar/yen is going to recover, this coming week would likely be it. We’re going to watch this heavy support, verified support, down around 103.65, continues to hold since early November. So again, and we added another push down here back at the beginning of November, actually, also, so we’re holding here, but we must break through this T cross long at 104.28 to get this thing moving, okay? If we click on our F8, once again, getting that additional pivot, that’s being challenged on Friday. Once they realize that the payroll number was not as bad as what they were trying to make it out to be, and that things may be recovering a little bit here, that the dollar/yen may have a shot of pushing higher.
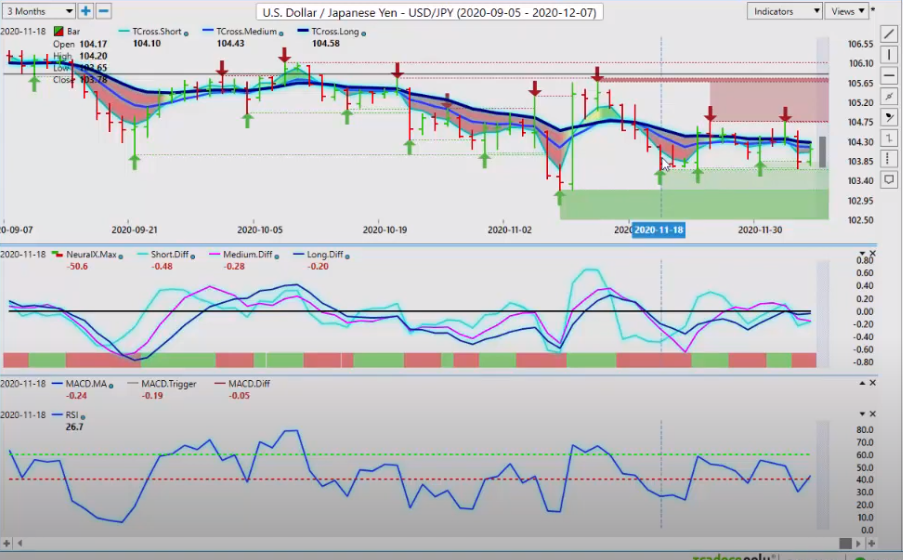
Now, if we can break above the long predicted at 104.14, we should, at the very least, be able to target the high of 104.75. But if we can break through that, then we have a real shot at getting back up towards the 105.67. So this is the way you would look at it, guys. In a particular trade, can we break above this particular level? Then we target the very next level. If we break above that particular level, then we move on to our next verified zone. It’s basically a two or three step process, but the first step is we must break above 104.14 and close above it for, I would prefer, at least one or two days. Two days is one of the rules I’ve made up, but we don’t always follow rules, I know that. But again, I think that if we can get above that level, that we have a shot of moving higher.
That is going to depend on the stimulus package, and, again, a lot of people throwing mud around here, and it’s funny how Pelosi seems to dodge some of these bullets, but the fact of the matter is, she’s been offered a substantial amount of money and turned it down just because she didn’t get the dollar figure she wanted. That doesn’t mean you turn it down. You take the money for the American people, and then you go back to the table and negotiate more. This has been a very heated debate on CNBC this past week. Turned into a full-blown argument, when a couple of the commentators or the guests came on and blamed McConnell. It was very interesting. Turned into quite the spectacle on live TV. My good old friend Rick Santelli certainly gave it back. So did Joe Kerns, and I was impressed, because that is true, what they said, whether the market wants to believe it or not.
We’ll see, but I believe that the pressure is going to mount on this women, and she is going to have to do something, because you can only throw stones for so long. If the American people need help, if they get that stimulus package, that will, in my respectful opinion only, again, that will help boost the dollar. So we look for that to happen.
U.S. Dollar versus Canadian Dollar
Now, as we look at our three main equity-based currencies, and they certainly are equity-based currencies, driving the Canadian dollar down, the equity markets moving higher, oil moving higher, that’s a huge benefit to the Aussie, the New Zealand, and the CAD. But again, if oil starts stalling, that is going to hurt the CAD immediately. The unemployment numbers out of Canada on Friday were better, definitely better, but again, Canada, I’m domiciled in Canada, guys. Canada’s about to go into lockdown. We’ve done a horrible job with the COVID virus, horrible. We have no vaccine capabilities, we’re going to have to wait for everybody else to get vaccinated before we do because our prime minister didn’t set up the proper facilities. He didn’t negotiate contracts, things with China fell apart.
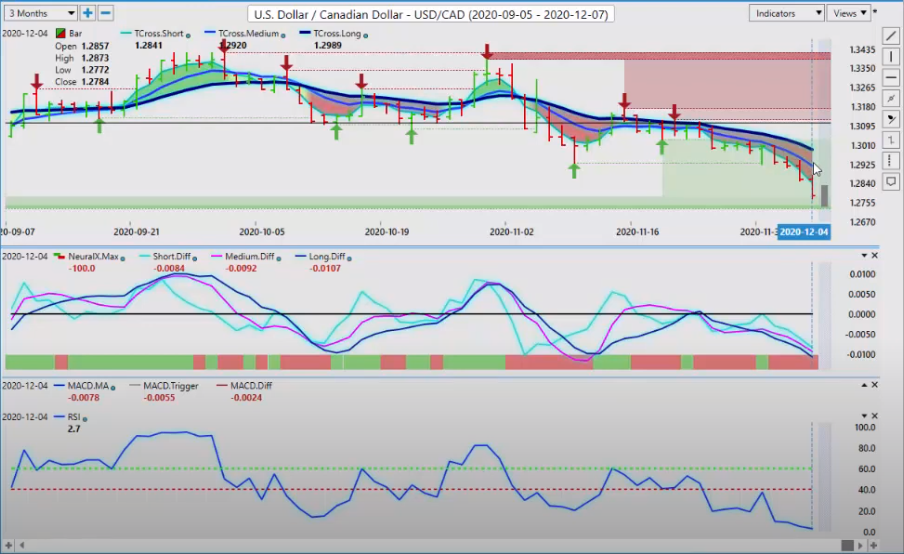
I believe this is not going to benefit the Canadian dollar in many different ways, particularly going into the first quarter of next year, that the reality is going to hit that Canada doesn’t have a vaccine, and we’re probably not going to have a vaccine for another year, so we’re going to be behind everybody else. That is why I think the Canadian dollar is going to suffer here. It’s getting a little bit of help from the equity markets and from the oil markets, but that is likely going to be very, very short-lived. Our key retracement point now, the T cross long, 129.89. That’s where we’re looking for the market to retrace to. If we click on the F8, you can see that that pivot area, 128.93, I can almost guarantee you we’re going to retrace to that level by Tuesday, barring a huge rally in oil and another huge rally in equities, but even then, the reality of the situation in Canada, it’s always good to talk to somebody who lives in that country, because you can get information that you’re not hearing from the media.
The UN actually said that Canada handled the COVID virus better than anybody else. There is absolutely nothing factual in that statement, when you look closer at it. Again, we are in orange. We’re about to go back into red, which means full lockdown. We saw what happened to the Canadian dollar last time that Canada went into a lockdown. I believe, if we go back here nine months and we look at this from nine months ago, that’s where the Canadian dollar was, guys. 146. So stop and think about that for a minute. If we’re speculators and I’m giving you inside information as to what’s going on here in Canada, that’s not good, is it? We’ll watch this very closely, but I believe that a reversal on this pair is actually imminent.
Australian Dollar versus U.S. Dollar
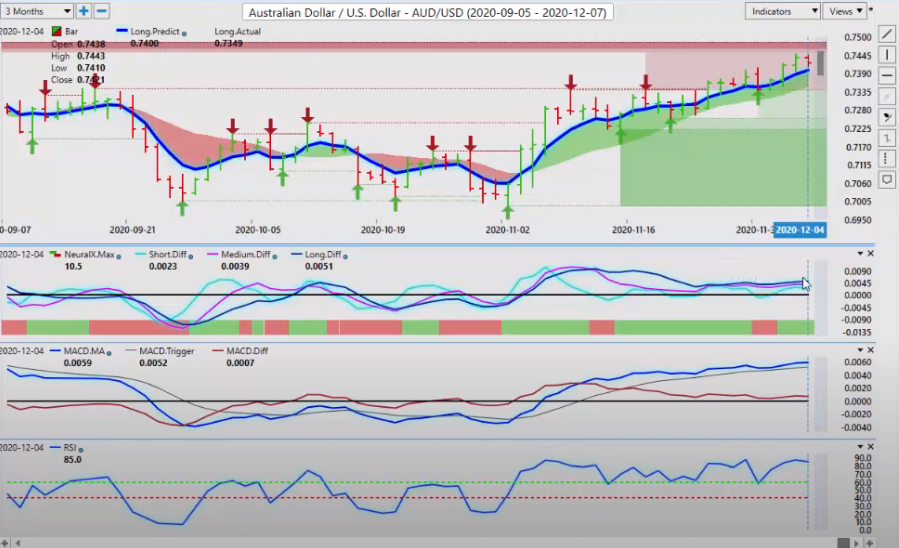
When we look at the Aussie/US pair, again, feeding off of that S&P500 strength. Now, we’re getting a little toppy, we’re coming into verified resistance. Watch for retracement here too. 7340. When we click on our F8 in our VantagePoint software, we need to hold above the 74 level. Now, the indicators are moving kind of sideways. The neural index is still saying we’re good, the RSI, we’re holding firm, the MACD. Predicted differences have been sideways for a while, but the market continues to advance, so as long as we’re holding above this key level and the equity markets remain firm, the Aussie should move higher after a corrective move lower.
New Zealand Dollar versus U.S. Dollar
The exact same thing here, guys, is going to apply to New Zealand. You can see that we’re starting to get a little toppy, we’ve had a nice rally. So again, there’s multiple indicators here that are warning us that potential dollar strength is on the horizon. The problem, as I’ve said, is you have three months of the year where that cycle is not really there, and December does fall into that category.
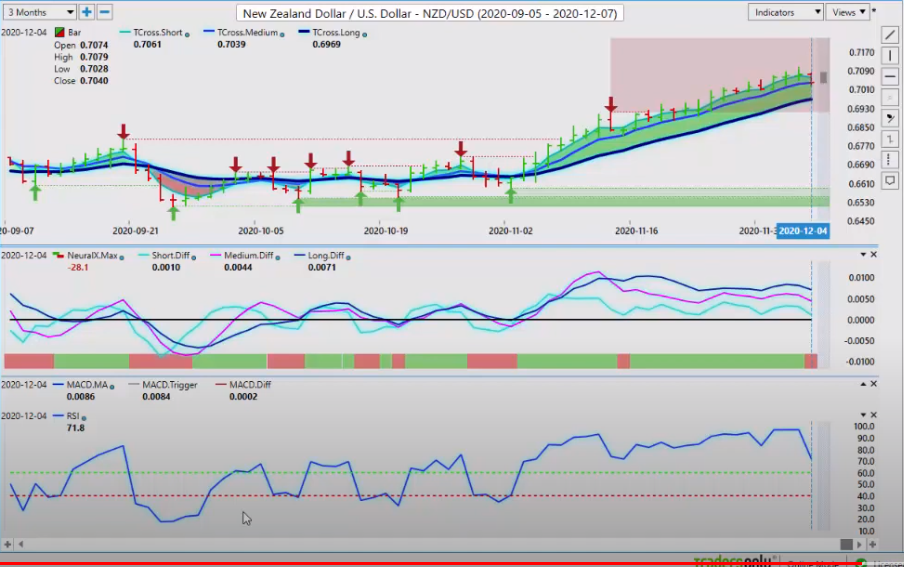
But, once again, if we look at this, of the calendar year, up until the month of November, 83% of the time you’ve got dollar strength into the 8th of the month. Even if you count this in October on the 10th of the month, the beginning of the month, guys, somebody is buying dollars, and I’ve seen this for at least the last 10 years. I watch it very, very closely, because I know that countries have to settle their trade balance. Whether they love the dollar or hate the dollar, they have to buy it. If the Europeans sell a bunch of goods, for example, to the US, and they want to get paid for those goods that they sold to the US, they are not willing to accept US dollars. They want Euros. There has to be a currency transaction. So we will watch that very closely in the coming week.
With that said, this is the VantagePoint AI Market Outlook for the week of December the 7th, 2020.
Are you using A.I. yet?


