


Welcome to the Artificial Intelligence Outlook for Forex trading.
VIDEO TRANSCRIPT
VANTAGEPOINT AI MARKET OUTLOOK
Okay, hello everyone, and welcome back.
My name is Greg Firman, and this is the Vantage Point AI market outlook for the week of February the 16th, 2026.
U.S. Dollar Index ($USDU)
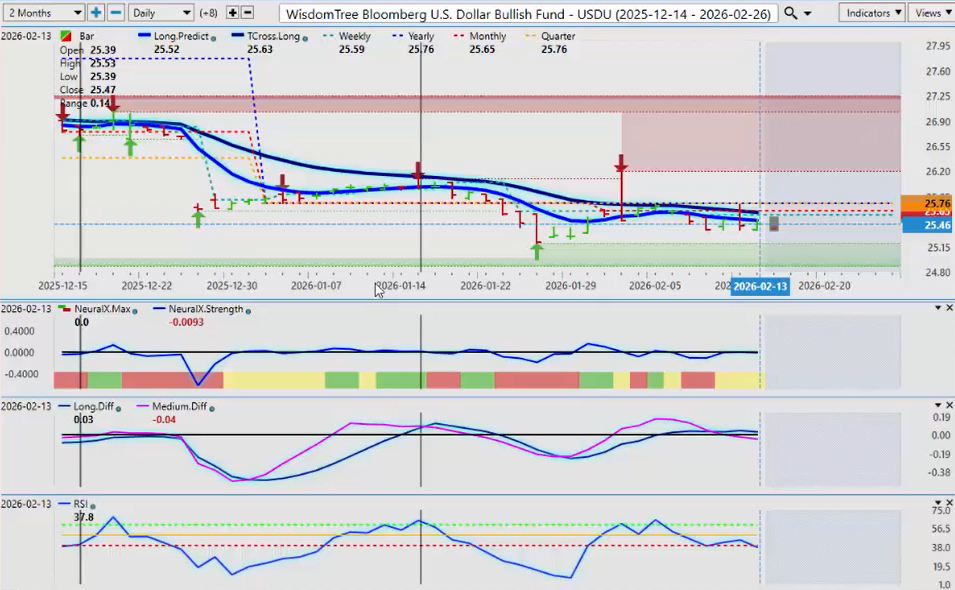
Now, to get started this week, we’ll begin where we always do with that very important US Dollar Index. Now, what I’m using here through the VP software on the ETF side is the WisdomTree Bloomberg U.S. Dollar Bullish Fund (USDU). I found this to be incredibly accurate in its predictions, with less weighting towards the euro currency. So the first thing we want to look at is repetitive patterns in these markets. I’ve discussed this on here for literally years, guys, that there’s as clear a pattern as I can see with the US Dollar Index being strong at the end of the month into the first week of the new month and usually seeing significant weakness around mid-month. So right now, if I look at December of 2025, you can see that we were below the yearly opening price. We were struggling along the monthly opening price. Then between the 15th and the 18th, the dollar sold off. We then come into January, what appears to be a very bullish move coming out of the gate into January, and then you can see we hit the exact same period of time around the middle of the month and, mysteriously, with a very bullish signal up to that point, the dollar fails again. Then it turns around at the end of the month, comes back up again. So where we’re at right now is we’re basically the same as where we were last year. We’re struggling along the yearly opening price, the TROSS long, monthly opening price. Everything is sitting right there, guys, and we’re going into a period of known U.S. dollar weakness. So that doesn’t mean that every single month this would occur, but it does usually occur 10 of the 12 months per year. So again, nothing is 100% in trading or investing, but these types of repetitive patterns—always remember that currencies are not like stocks or futures or options. Nobody has to buy any of those, but via currencies, people are required to buy and sell them, particularly at certain times of the month. So for next week, we have our yearly opening price, which will come in at 25.76, and then our T-cross long and our monthly opening price are basically at the exact same level. When we connect the dots to these monthly patterns, there’s a high probability of dollar weakness coming next week. Now we do have the PCE data next week, but again, a holiday-short week. So you’re going to see volatility on Tuesday, but by Wednesday and Thursday, the price should start to smooth out with dollar weakness. Right now, we have the pink line crossing the zero line. This is the proper structure of a medium-term crossover in the VP software. We’ve crossed the zero line. The pink line is a medium-term crossover. It is telling us that’s occurred, but we are below the TCROSS long when this has happened. We are below the monthly opening. We are below the yearly opening. That is the proper way to use the medium-term crossover here, guys, not randomly by itself, because very often the medium-term crossover can be corrective in nature, not necessarily part of the primary trend. So in this particular scenario, the medium-term crossover is consistent with the primary trend to the downside.
Gold
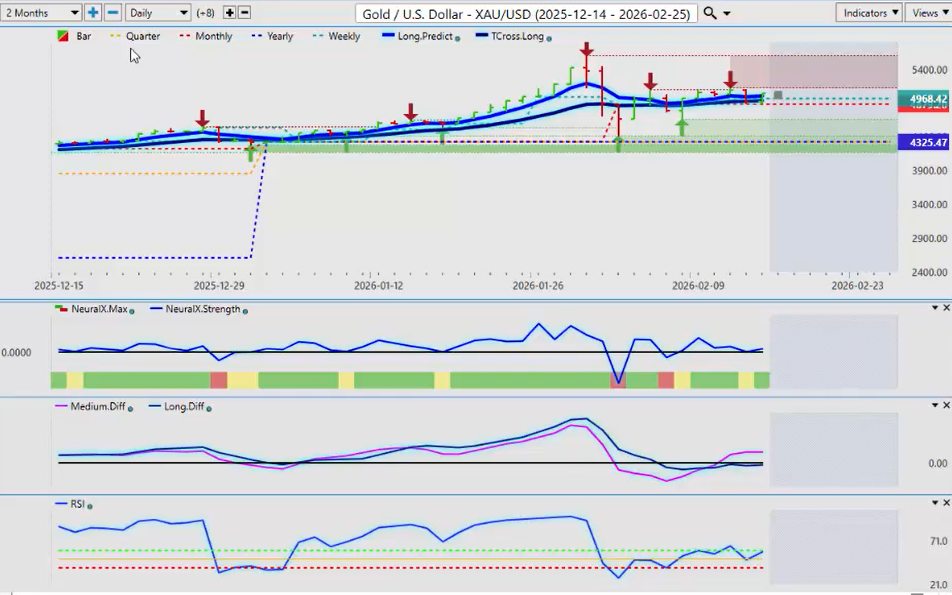
Now, once we’ve identified that, we can move into our intermarkets, and the first one we would look at here would be gold. So when we look at gold, we see the same thing, an MA diff cross to the upside, but the medium-term crossover has occurred in the proper price structure above the yearly, above the monthly, above the TCROSS long, and even above our long predicted. So these levels are all coming in, the monthly at 4879. But the long predicted and the TROSS long are the two critical levels we would watch. Right now, we don’t have momentum yet in gold. When the predicted RSI breaks above 60, we should see momentum kick in to the upside, at least to the end of the month. But the main thing is, guys, I will repeatedly, I will always say this, know your levels, right? Know what your primary trend is, and the primary trend on gold is clearly up. Okay.
SPDR S&P 500 ETF (SPY)
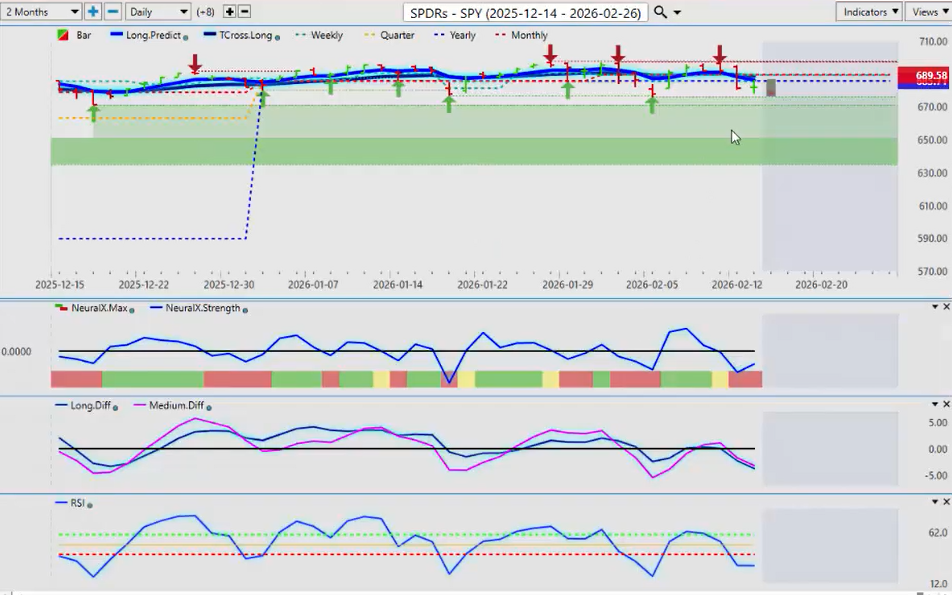
Now, when we start applying some of our main equity markets to that, looking at the SPDR S&P 500 ETF (SPY), we’re looking again at what kind of price structure we are dealing with right now with the SPY. This is looking like we may see a corrective move higher, but we must clear this TCROSS long at 688.62. I’ve been a strong advocate of two of the main indices by ETF, which are the DAX ETF and the iShares Russell 2000 ETF (IWM). I’ll talk about those two. Now, the SPY and the Invesco QQQ Trust (QQQ) have not done anywhere near as well as what the IWM and the DAX ETF have. So right now, the S&P 500—it’s an ominous signal—but the one thing I can say that I do like is looking internally at the neural index. We have a reverse check mark here. That reverse check mark often has led to a reversal. And the neural index is red, but the neural index strength is pointing higher.
Russell 2000 Index ($IWN)
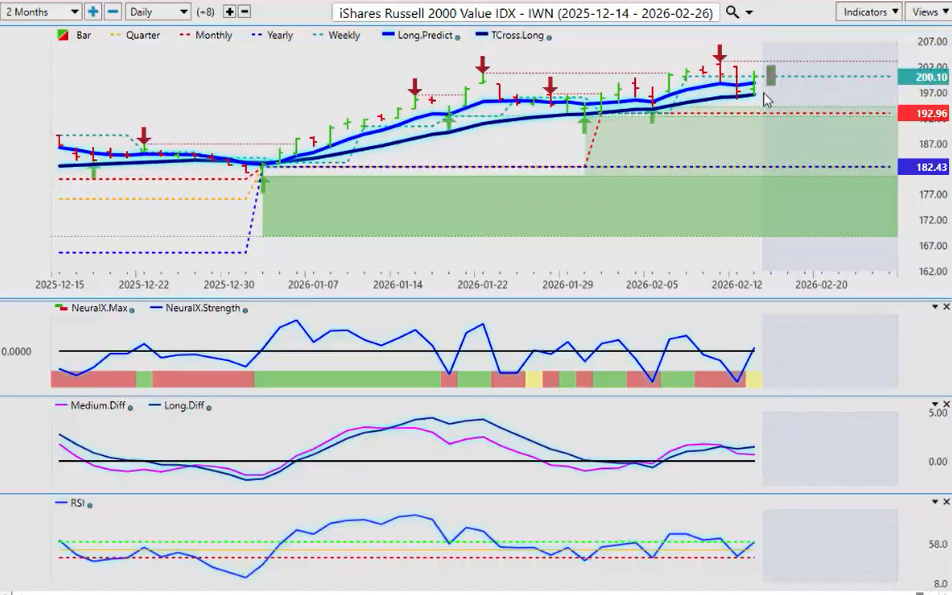
But again, if we look at the IWN, the Russell, we have a very different price structure here than what we do with the QQQ and the S&P 500. So when I look at this, I’ve had my retracement back to my TCROSS long, which, by the way, I see almost every single Thursday, this thing selling off only to rebound again higher on Friday. Remember, Thursday’s a profit-taking day. This previous week, we had the payroll number, then we had the CPI number, and again, that’s what the market was waiting for. But I would argue the neural index strength was ahead of this. But once again, there is your MA diff cross right here. And in this type of price structure, it’s telling us that we’re correcting lower. There is not a new trend because the trend is not down on the Russell. The trend is clearly up. We’re positive on the year. We’re positive on the month, and we’re above our TCROSS long. So those simple checks can very quickly keep you out of trouble. Okay. So right now, the Russell looks quite good while above the TCROSS long at 196. And I would respectfully submit longs are still in play while above 192.96, at least until the end of the month. March and April in the Russell historically have not been as good, but we’re not in March or April yet. Okay.
Global X DAX Germany ETF ($DAX)
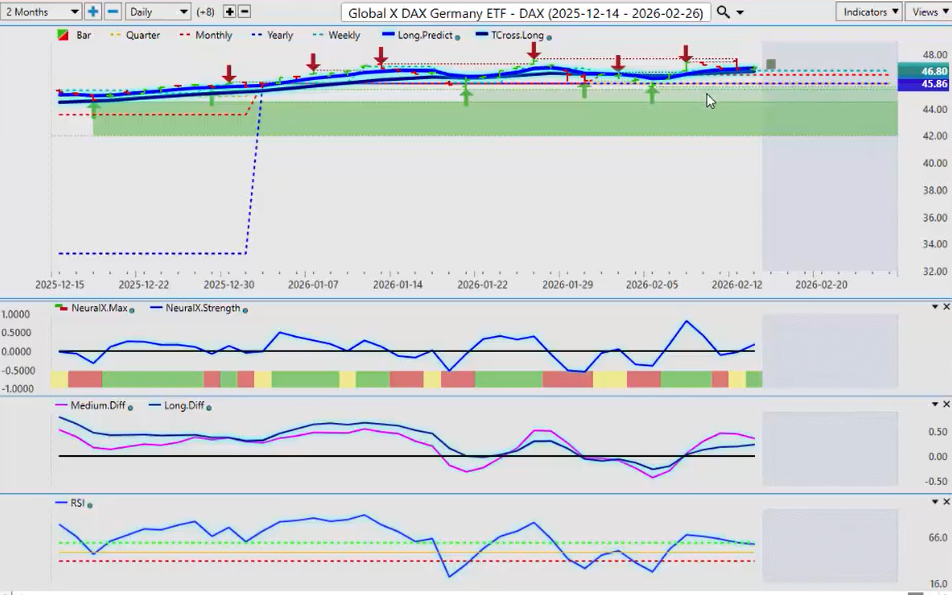
Now again, the DAX also showing a very similar price structure or a higher correlation to the Russell and the Russell ETF. So for next week on the DAX, everything looks good because, again, what I have seen is that there has been a relatively high correlation between the EUR/USD forex pair and the DAX 30, either the futures or the ETF. The ETF just simply smooths things out for us a bit here. So the key levels there again, our TCROSS long coming in at approximately 4615, but our yearly opening price at 4586. Longs remain in play while above that particular level. Our neural index strength starting to turn around. We’re losing a little bit of momentum here on the predicted RSI, but for now, longs still remain the better play.
Volatility Index ($VIX)
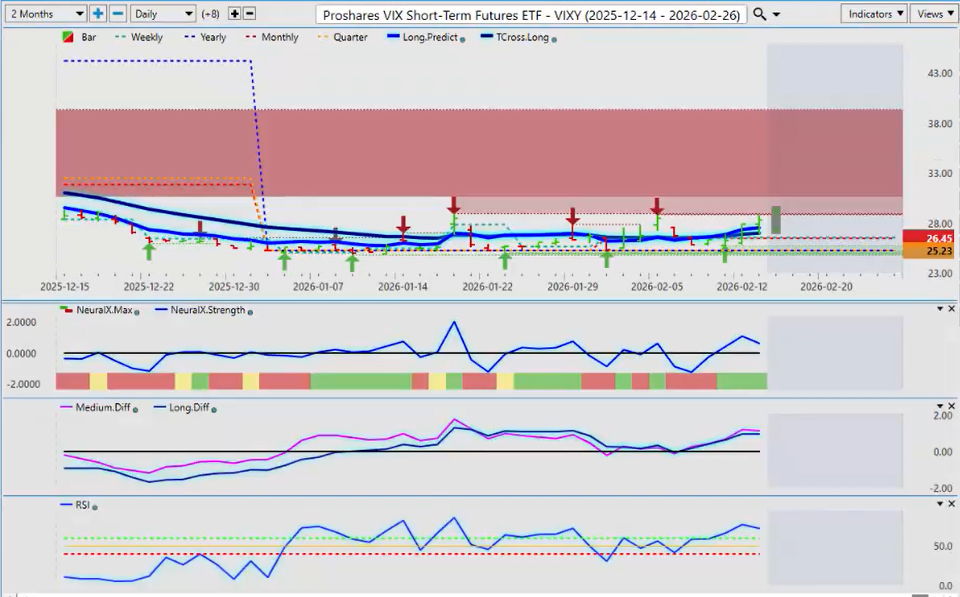
Now, if we look at all of this via the CBOE Volatility Index (VIX), the only thing that’s a little bit concerning is this VIX continues to hold above the calendar yearly opening price, the iPath Series B S&P 500 VIX Short-Term Futures ETN (VXX). So once again, I believe that this verified resistance high will likely hold at 28.882. We would need a sustained break to get us out of this particular channel that we’re in between the yearly opening price and again these verified resistance highs up in this 28.95 area. So again, for now, it looks like the neural index strength is saying we’re losing momentum to the upside. We measure that up against that verified zone, and that tells us, okay, we should be moving lower on this one.
Bitcoin ($BTC/USD)
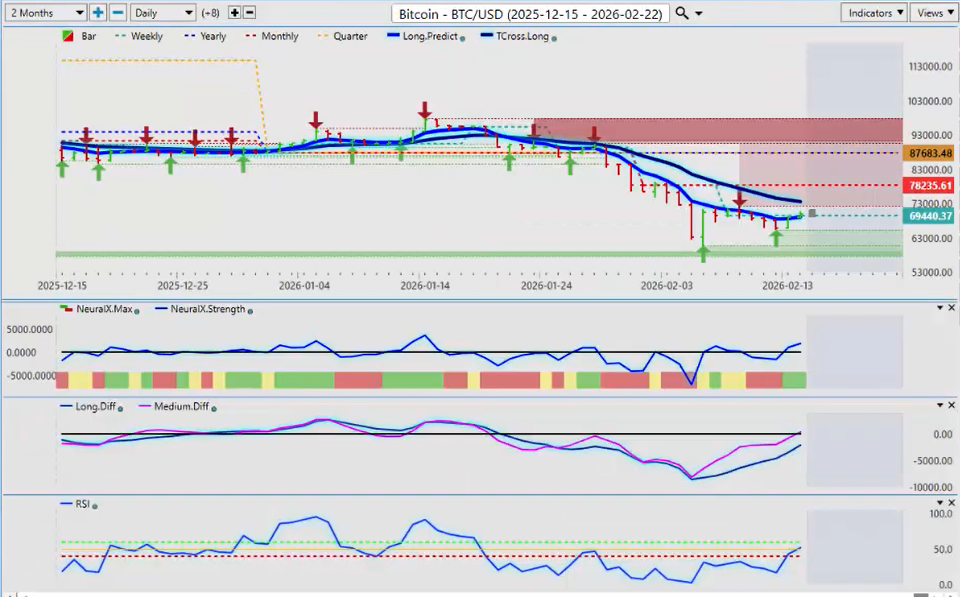
Now when we look at some of our main commodities, Bitcoin, oil, Bitcoin continues to struggle. What I can maybe forewarn everybody is there is a historical pattern in the month of March where Bitcoin does relatively well, particularly over the last five years. But if we go back 9 years, 11 years, it’s done still 75% of your trading pressure has been to the upside. So if Bitcoin is going to rebound, the closer we get to March, the more likely that is. But again, this would be corrective in nature while below the calendar year-to-date opening price at 87,683. Then we have our monthly opening and, of course, the all-important TROSS long pivot area at 73,512. So right now, the indicators in VP are becoming somewhat bullish here on Bitcoin, and so I thought I would give everybody a heads up as to what may occur in the month of March with Bitcoin.
Crude Oil ($USO)
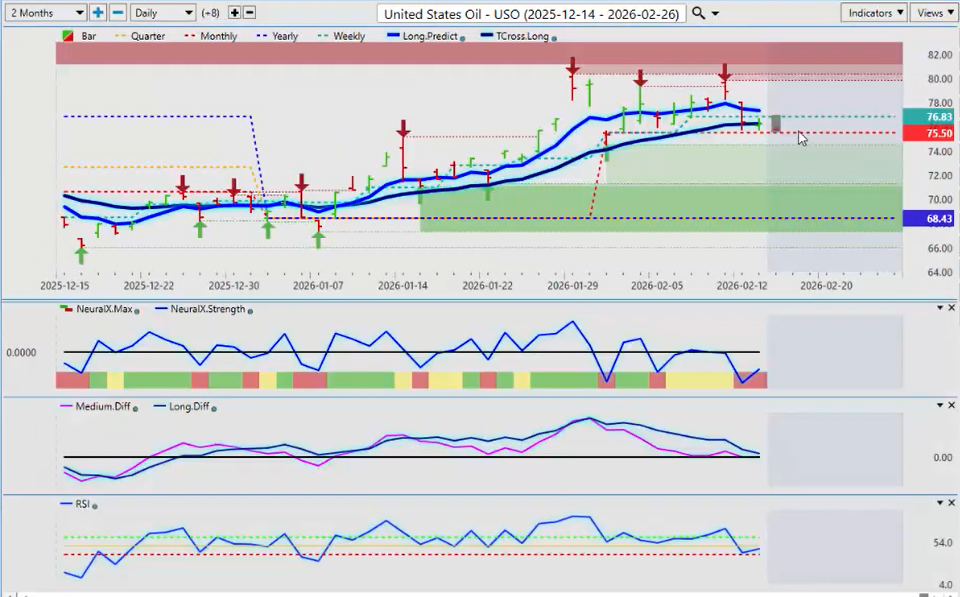
Now when we look at oil using the ETF, right now, again, the price structure of oil remains bullish. So when we see the pink line crossing the zero line or a medium-term crossover has occurred, that is not a new trend, guys, because you have a blue line crossing the black line. That’s telling us we’re correcting lower. It’s a new trend when we break down below the monthly opening, below the yearly opening. But the price structure here—don’t let anybody tell you other than these charts as to how oil is doing. So if we look at that from Friday on oil, then we can see you can’t very well call something bearish that’s up 11.17% on the year, can we? So again, people will say, I hear different websites, different analysts saying oil is turning bearish, blah blah blah. Well, that needs some context around it. We can’t just blurt something like that out. We have to look at price structure clearly and say, okay, well, no, the primary trend is not down, it’s up. So buying on a dip, and the closer we start running into mid-March, April, May, June—these are good months for oil, guys. So again, any pullback, longs definitely remain in play for now.
Now, as we look at some of our main forex pairs here, the US Dollar Index analysis dictates what the G7 pairs will do, but all eyes next week and the week after probably are going to be on EUR/USD.
Euro versus U.S. Dollar ($EUR/USD)
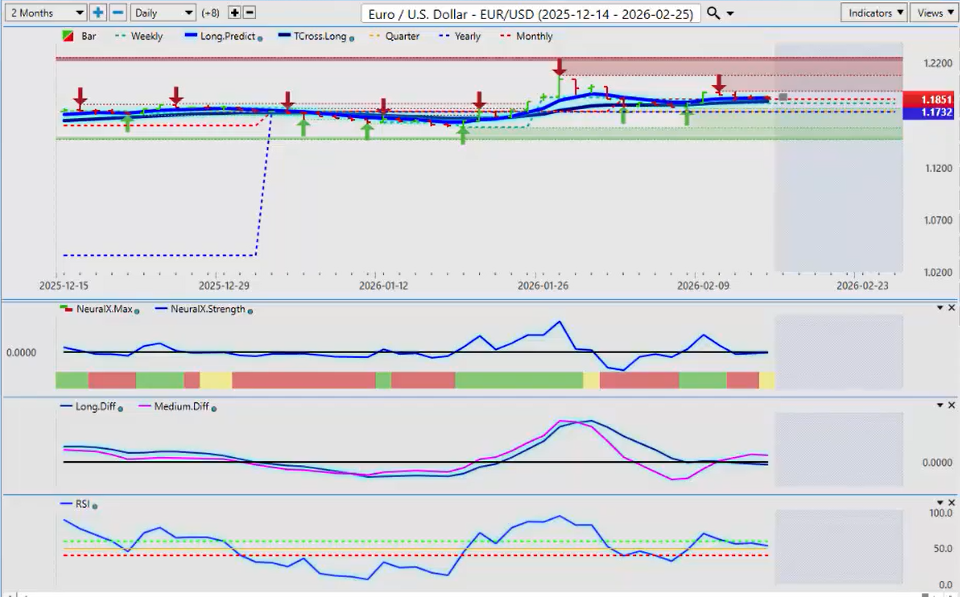
So if EUR/USD can move up, which I believe it can, then it should pull the DAX up with it. So right now, when we look at the primary trend on the euro, the primary trend here, guys, remains up. The yearly opening price, 1.1732. The longs remain in play while above that particular level. 1.1835, the TCROSS long. I would like to see us hold above both of those levels by Wednesday or Thursday of next week. And that should confirm that we can make a bigger move to the upside. But if we can’t hold above 1.1732, that’s when the primary trend changes. It’s very important that I point this out. Right now, the core indicators in VP—we have an MA diff cross to the upside, and again, structurally, the medium-term crossover is correct that this is a corrective move lower in nature and we are likely moving higher based around those patterns again, whether it be the USDU, the Invesco DB U.S. Dollar Index Bullish Fund (UUP), the US Dollar Index itself—it’s very high-weighted to the euro, except the USDU. It does broader U.S. dollar purchases during the course of the month, the week. Okay. So again, when I look at this right now, this would tell me that we would be looking for a pullback in holiday-thin markets on Monday or early Tuesday to pick up those longs.
U.S. Dollar versus Swiss Franc ($USD/CHF)
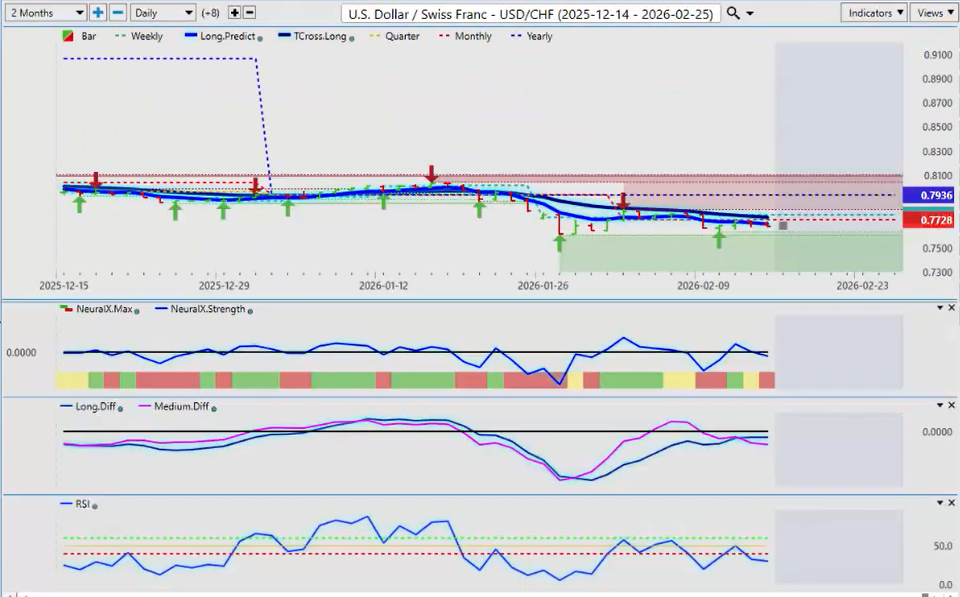
Now again, going through all of the forex pairs may be a little bit redundant because they’re all based around the US Dollar Index strength or weakness, but the Swiss franc—once again, always identify what the primary trend is here, guys. So if I look at the VP indicators correctly and say, okay, I’m below my T-cross long, I’m below my yearly opening price, I have an MA diff cross that has occurred below the zero line, this is warning that this pair is likely getting ready to make a bigger move to the downside. I don’t think it will be until, if it occurs at all, it won’t be until midweek because, again, we’ve got a holiday in the U.S. and Canada on Monday. We come in on Tuesday, we’re going to get some wild price action there. Then on Wednesday and Thursday, price starts to smooth itself out. But make no mistake, even though this is a carry trade, it’s being pressured to the downside.
British Pound versus U.S. Dollar ($GBP/USD)
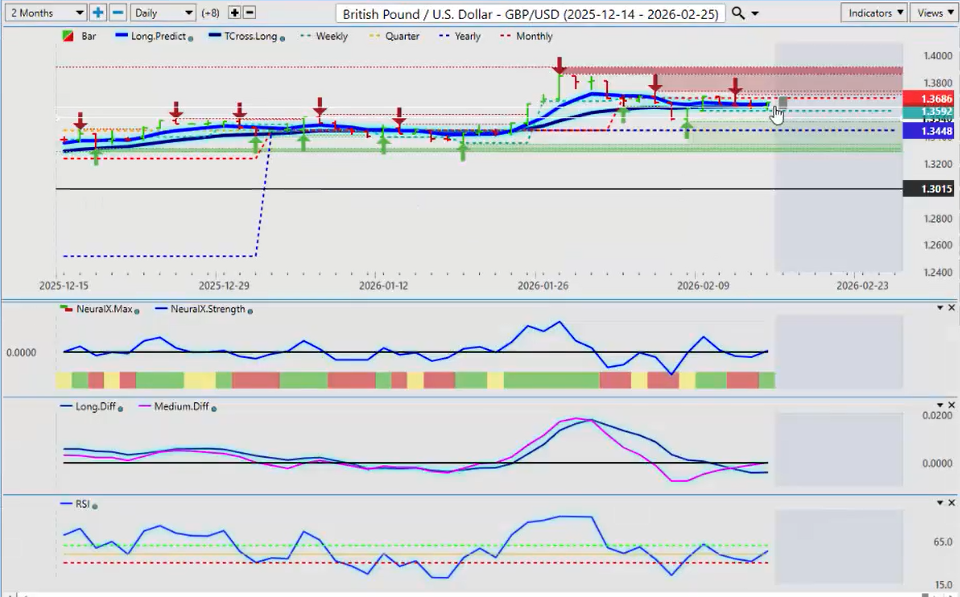
The pound dollar, in reverse, is being pressured to the upside. But the UK has their own issues right now here too, especially with interest rates, Bank of England, some of the economic data coming out of the UK is not the best. But for now, the primary trend remains up. The TCROSS long—again, I’m going to argue late day Tuesday, early Wednesday trade—we want to be above the TCROSS long at 1.3626. If we are, then that would point to further gains on this particular pair by mid to the latter part of next week. Because again, this is an outlook, guys, not a recap of something that’s already occurred this week. We’re looking forward into next week’s trading.
U.S. Dollar versus Japanese Yen ($USD/JPY)
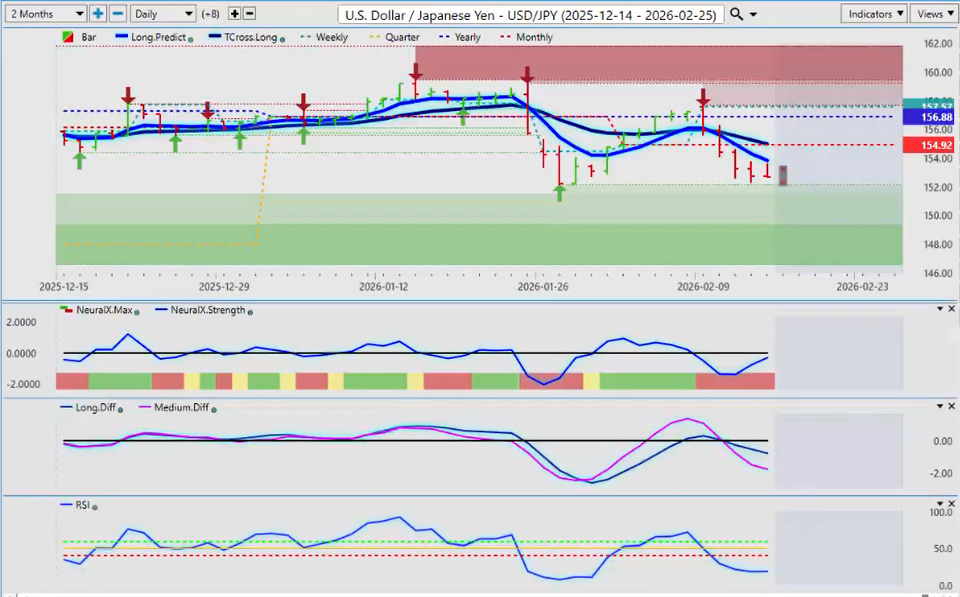
Now, with the dollar yen, again, the CPI being a little bit cooler, questionable unemployment numbers with seasonal adjustments—the carry trade is not really on at this particular time. The market is now flip-flopped, and they’re betting that the Fed is going to cut. I would lean, I would be in that camp also. I don’t believe the payroll number. I believe the better payroll numbers that we got will be revised down next month. That’s the likely outcome there, but nothing is for sure. So we’ll see. But for now, this pair is under pressure, and if the market believes the carry trade is going to come under pressure, they’re going to exit those positions, meaning long the dollar, short the yen, collecting that interest swap payment every single day, times three on Wednesday. So for now, know your levels here, guys. Okay.
U.S. Dollar versus Canadian Dollar ($USD/CAD)
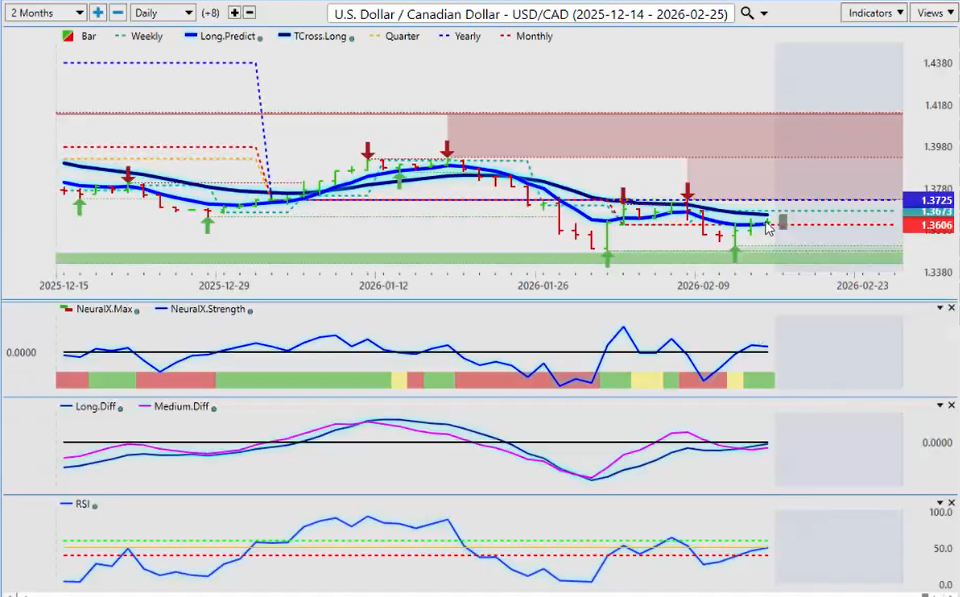
Now, the U.S. Canadian pair, this one is going to be an interesting one. I haven’t been a strong advocate of buying Canadian dollars, but as we move into March, April, and May, the latter part of March, more specifically April, May, and June, the Canadian dollar has a very high correlation to oil. And despite what people are saying—green energy, I’m all for it—but oil is not going anywhere, guys. Plain and simple, not for a very, very long time. So I believe that oil will follow its regular patterns. And that means U.S. Canada could follow its regular patterns too. I know Congress is talking about wanting the tariffs against Canada removed. I don’t know. I don’t think that will happen. I believe that will be vetoed, but we will see. But for now, what we care about, guys, what is the primary trend? Right now, it’s down. We’re below that yearly opening price at 1.3725. That’s where all your resistance is. But your immediate resistance using the T-cross long is 1.3653. So shorts remain in play. When we look at our MA diff cross, we’re below the yearly opening price. We’re below the T-cross long. I’m not a strong advocate of selling this pair, but I have been selling it because, again, I’m not going to fight what this is saying. Even though my opinion varies wildly compared to this, I have to look at the structural bias of the market, and it’s saying that we are going lower. So I imagine we’re going to go higher first when all markets come in on Tuesday. This is going to spike higher, probably towards the 1.37 area. That would be your selling opportunity.
Australian Dollar versus U.S. Dollar ($AUD/USD)
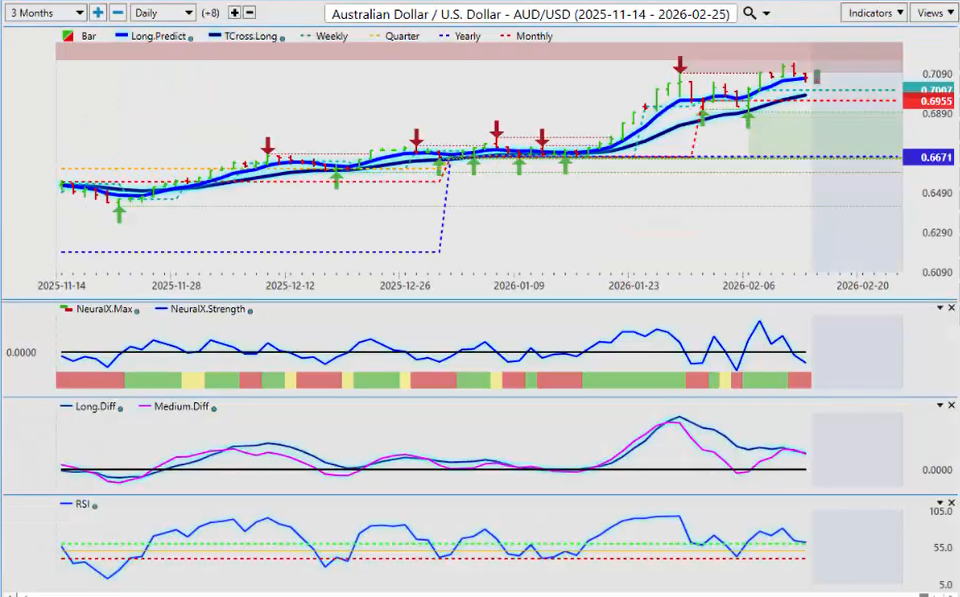
Now, as we look at our other two equity currencies slash commodity-based currencies, the Aussie and the Kiwi, I believe both of these currencies will have a bit of a corrective move, but the price structure of this is clearly up. The VP indicators are pointing down. That is not a new trend here, guys. This is what we have to understand. It’s telling us we’re going to correct lower. So we have our TCROSS long that’s coming in at 69.82 and our monthly opening price that is also sitting at 69.55. That’s your corrective area right there. A little concerning that we’re 300 pips away from or more from the yearly opening price, but I believe this area in here will hold.
New Zealand Dollar versus U.S. Dollar ($NZD/USD)
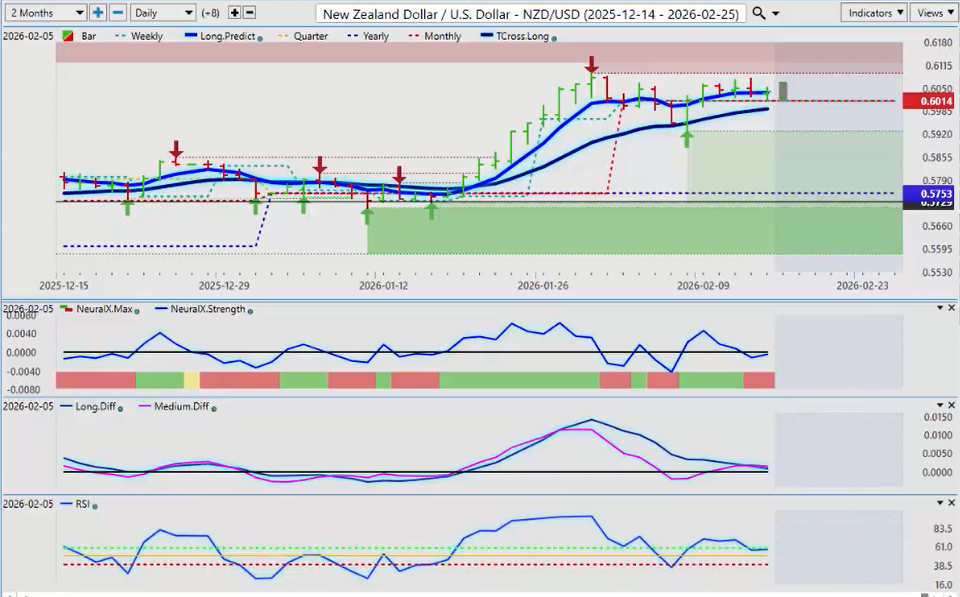
And the Kiwi structurally looks exactly the same. So you can pick your poison between these two, or you can jump on both. But right now, again, a corrective move lower. Always know where your TROSS long is, 59.91.
So again, most if not all of the G7 pairs that I’ve mentioned here today are tied to that US Dollar Index or the USDU in some form or another. But if we can identify these patterns, we can get out in front of these moves before they happen, not after. So with that said, this is the Vantage Point AI market outlook for the week of February the 16th, 2026.


