


Welcome to the Artificial Intelligence Outlook for Forex trading.
VIDEO TRANSCRIPT
VANTAGEPOINT AI MARKET OUTLOOK
VantagePoint A.I. Market Outlook for February 2, 2026
Okay, hello everyone, and welcome back.
My name is Greg Firman, and this is the Vantage Point AI market outlook for the week of February the 2nd, 2026.
Wisdom Tree Bloomberg U.S. Dollar Bullish Fund ($USDU)
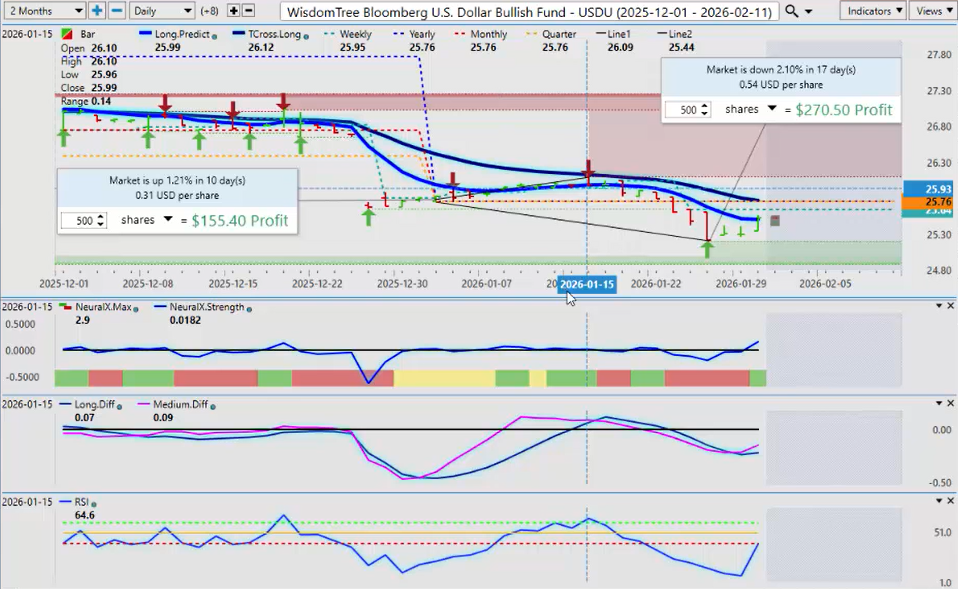
Now, to get started this week, we’ll begin where we always do with that very important, uh, US dollar. Now, what I have used over the last several months doing these presentations is, of course, the Wisdom Tree Bloomberg US dollar bull fund, the USDU.
Uh, I found considerable value on this on dollar purchases, using dollars for purchasing, uh, products around the world. So let’s look at the dollar’s performance for the month of January. We can see that we’ve had about 1.21% to the upside, but we’ve had almost twice that to the downside, with 2.10% down. So again, this was discussed at length about these dollar cycles that reoccur every single month. So we see the exact same signal reoccurring, the dollar selling off around the 15th of the month. That’s the last time we want to be buying dollars around that time of the month. And again, this most recent selloff in the dollar, we, we were way out in front of it.
So right now, as we move into the week of the non-farm payroll number, we see that same reoccurring signal of some dollar strength, but this would be corrective in nature only, as you can see our T cross long at 25.77 is now intersecting with the yearly opening price. Now again, I had shown some of the false signals from the UUP and the actual dollar index itself, but with the USDU, this showed only a corrective move higher to the T cross long, where I had discussed it would likely fail, which it did. So we’re looking for the same thing to repeat itself.
Now, in most cases, guys, the markets are only trending 20% of the time. And I would argue 9 to 10 of the 12 months per year, this is what I see. Dollar buying at the beginning of the month, dollar selling in the mid, around the midmon. The VP indicators are confirming some dollar strength here. And again, that would be corrective in nature.
Now, with that dollar strength, we can see that it’s pushing gold back down. Now, gold, in my respectful opinion, only is a buy and a dip. Clearly, uh, there is no new trend has surfaced yet, but there is a clear trend in the dollar now, which is to the downside while we’re holding below that yearly opening price. So gold, there is some things that are happening on the, over the course of the, the weekend with, with China, uh, regarding gold and silver, a few different things that are happening. So it should be an interesting start to the week as they halted trading.
Gold ($XAU/USD)
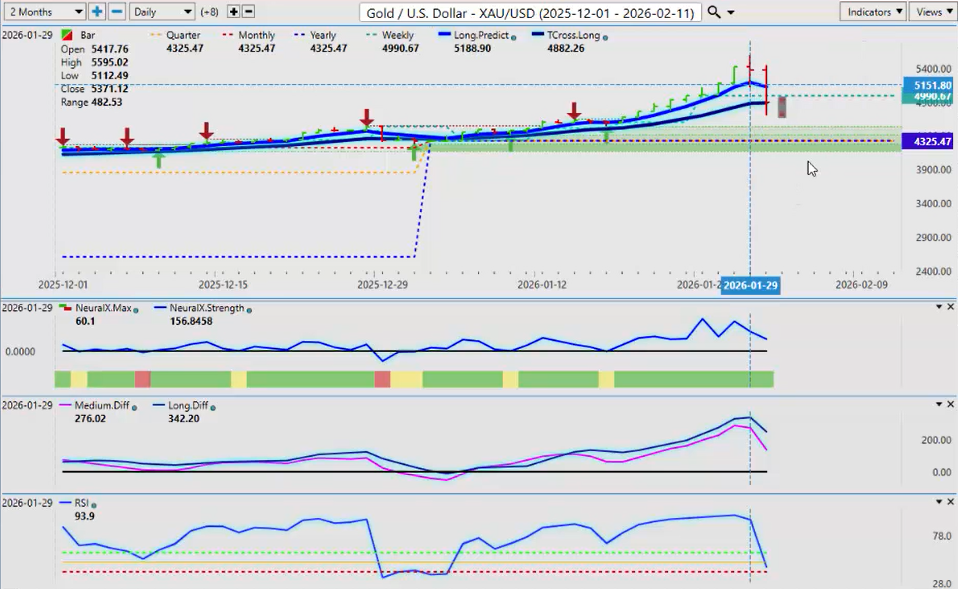
But gold, 4325, I can see us slowly grinding down towards that area. But that would be a buy and a dip, just like the dollar is a sell on rally. So again, uh, some more downside pressure to begin the week can’t be ruled out. But when we look at this right now, again, our TROS long, 48.90, that’s the key level to keep your eye on. Very often, whatever the market does on Monday, it does the exact opposite on Tuesday. Don’t forget that, right? So as long as we’re holding above 4325, this is corrective in nature, uh, but perfectly normal for gold to be moving lower at this time of the month.
SPDR SPY ETF ($SPY)
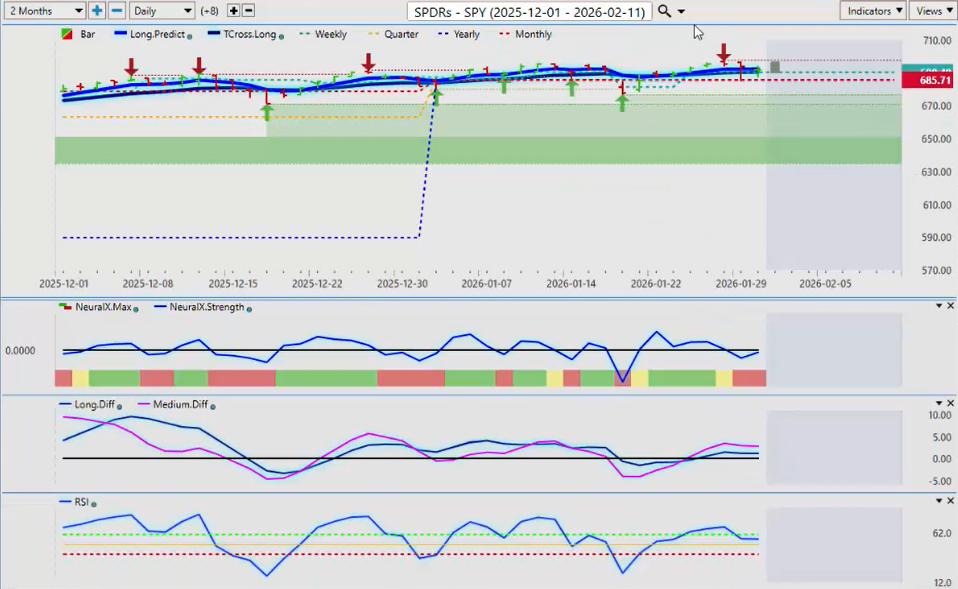
Now, when we look at the global equity markets, the SPYs and the NASDAQ in my, in my view are struggling here.
Russell 2000 Index
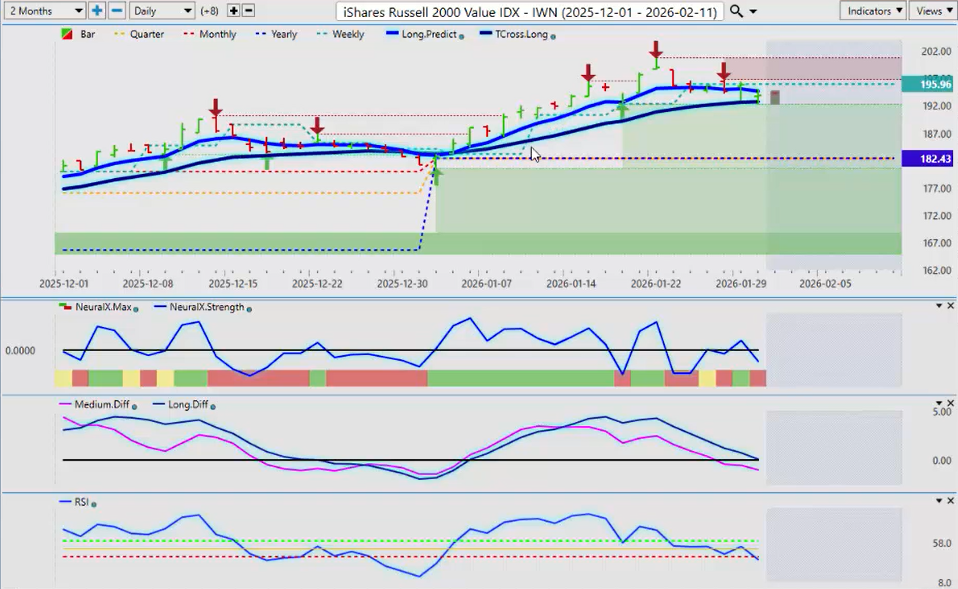
The two that I do like is the Russell and the DAX, which I’ve been pretty vocal about. But for now, we, this is the key level you want to watch, the VPT cross long, 690, and the yearly opening price at 685.71. If we’re, as long as we’re holding above this level here, guys, then everything with the, the equities for the most part is fine, even with the choppiness at the start of the week. But keep a very close eye on that.
But again, in my view only, we are a little tight to this yearly opening price, which is a little bit concerning. The predicted differences here, they’re flat, but they’re, they’re still on the bullish side above the zero line. But when we look at the Russell, you can see that the Russell has really performed well this year. Uh, and again, we’re holding on to the T cross long. Two days in a row, we’ve hit the T cross long to the number and bounced off. Now, the yearly opening price here, 182.43, again, as long as we’re holding above that, and again, this is another classic example, uh, when you have a medium-term crossover, it’s always important to understand the key pivot level, which is the T cross long.
This very well is likely just a, a corrective move lower. It’s not a new trend. For a new trend to occur, we need to break down below the T cross long. And in my respectful opinion only, I’ve got to get below 182.43 before I have any interest in selling the Russell.
DAX
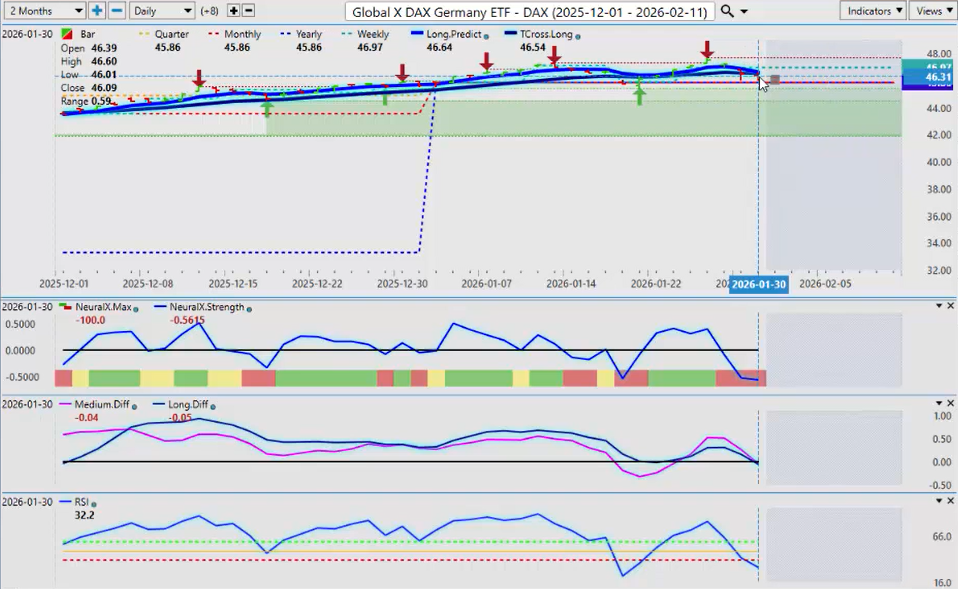
Now, the DAX, again, under a little bit of pressure this week as the euro, which I’ll discuss in a moment here, uh, started to move lower. But always remember, that’s usually what the euro does anyway, uh, in the first week of the, the new month or at the very end of the current calendar month. So we, we saw a bit of selling pressure on the euro. And, but again, when we look at the global DAX ETF, the critical level, 46.54 and 45.86, as long as we’re holding above that, everything is still good to go on longs in my respectful opinion.
And of course, we would want to, want to make sure that we’re looking at the VIX, the short-term, uh, VIX futures. Now, this is an interesting one because again, uh, T cross long and the long predictive are right on top of each other. The yearly opening price, 25.23, that’s the level we want to keep an eye on.
Volatility Index ($VIXY)
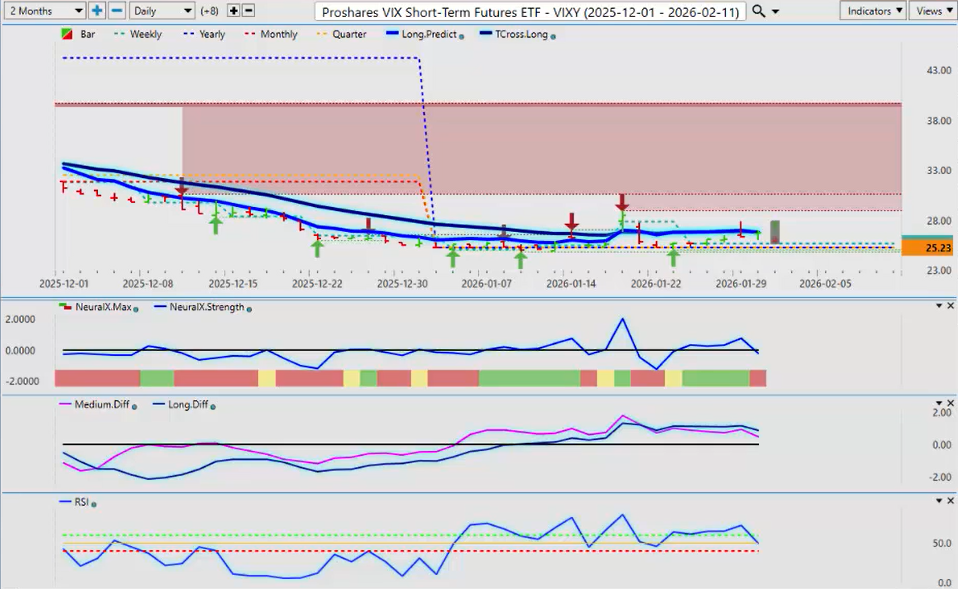
Now, a point of interest is the VIX has been basically positive. Uh, the short-term VIX futures, excuse me, have basically been positive the entire month of January. And it’s very interesting when you look at the S&P, uh, has dipped below the yearly opening price on several different occasions. So that could be a warning sign. But in most cases, the, the equity markets would struggle a little bit this week with a pending dollar strength. But we know that that dollar strength is likely to be short term. That’s the main thing that we want to watch here.
Bitcoin ($BTC/USD)
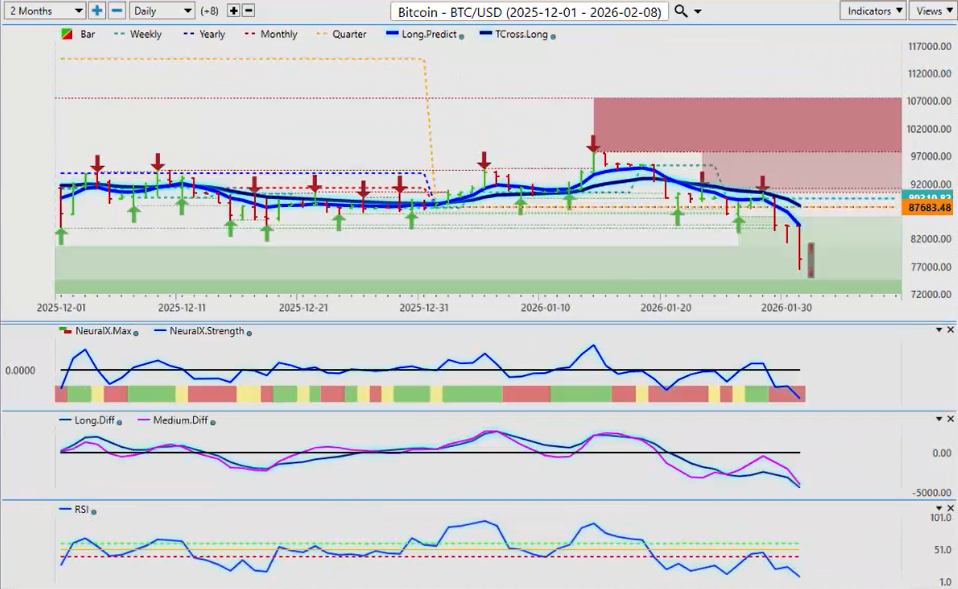
Now, Bitcoin, also responding to that end-of-the-month dollar flows. And again, with the dollar, it’s very important to understand that nobody is required to buy a stock, a commodity, an ETF, but they are required to buy many different types of US dollars, Canadian dollars, euros. They’re required to buy those at certain times of the month to settle trade balances, pay pensioners, all these different things. There’s an, a requirement that that’s what makes these patterns in the dollar somewhat predictable, when they’re going to buy dollars and when they’re not.
So again, when we look at Bitcoin, likely to see a little bit more downside. But in 2026, uh, a trend is developing here. We are holding below the calendar yearly opening price at 87,683, and that is our natural retracement point, and that is exactly where the T cross long is at, 88,023. So the further we push away from it this particular, uh, coming week, by the end of the week, we’re likely to see Bitcoin reverse and start moving back up. If not at the end of this week, then the following week. But again, this, this outlook is for one week only, guys. Okay.
Crude Oil ($USO)
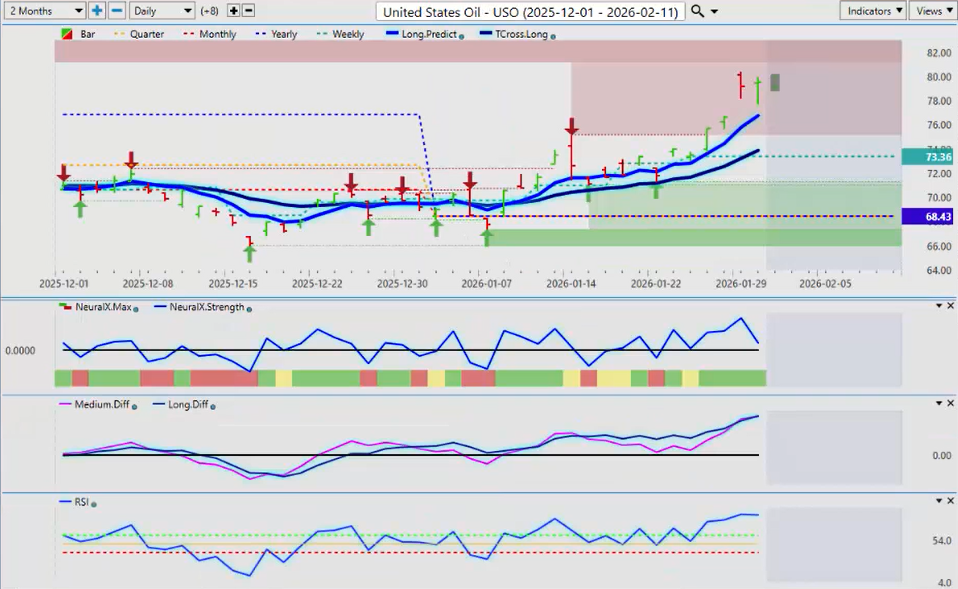
Now, oil is going to likely see a lot of volatility to start the week with what’s going on with China. Uh, again, halting trading in, in oil and silver over the weekend. You might want to read about that to figure out what’s going on there. But I expect a choppy start to the week. But as I had talked about several weeks ago, the very second that Goldman Sachs put out a price target of $30 a barrel on oil, we immediately started buying oil and not selling it. Cuz always remember that these types of institutions very seldomly offer useful information to the retail trader. So the second they said it was going to $30 a barrel, that immediately I mentioned longs on here several weeks ago.
So this is getting, uh, rather lofty here. There are indicators suggesting oil could move lower. So just be careful of your headlines to start the week. But again, uh, it should be a very interesting week for oil, silver, and gold based on what’s happening currently with the Chinese markets.
Euro versus U.S. Dollar ($EUR/USD)
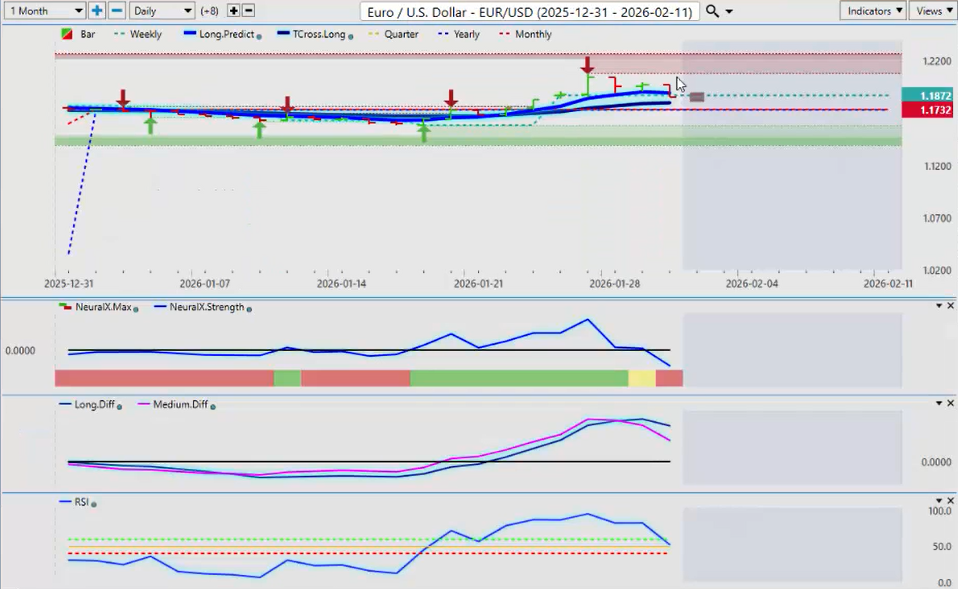
Now, when we look at the euro this past week, the euro has had a pretty, pretty solid month on buying on a dip, but it too, it’s just an inverse of the dollar index. Uh, the first part of the month, you can see it’s down, and then the la, and from the basically right there on the 15th, the 18th, completely turned around and then hits some pretty strong levels up at near the 121 mark.
So, for now, I believe that buying the euro on a dip is a reasonable play once we get past this short-term dollar strength. And again, we’ve got that payroll number coming out on, uh, on Friday out of the US. That’s going to be a big one, guys. If that’s a hotter number, that could push the, the euro lower. But for now, identify your key supports, 117.99, 117.32. The probability that these levels hold are very strong.
Now, the MA diff cross is pointing lower, but again, even if we get that pink line crossing over the zero line, this is corrective in nature until such time as we have a sustained break of the aforementioned level. So always remember that, guys.
U.S. Dollar versus Swiss Franc ($USD/CHF)
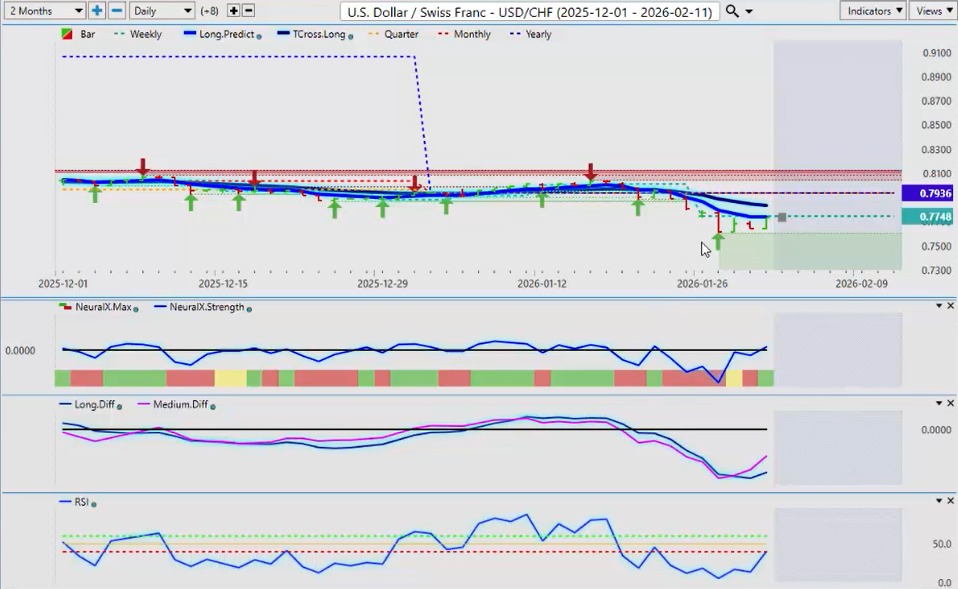
When we look at the US Swiss Franc, again, if there’s going to be dollar buying, this is potential, another potentially another good area to do that. So we have our MA diff cross. I suspect we will, we should be able to get up to the T cross long this week, 78.36. But be careful of that, guys, because again, the main thing is know your levels, 78.36 and 79.36. That’s realistically your sell zone here, not your buy zone.
So I, I suspect we will come up higher between the T cross long and the yearly opening price, but I also think we’re likely to fail at that particular level. But again, looking at the VP indicators, we can see that neural index strength is a very powerful indicator because as the neural index itself struggles a little bit between yellow, red, and green, the rising neural index strength off of this supported low at 76.05 definitely points to a reversal higher. Just we’re not, we will gauge this on a week-over-week basis whether a new trend will form out of this or it’s just simply another corrective move higher at the beginning of the month.
British Pound versus U.S. Dollar ($GBP/USD)
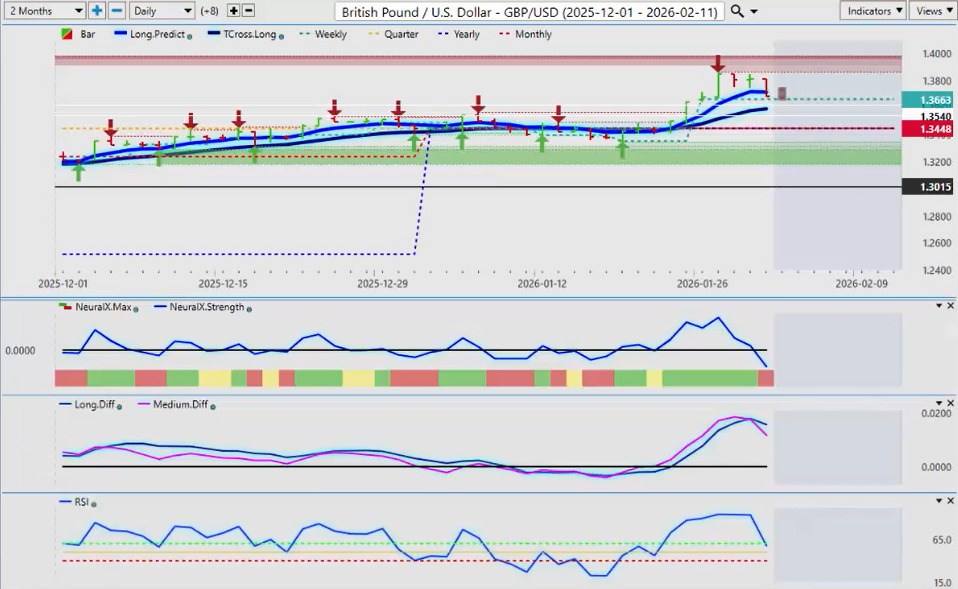
Now, the pound dollar US, I believe we have the Bank of England this week along with the RBA. So, it’s, there’s going to be some choppiness. But for now, uh, this is another thing, guys. When you’re buying or, excuse me, in this case, selling dollars, like which what we’ve been doing successfully since midmon. When you see a long bar that goes up like that, that’s usually a warning sign that that’s it. And when you coincides with month-end flows, kind of a no-brainer that this thing was going to turn lower.
But is there a new trend here because something is moving lower? The answer is no. A new trend would form on a break of the T cross long and a break of the yearly opening price at 134.48. Neither of which has occurred at this particular point. But this is again a corrective signal. The MA diff cross, the pink line over the blue line. That neural index strength, guys, is one of my, be rapidly becoming one of my favorite tools here. It is short term, but it’s highly accurate. It gives us a window inside that neur powerful neural index to see what is actually really going on.
And you can see price pressure is falling. They’re not buying up here. They’re actually selling this thing. So I believe we will come down on this corrective move to the, uh, between 135.89 and 134.48 would respectfully be a likely buy area getting ready for dollar weakness midmon.
U.S. Dollar versus Japanese Yen ($USD/JPY)
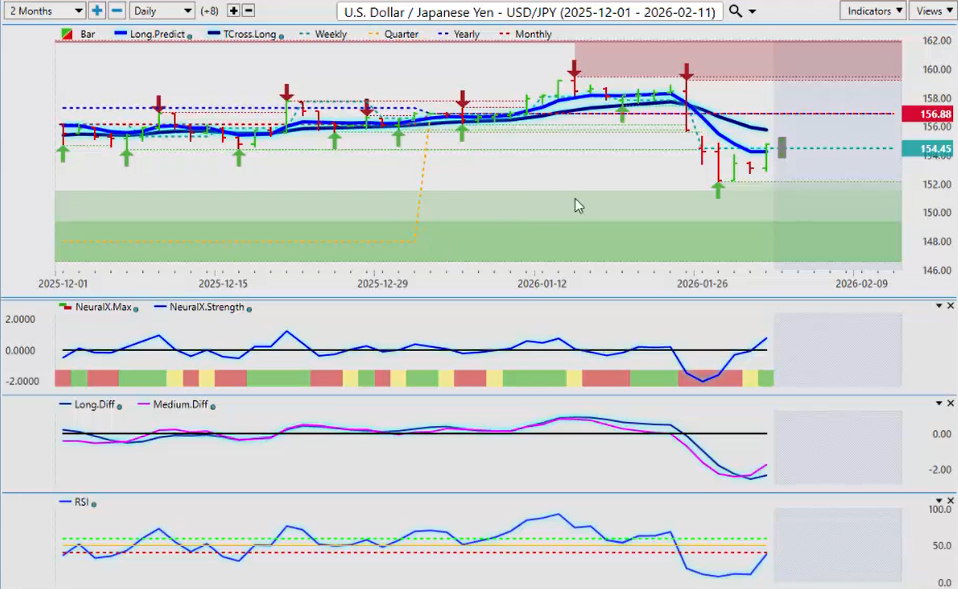
Now, the dollar yen, again, a lot of chatter out there, uh, about things going on with it. Uh, but guys, things like X and things like this very seldomly is a lot of this stuff factual. Uh, but for now, again, you can see that long bar down, and that was it, and then it started rising. When you connect that to the neural index strength and now the MA diff cross, that tells me we are going to come back up and test this area between the TORS long at 155.75 and the yearly opening price at 156.88. And that is supported internally by the VP indicators.
And if that predicted RSI can cross over that center line of the 50 level of the RSI, I think you may have a long trade here. But my optimism on further yen weakness remains heavily guarded.
U.S. Dollar versus Canadian Dollar ($USD/CAD)
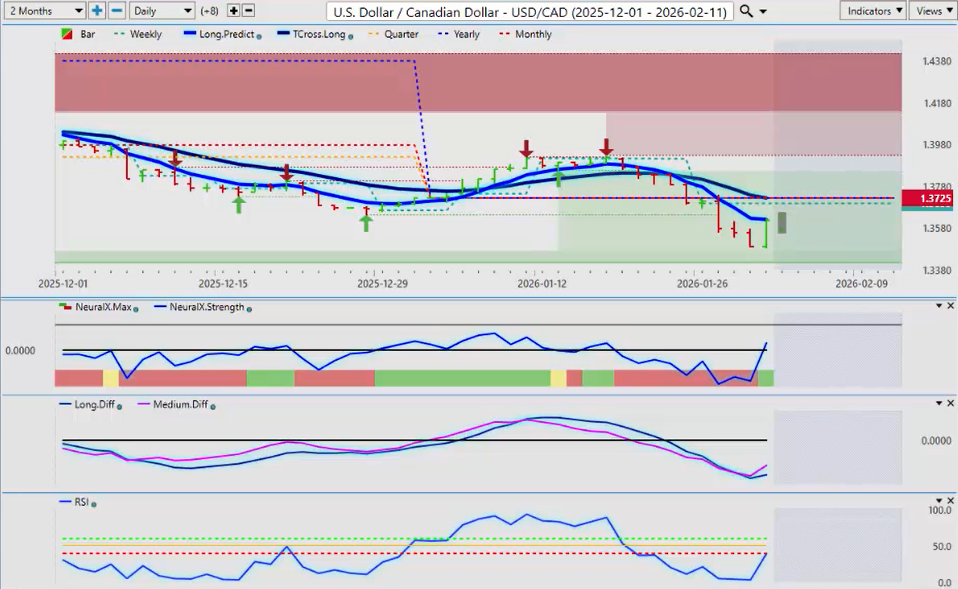
Now, with our three main equity/commodity-based currencies, uh, the US Canadian pair, I believe, is going to start moving higher this week on dollar strength, uh, me short to medium-term dollar strength. And again, we can gauge when these things are going to happen, guys. It’s a repetitive pattern that I’ve tried to convey to the viewers that this occurs almost every month. It may be off by a day or two, sometimes maybe by a week, but it always happens.
So right now, uh, this is a very powerful area of resistance. The yearly opening price is intersecting with the TROS long, 137.27, 137.25. So you’re savvy traders, um, you can sell right at that point. You can have a buy stop ready to go at around 137.50, for example. And if we pass over that area, you would immediately pick up a long. But knowing your levels, guys, that is the key.
That this is a hot bet. That’s where the bulls and the bears are going to fight this out, right along that line. And with that VPT cross long sitting right there, that makes for very, very stiff resistance. But it, the indicators and VP are telling us that we are going up to that level one way or the other. Yeah, we may sell off afterwards, but the first move, uh, probably by Wednesday would put us somewhere around that 137.25 level.
Australian Dollar versus U.S. Dollar ($AUD/USD)
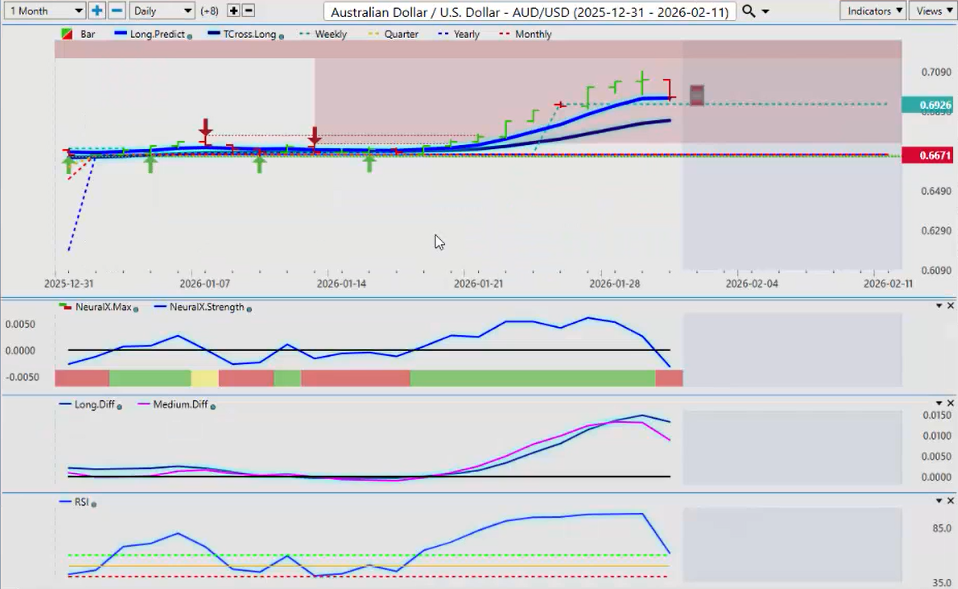
Now, the Aussie is going to see a lot of volatility this coming week. It’s been a very, had a very, very strong, um, uh, month of January starting off the new year. The primary trend is indisputably up. So we look at that and say 66.71, 66.71, yearly opening price. Then we start layering in our supports, our long predicted, 69.58, our TORS long at 68.44.
So on dollar, pending dollar strength, we would likely see our mean revision area, would mean revision points would be between the, the long predicted and the TORS long, and potentially between the T cross long and the yearly opening price. But to be clear, uh, we would be buying this on a dip.
There’s a lot of chatter. The RBA is going to be very hawkish this week. Maybe yes, maybe no. But I would argue, argue irregardless, from a seasonal standpoint, the Aussie does quite well between January and mid to early April. That’s usually when the Aussie is at strongest. So, we’ll continue to run and connect those seasonal patterns to current day pricing.
And if we connect the dots between the past and the future, this is what we end up with, guys. Right?
New Zealand Dollar versus U.S. Dollar ($NZD/USD)
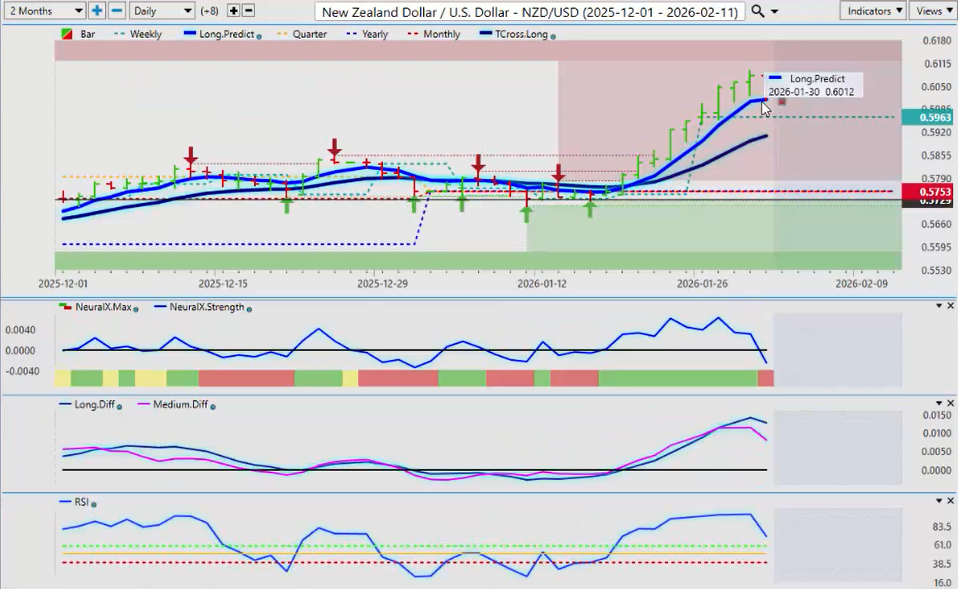
And the Kiwi. Well, the Kiwi, uh, could benefit from, uh, a stronger Aussie, or it could hurt it, uh, via the Aussie New Zealand cross pair. So, keep a very close eye on that. But both the Kiwi and the Aussie are overextended.
The mean revision points that I would advise people are between the two VP predicted moving averages, the, the long predicted and the TORS long. 70 to 80% of the time, that’s where it stops, right in this area. Could we push lower back down to the yearly opening price? I think it would take something a little more catastrophic to, to push it down that far. But never say never.
We will analyze things on a week-over-week basis, guys. We don’t want to look too far forward in time. We want to analyze things and say, “Okay, is this good value buying this up here?” In my respectful opinion, no, it’s not. Neither is the Aussie. But the Aussie carries the edge going into next week, provided it’s supported by the RBA.
So with that said, this is the Vantage Point AI market outlook for the week of February the 2nd.


