









Welcome to the Artificial Intelligence Outlook for Forex trading.
VIDEO TRANSCRIPT
Hello, everyone and welcome back. My name is Greg Firman, and this is the VantagePoint AI Market Outlook for the week of February the 21st, 2022. Now, to get started this week, once again, we’ll do a quick review of the indicators we’re going to be using. We have bars instead of candles. We’ve got our long term crossover, our predicted short, medium, and long term difference with our neural index, and the added neural index strength.
Our point in time predominantly through the presentation will be set to the yearly opening price. The predicted RSI, the triple EMA cross, that’s been modified to remove the short term and the medium term. We’re looking at our main longer term pivot point, the T cross long. And of course, the very popular verified support and resistance zones. To get started this week, we will begin where we always do with the US dollar index.
U.S. Dollar Index
Now, the dollar index really kind of struggling here, surprisingly, with a risk-off environment. We’ve seen the yen strengthen, the Swiss franc strengthen, but we’ve also seen currencies like the Aussie and the New Zealand strengthen, which is very, very odd in this particular case. Other than that, that old correlation that the Aus and the New Zealand had to gold prices and metals. But if we look at the dollar right now, we have cleared.
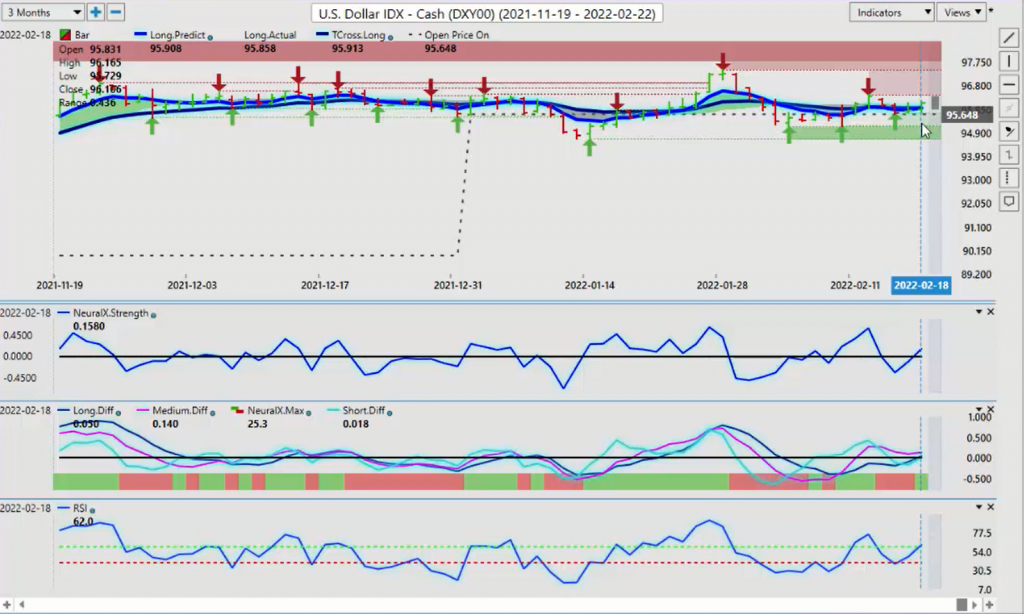
We are holding above the yearly opening price, that level, our point in time, our price on open 95.64. We then have 95.91 as our T long. And of course, the long predicted at the 95.90 mark. A lot of support here, but the dollar just unable to break through to get any kind of momentum going here. Our verified resistance high at 96.43 is easily containing the dollar. But again, I think we’re getting very, very close to a breakout on the dollar, whether that be to the upside or the downside.
Right now, the upside is slightly favored. We can see that our neural index has gone from red to green. But more specifically, our neural index strength is sloping, pointing straight up, and we’ve cleared above the zero line. Now, this occurred several days ago and you can see the dollar is very slowly grinding higher, retaking the yearly opening price and trying to advance. Now, we are going to have a very, very choppy volatile week next week.
What’s happening between Russia and the Ukraine is starting to escalate. We’ve got a holiday in Canada. I believe it’s a holiday in the US also. Again, likely to see a choppy start to the week. The indicators we look here from VantagePoint are predicted differences. Our predicted RSI is starting to show some momentum. We failed at the 40 level to show any real downward momentum.
But again, we do need to watch that yearly opening price very, very closely, because if the dollar or cannot hold above this, then a bigger move to the downside could be coming, but I think it’s unlikely at this given time.
GOLD
Now, one of the things that’s keeping the dollar pinned lower is, of course, gold. We’ve had a full on break to the upside here. And again, very, very interesting how this has come about.
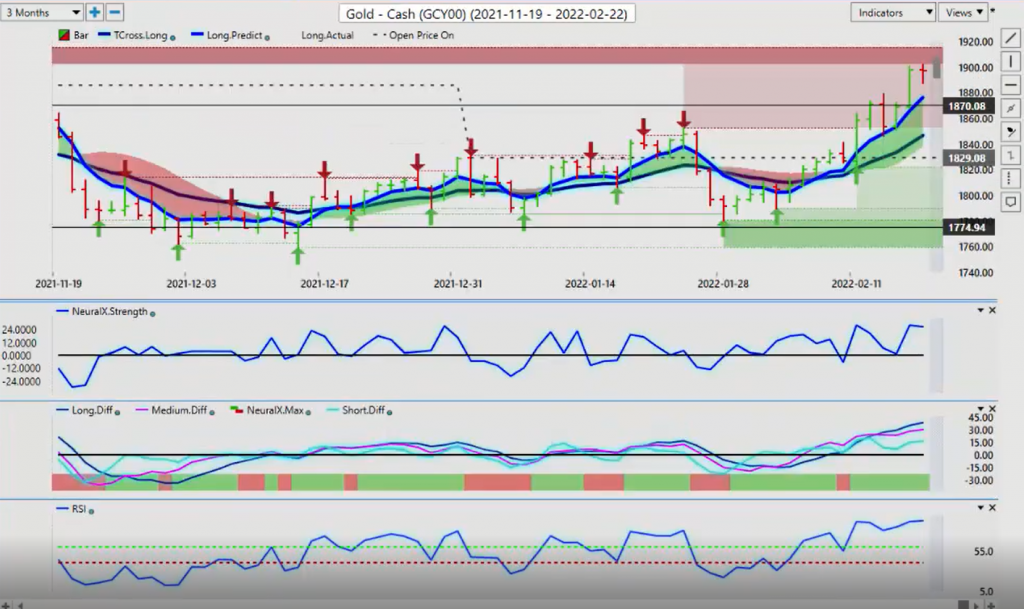
Now, when we look closer at this, you can see the market struggling along that T cross long and the long predicted. Basically bunched up right at the same level. Then we had this crossover that took place, but our predicted differences, our medium term crossing over our long term predicted difference with a rising RSI, the neural index strength, all picking up on this, showing that we’re getting ready for a bigger move. Now, my concern is the seasonality with gold.
Gold usually tends to struggle past the beginning of February, usually around February the 24th from a seasonality standpoint. But with the current geopolitical issues, I think it’s unlikely that gold is just going to sell off here, guys, unless things completely settle between Russia and the Ukraine, and I think there’s about a 10% chance of that happening.
I think we should be prepared for higher gold prices, up over the 1,900 mark, but that will, again, depend on what happens in that geopolitical situation between Russia and the Ukraine. Right now our predicted differences are already telling us that gold’s a little bit overdone up here. Again, we’ll watch this very closely.
But in my respectful opinion, the leading indicator that will tell us, if nothing else, that we’re going to see a corrective move back to either the T cross long at 1,876, or the long predicted at 1,876, excuse me, or the T cross long at 1,846. This is a key level to watch. Now, our price on open is 1,829. Gold has officially turned bullish on the year while we hold above that 1,829 mark.
Bitcoin
Now, certainly not a lot of love for Bitcoin this past week, and gold is still showing that it has some value, right? Bitcoin feeling the pressure a little bit here. However, in my respectful opinion, we are likely looking at a buying opportunity if we can push down into this upper 37,000 mark. From that point on, I think we could see gold turn around to the downside and Bitcoin resume its up trend. But I think we’re still several weeks away from that particular situation.
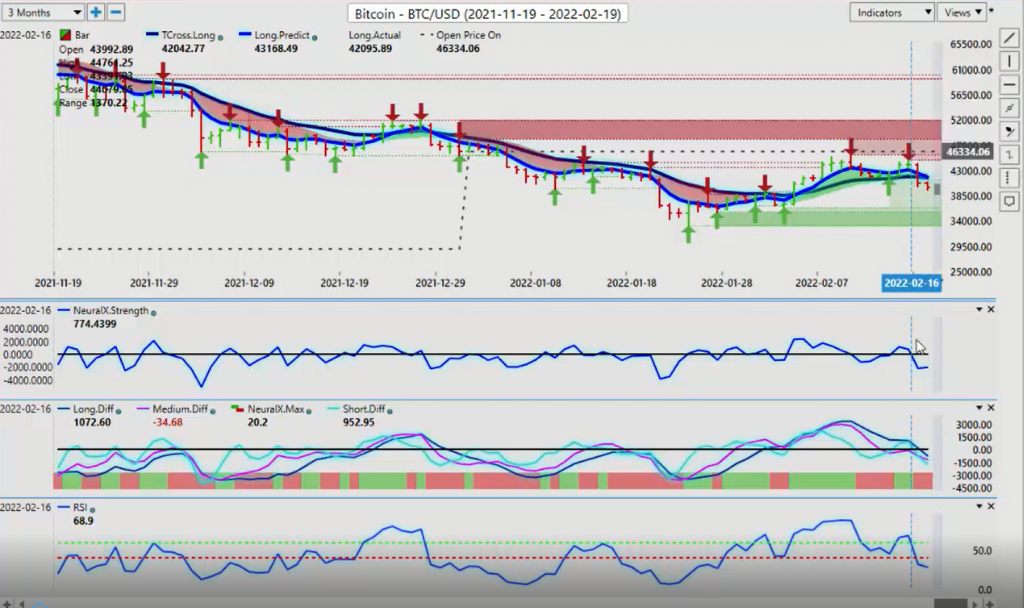
But again, our predicted differences are breaking down below the zero line. We’ve got momentum build into the downside. We don’t have a crossover quite yet, but I believe that will develop over the next several days. Now, again, looking at our neural index strength, when we can see when we have an up day, but the neural index strength starts, again, sloping down and breaking down below the zero line.
Right now, we’re pretty much neutral on this, neutral to bearish on Bitcoin still. But again, we’ll be watching for any indication or any weakness in gold that would immediately tell us to get back over and get long on Bitcoin.
S&P 500 Index
Now, with the S&P 500 next week, I think the S&P is going to continue to struggle. What I’m seeing here, guys, what I can share with you is I’m a seller of the S&P 500 on Monday, Thursday, and Friday, and I take small longs on Tuesday and Wednesday.
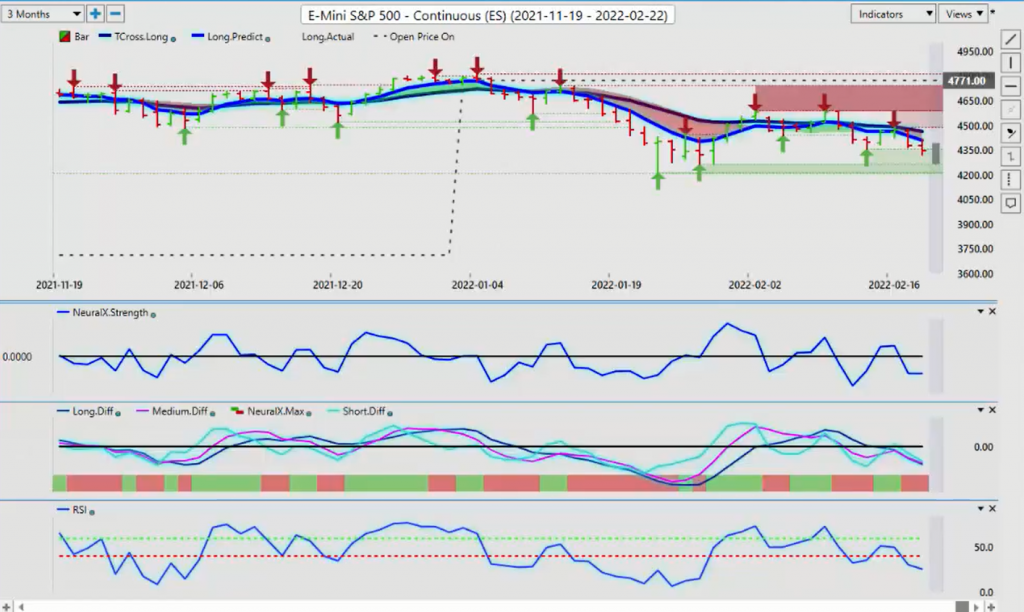
Outside of those days, longs have been disastrous. When we look at it, this is the first year and many years that the S&P 500 has not been able to retake the yearly opening price at all. You can see, we started off at the beginning of the year bouncing up against the yearly opening or the price on open, 4,771, and we’ve just been going down since. We’ve had retracement. But again, heavy resistance up at the 4,586 mark.
I’ll respectfully submit that that’s the level you want to target for shorts. But again, if things settle down from the geopolitical standpoint, then that would give the equities a big boost. But the question is, would that be enough to boost over the 4,771 market? At this particular time, I think that that’s very unlikely because we’re going into a period of known weakness in the global indexes. That usually runs until April, May.
We’ll continue to monitor it, but the key pivot level here, the VantagePoint T cross long 4,462. We would have to break above that and close above that for two day is in a row, and we would still only be retracing back to the yearly opening price. Remember, if the market can’t get above that price, then we can’t be calling it bullish on the year because of past years. In this particular calendar year, the S&P 500 is indisputably bearish.
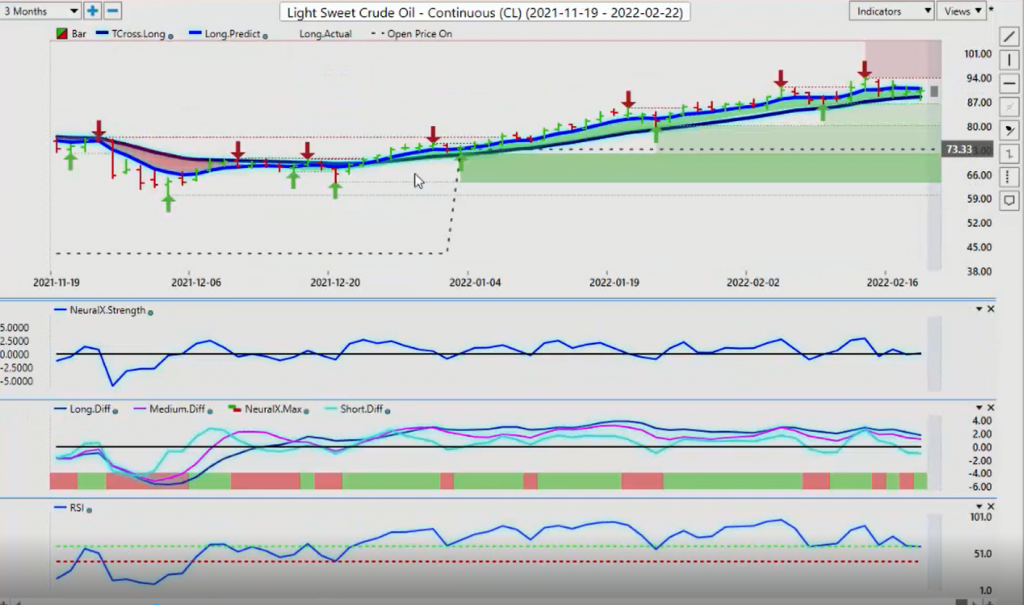
Now, with all oil, oil usually does follow the… But you can see there’s a very stark contrast between oil prices and the S&P 500. There is little to no correlation between these right now. This is new to me, guys. I don’t see this very often. But again, we’ve got a whole bunch of other issues going on out there that’s distorting price, COVID, Russia, Feds raising rates, Feds not raising rates, ECB raising rates. There’s a lot going on here.
Crude Oil
Until some of this starts to calm down a little bit, I think that oil will remain firm. We’ve tested the VP T cross long at 87.98 three days in a row. But you’ll notice that the moves to the upside are getting much smaller this entire week. We hit a high up at 93.96, and we’ve just consistently and slowly grinding lower. If the stock markets collapse, I don’t think that’s going to cause… It’ll cause a bit of a dip in oil, but I don’t think oil’s going to sell off, not with what’s happening in the Ukraine.
When we look at our main Forex pairs, what we’ve seen over these many years is basically the Euro selling off with gold prices. But whenever gold turned around, the Euro turned around. In my respectful opinion, there isn’t a very high correlation at this time. The Euro appears to have attached itself yet again to the global indexes, more specifically the S&P 500.
You can see that usually if we have gold prices making a big rally, even during the period of COVID from 2019, 2020, until almost at the present, whenever gold went up, the Euro went up. When gold went down, the Euro went down. Right now it is more about the S&P. So if the S&P 500 does turn around, that would benefit the Euro in this particular case.
Euro versus U.S. Dollar
Now, there is some chatter about the ECB talking about ending QE, raising rates near the third quarter, fourth quarter of 2022.
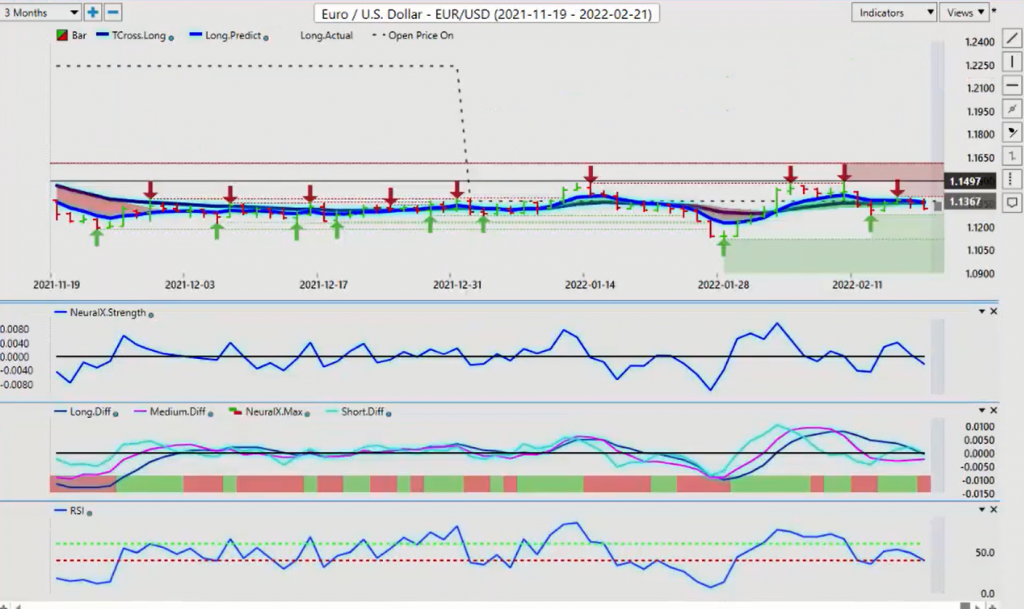
I’ll believe that when I see it, guys. But for now, the Euro is holding its ground. You can see we’ve got our predicted neural index strength is pointing straight down actually. Our predicted RSI is showing we’ve got… Eh, we’re not breaking that 40 level. Now, again, this verified support low, 1.1280, keep a very close eye on this particular support level to begin the week.
But as we start the week, looking at the neural index strength where we’ve closed under that T cross long and under the yearly opening price, it does paint a bearish picture. But the Euro is very similar to gold. No matter how much it gets hit with, you can’t really count it out. Right now we’re seeing good two-way buying and selling on this pair. But I believe that a trending move is very close.
Now, that trending move will be determined whether the Euro can close above its yearly opening price at 1.1367. If it can’t close above that level, guys, we’re likely heading towards the 1.11 mark. But if we do close above it and stay above it for several days in a row, then we should be looking at towards the 1.15 area. Now, with US-Swiss franc and dollar-yen, very similar, almost identical trades here, guys.
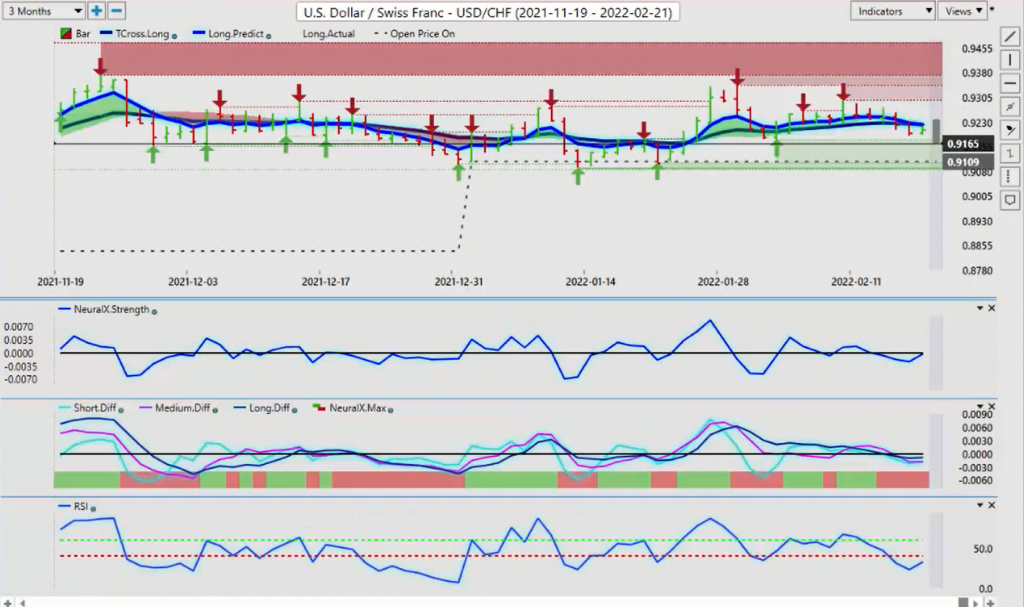
You can see that the Swiss Franc is making gains, one of the few currencies that’s actually making gains against the dollar, but it’s a risk-off scenario with what’s happening, again, in the Ukraine. If that starts to settle down, the Swiss franc will immediately weaken. But when we look forward into 2022 and not get too caught up in this intraday nonsense, then ultimately the US Federal Reserve is going to hike rates, which will bring the carry trade to some degree back to life.
What I mean by that is the interest rates, LIBOR rates in the US are definitely going up. They are definitely not going up with the Swiss National Bank. If the US gets to 1% on their interest rates and the Swiss National Bank remains firm at negative 0.75 or negative a half a percent, then it would not be very lucrative to be holding shorts on this pair. We would be looking at longs. Once again, our year on open price is 0.9109. That’s the level we want to keep our eye on.
But in my respectful opinion, as soon as things start to settle down, we should be able to close back up above the T cross long at 0.9223. But I would strongly advise, again, don’t get too caught up in this intraday stuff here, guys, because there’s so many things going on. It would drive the average person to drink. Make sure you’re always looking at the bigger picture because this is just short term noise is all it really is.
U.S. Dollar versus Swiss Franc
Once things settle down, the dollar is likely to come out top against a number of these pairs, one of them being the US-Swiss franc. Now, as we look at the pound-dollar for next week, the pound holding on the VantagePoint T cross long. As you can see, holding above that weekly opening price. But then towards the end of the week, it’s just struggling to get past these verified zones. The high there, 1.3661, I’ll respectfully submit that we stay short while below that level.
British Pound versus U.S. Dollar
But again, when we look at the yearly opening price here, there is a degree of bullishness with this pair. The price on open, 1.3531. The problem is that we keep coming back to it. So while it is going higher, this pair right now is contained between 1.3661 and the price on open, the yearly opening price. We did dip below it down here on some of the headline news, but this is the level I would watch right down here at 1.3486.
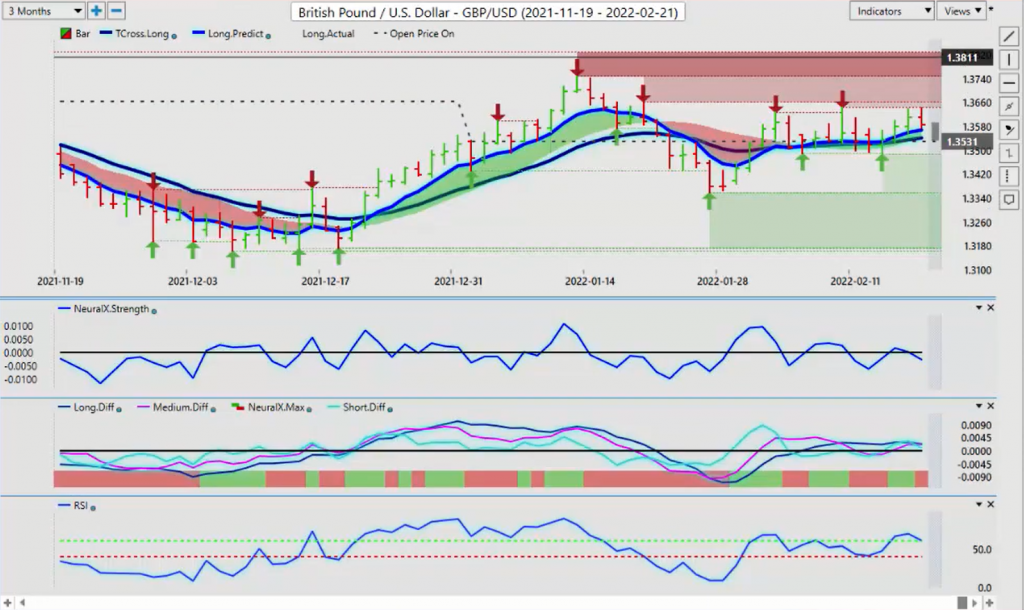
We’ll continue to play the 1.3486, 1.3661 range until such time as it breaks. But to begin the week, it would appear to me that the initial move on the pound-dollar, once we get past the holiday Monday, the move would be to the downside. The question is, can we break through that T cross long at 1.3541? But I suspect either way, we are at least going to trace to this level, because again, the neural index strength is down, predicted differences are chopping sideways, and again, we’re really losing momentum up here.
We can’t seem to get any real momentum above the 1.3630, 1.3640 levels. Again, watch these verified zones very closely.
U.S. Dollar versus Japanese Yen
Now, with the dollar-yen for the Forex trading, probably one of the most frustrating payers for Forex traders. Most of your automated programs, your EAs, struggle to make any money on dollar-yen because it’s so erratic. Well, I hate to break the news to you, guys, but it will definitely be like this for another few weeks until we clean up this thing in Russia, if it can even be cleaned up.
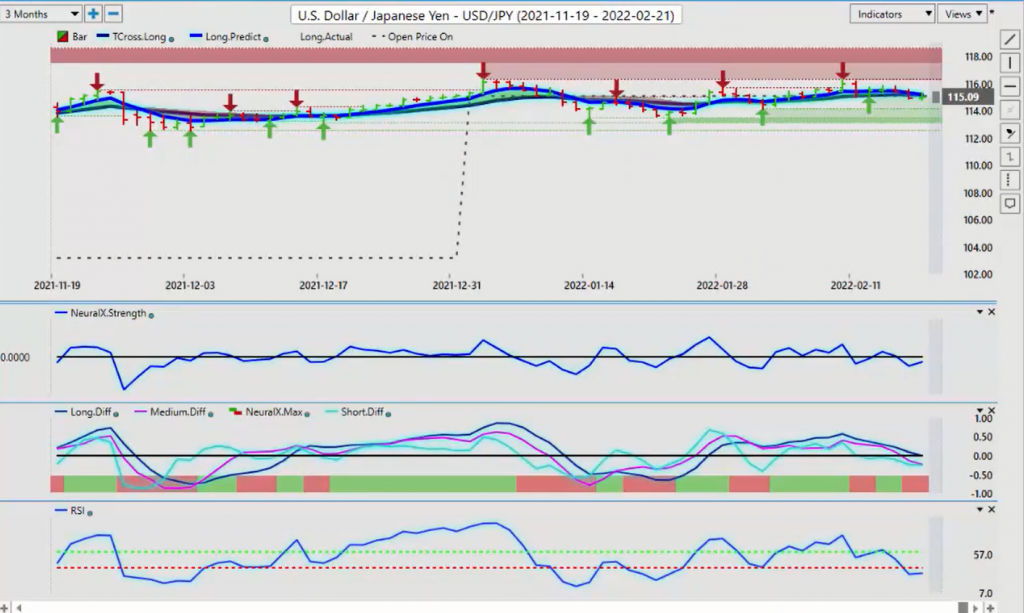
Right now, not surprisingly, VantagePoint has been forecasting that this is moving lower, because, again, the yen is a risk-off currency. The yen, the Swiss franc, and usually the US dollar all follow gold, but that’s not quite the case here this time. But I will submit that the dollar has done better than usual in a situation like this against the yen. But the yen, again, we’re not seeing a lot of buyers this past week. We’re now closing the week…
Basically we’re closing the week out here at, once again, right around this particular level here, 114.99 and our T cross long is at 115.15. Technically, we’re closing below the key level. Our price on open 1.1509. Again, a lot of support/resistance right in this particular area. But 115.09, if we can’t get back above this quickly, then the yen is likely to take a deeper move down, probably down towards this mid 113 level. The indicators from VantagePoint are suggesting that.
Our predicted differences are dropping. But again, that neural index strength is saying, “Well, it’s weak, but it’s maybe not as weak as what they’re trying to tell us it is, because it’s starting to slope back up.” We are below the zero line. So again, we’ll be monitoring this very closely. But if the yearly opening price, if the market can get back up above that and stay back above that, gold can back off a little bit. These are all the main factors you need to trade the dollar-yen.
If we’re going to buy this, we need gold lower, we need equities higher, and we need the dollar index holding above its respective yearly opening price.
U.S. Dollar versus Canadian Dollar
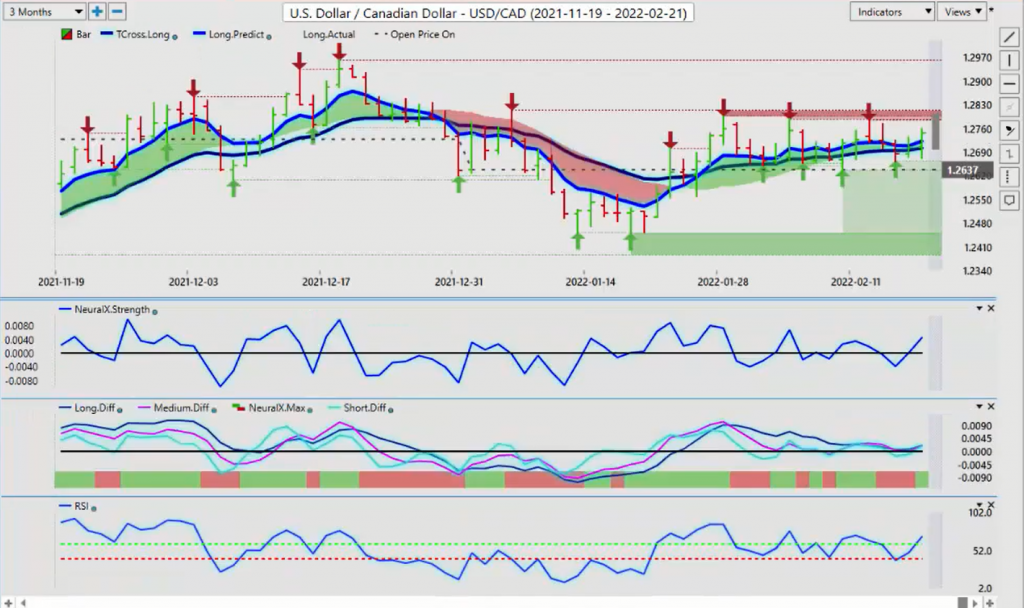
Now, when we look at the US-CAD, once again, we’ve got sellers at the beginning of the week, and we’ve got buyers at the end of the week. This is basically the scenario that I keep seeing. But an easier way for the masses to digest this is saying, okay, our yearly opening price or our price on open 1.2637.
We remain long while above that particular price. Our VantagePoint T cross long coming in at 1.2702, the long predicted 1.2723. With our close, we’ve closed the week out at the 1.2748. This is how we identify our support. The level one support is your long predicted at 1.2723. Our secondary key support is the T cross long at 1.2702, and the trend definition defines whether this is bullish or bearish is 1.2637. Meaning if it stays above that, we buy.
But if it starts closing below 1.2637, then we’re looking for fresh shorts. Now, I think that that’s highly unlikely given the volatile situation in Canada right now. Police moving in on protestors. We’ve got mediocre unemployment. We’re in lockdown one week, not in lockdown the next. Very difficult to follow this. The Central Bank, the Bank of Canada, flip-flopping all over the place on interest rates. One week they’re hiking.
The next week they’re saying, “Well, maybe not until April or May.” Guys, they already were supposed to have hiked by now. The major banks, the Bank of Montreal, TD Ameritrade, some of the big banks, they’ve already forecasted that the US-Canadian pair was supposed to be at the 1.19 level right now. These are, again, when you base all your decisions only on fundamentals, then you’ve got to be careful.
Because technically speaking or an inner market analysis standpoint, it’s just the Canadian dollar is struggling here. And again, we know the key levels. All we have to do is wait. But the slope, when we look at our neural index strength to begin the week, that is a nice straight upward slope here. We’ve crossed above the zero line. Once again, we’ve seen this move that started when the actual main neural index was still red.
You can see that this started on Wednesday night, then on Thursday and on Friday. But again, I’m seeing this almost every week, guys. The Canadian dollar will follow the equity markets. When I say equity, I mean the S&P 500. Basically if the S&P 500 tanks every Thursday and Friday, US-Canada is inversely correlated. It goes up. So one down, one up. That’s the way it works. I continue to monitor this, but it can be incredibly profitable if you know what you’re looking for from this.
And again, I’m definitely seeing that pattern that not only is the S&P 500 bearish, which makes US-Canada indirectly bullish, there’s a pattern to it where it’s happening almost every week. The second they get nervous on equities, they bail out of any shorts on US-Canada. Once again, we’ll keep an eye on those main levels, but I think there is still a bias to the upside.
Australian Dollar versus U.S. Dollar
Now, the Aussie dollar continues to frustrate most traders, Forex traders, commodity traders currency futures traders, all of us, because when the equity markets crash like they’ve been doing, or going up and then making a hard move down, this pair is telling me one of two things: that the S&P 500 is getting ready to fully recover, or that inner market correlation between the Aussie dollar and the S&P 500 is breaking down. Aussie is actually following gold.
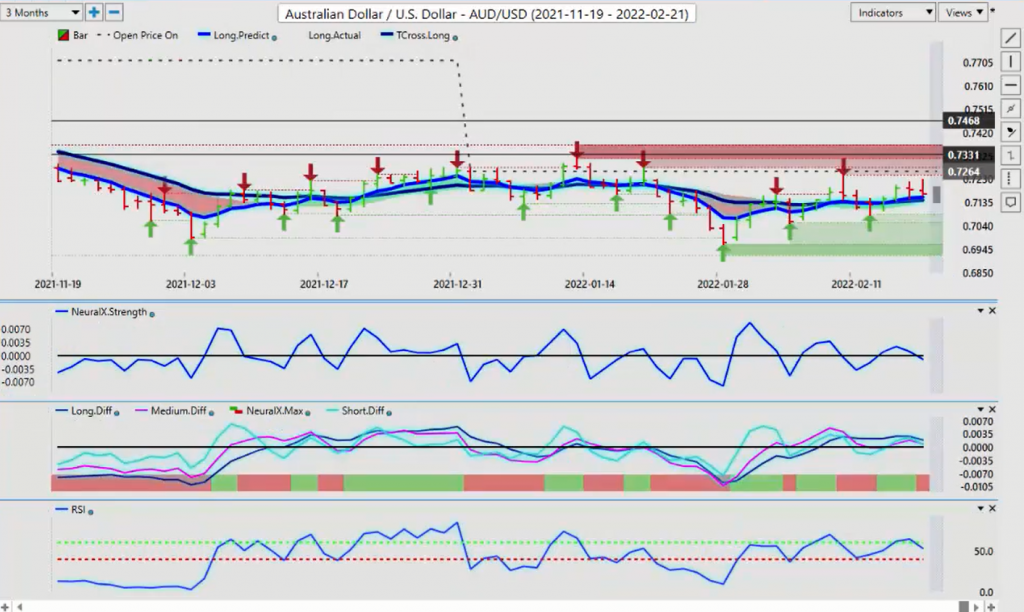
I would suspect the latter to be true, because it’s the only explanation here, guys. In most cases, in a risk-off scenario, the Aussie does not do well. And as you can see, it’s even confusing to some degree the neural index strength. Now, the reason I say to some degree, number one, this indicator has almost zero lag, which is what I love about it. Sometimes that’s good. Sometimes that’s bad. I’ll get into that later.
But the main thing it’s telling us is that the neural index while still green is actually moving lower. It’s losing its momentum. And then you can see very good shorts on Thursday and Friday, but those are also highly correlated to that S&P 500. As it finally started to lose its momentum and start selling off on Friday even harder, the Aussie finally gave it up and it started to move lower. But each one of these days, we did make a higher high.
New Zealand Dollar versus U.S. Dollar
But again, this is the key level, your price on open. The price on open here is 0.7264. It’s still bearish well below this level. One of the ways you can play this, because again, this is an outlook, not a recap of something that happened last week or last month or three months ago, you can continue to sell into 0.7264 and then have a buy stop ready to go at about the 0.7305 area.
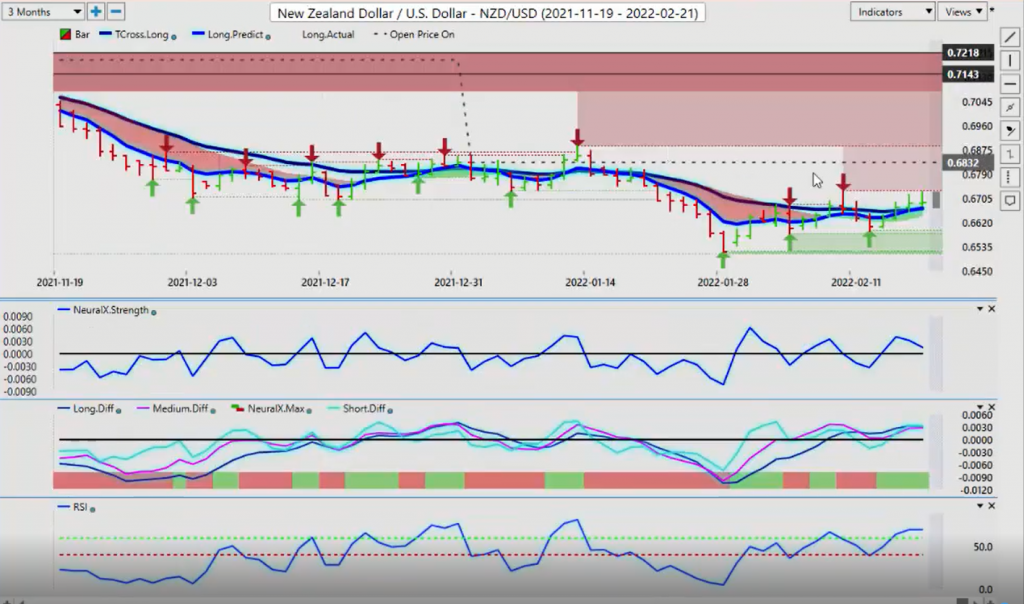
You play this short as long as you possibly can, and then you cut your short and go long at the appropriate level. But we would have to clear some very large levels. 0.7314 is the last verified zone, so I’ll retract my earlier statement and say, okay, you would sell up to 0.7314, buy stop ready to go say 0.7325, something along that line. That basically allows to give you a little bit of breathing room on the short while straddling these key levels.
I would respectfully submit the same thing would apply to New Zealand. Now, the New Zealand is showing even more strength, which is surprisingly, because again, that neural index strength, at least to begin the week, you can see the slope and angle of this thing. It’s losing momentum, but the main neural index is still green. You’re actually seeing two completely different signals here. And again, that’s a pretty decisive angle on the way that pointing down.
And we have a significant verified resistance high at 0.6732, along with our price on open or yearly opening price at .6832, which is again providing significant resistance in the calendar year 2022. With that said, this is the VantagePoint AI Market Outlook for the week of February the 21st, 2022.


