


Welcome to the Artificial Intelligence Outlook for Forex trading.
VIDEO TRANSCRIPT
VantagePoint Ai. Market Outlook for February 23, 2026
Okay, hello everyone, and welcome back.
My name is Greg Firman, and this is the VantagePoint AI market outlook for the week of February the 23rd, 2026.
Now, to get started this week, we will begin where we always do, with the US dollar.
WisdomTree U.S. Dollar Bullish Fund ($USDU)
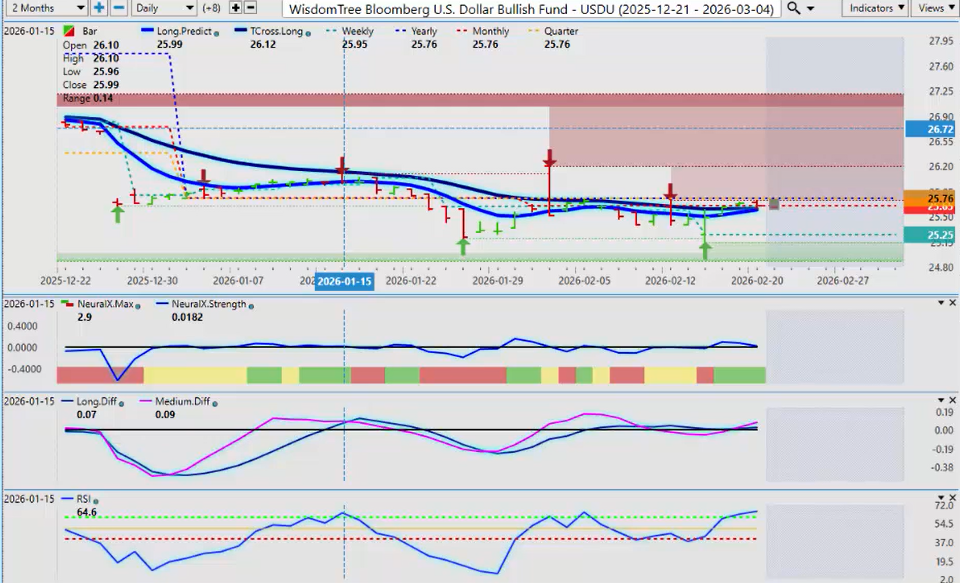
Uh, what I’m using here through the VP software is the ETF, the USDU. Now, this one is rapidly becoming my favorite way to forecast the dollar. Now, what we’re looking for is for this particular ETF to turn positive on the calendar year. We’ve closed at 2565. The yearly opening price is coming in at 2576. We have not been able to break above that and stay above it. Now, a lot of things going on last week with the CPI data, the Fed minutes, uh, and ultimately the tariffs being voted down. So next week, I suspect there will be no shortage of volatility. But let’s look at the VP indicators because we do have a conflicted signal. We have a medium and a long-term crossover just above the zero line. The neural index is green. However, the neural index strength is actually pointing down, that we’re losing momentum. So this will be a critical level to break.
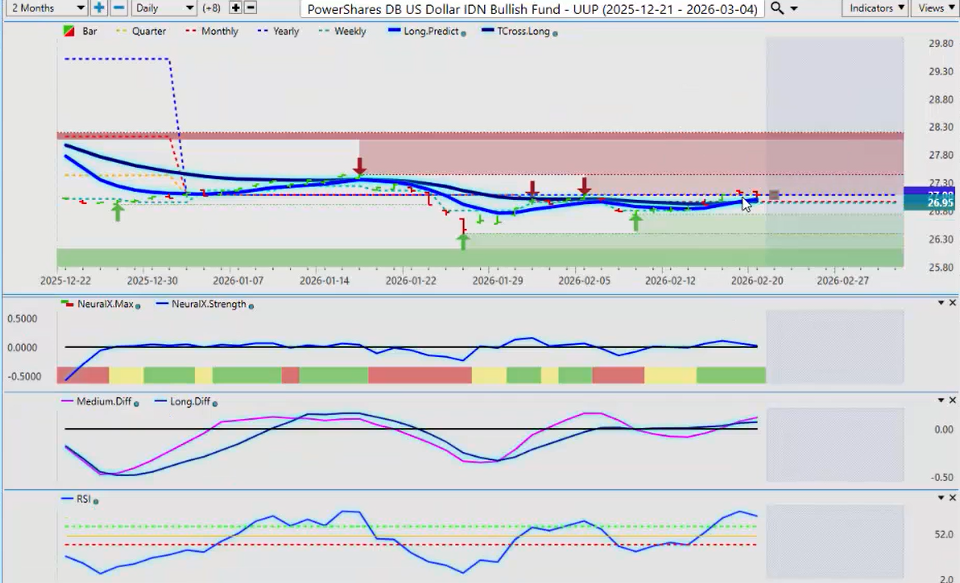
Now, if we look at the UUUP, we can see that it did try, and it did close above the yearly opening price on Thursday, but immediately retreated on Friday. So again, looking at both of these two gives us a much better idea.
Gold ($XAU/USD)
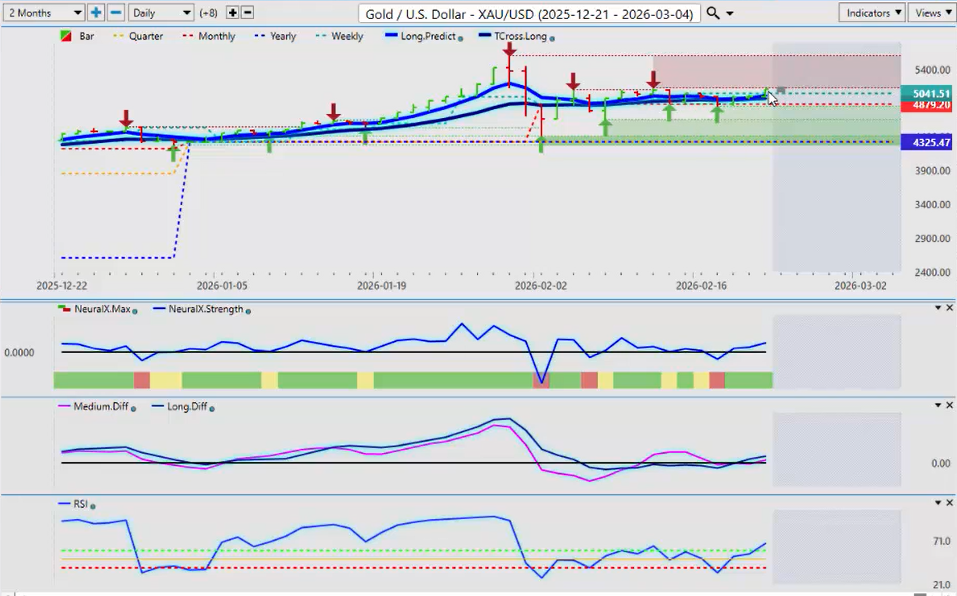
Now, if we layer in a direct inverse correlation, uh, gold and the US dollar, this is a very clear buy signal on gold, which should lead to a softer dollar. Now again, the other thing we have is the US warships circling around Iran. They’re talking about a potential strike in the next 10 to 15 days. That too will keep the dollar firmer. But ultimately, if that is resolved, it’s the dollar that will move lower, not gold. So for now, structurally speaking, gold is very strong. There’s a fresh buy signal here. Uh, but these are all in agreement. And this is what I want to show everybody, the difference. The neural index strength here crossing the zero line and pointing up. The neural index itself is green. We have a medium and a long-term crossover. And we have momentum that is building on the predicted RSI, breaking above that 60 level.
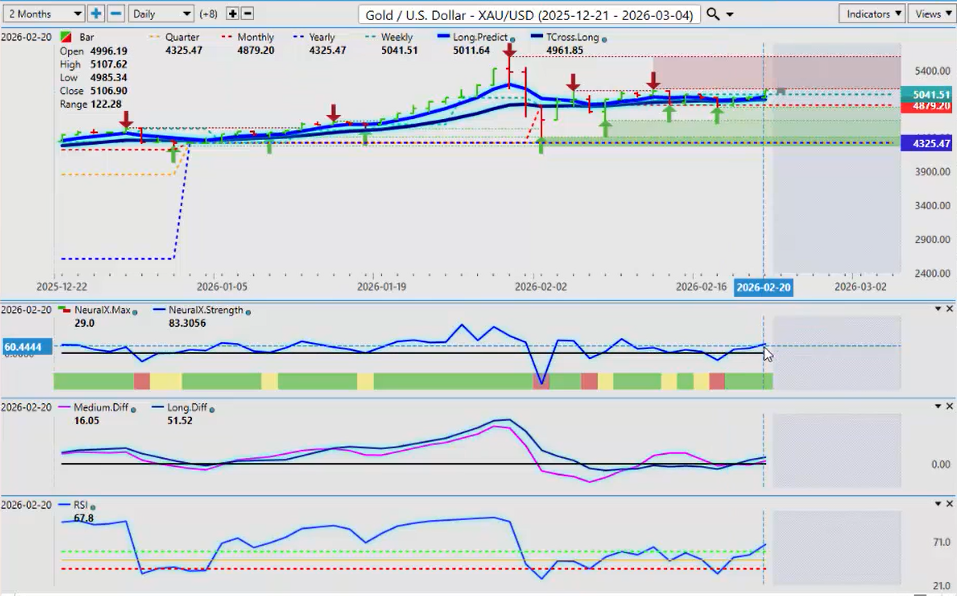
Now, when we look at the actual market, we’re above our TCROSS long at 4961. We’re above the monthly and the yearly opening price. So this is a good-looking signal. I anticipate silver too will follow gold higher.
DAX
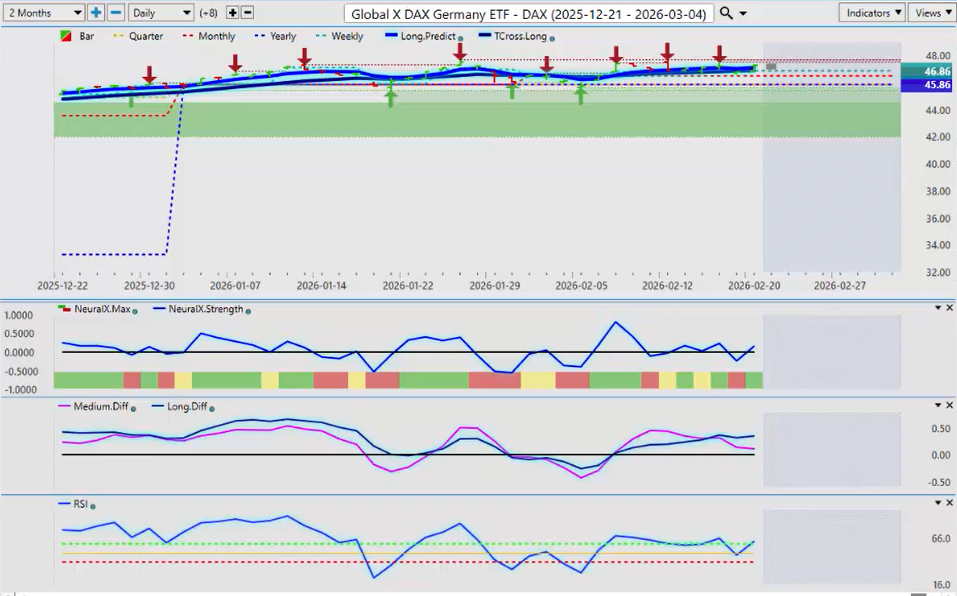
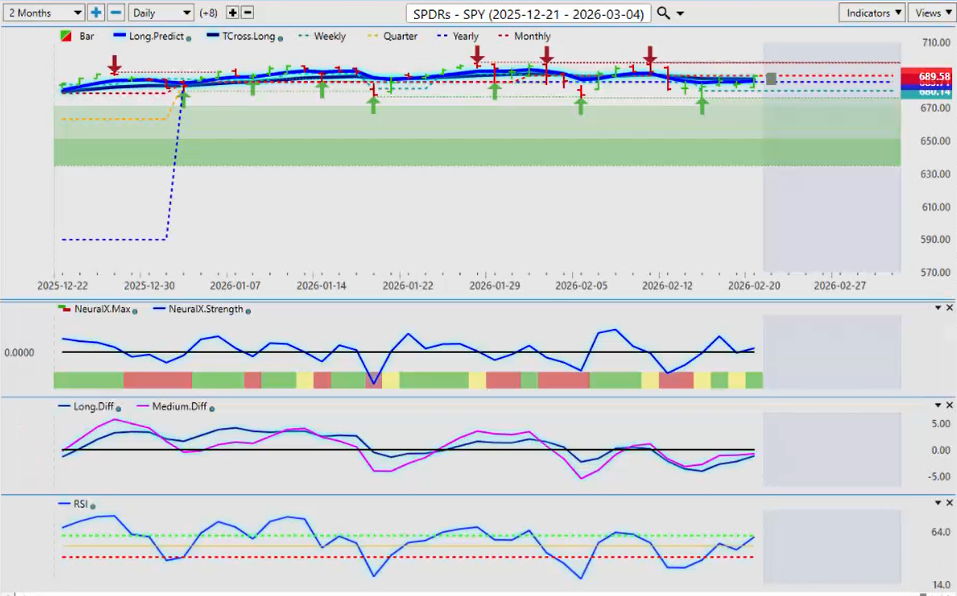
Now, when we look at some of the immediate US equity markets and, of course, the European equity markets, looking at the DAX, the SPY is really struggling along here. Uh, it’s moderately bullish. We managed to just creep above the yearly opening price at 68571, but I suspect it’s going to come under a little bit more selling pressure.
The NASDAQ and the S&P 500 have not been the go-to equity markets, in my respectful opinion. What I’ve discussed on here, the Russell 2000 is much better looking, as is that there’s been a very high correlation also to the DAX.
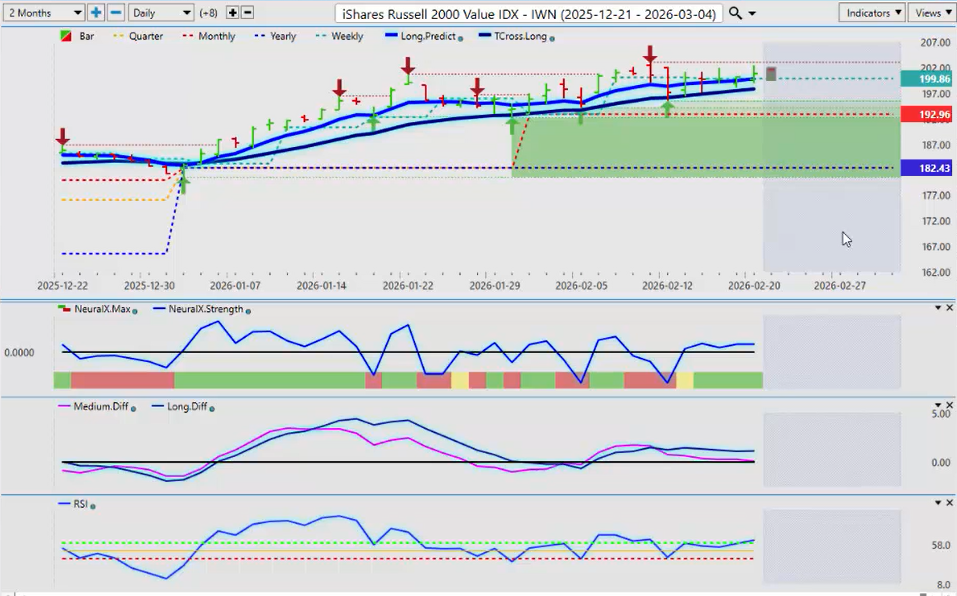
Those are the two that I’ve really liked this year. So when we look at this trend, it’s very easy to identify what this is, with very little choppiness. We remain bullish on the Russell 2000. Now, none of the little bit of a concern with our MA diff cross, but that’s a direct contradiction with the predicted RSI showing momentum to the upside. And again, we’re above the monthly, the yearly opening price, but more specifically, we’ve had several retests of the TROS long only to go higher each time. So, the key level for next week, 1978.
Now, again, the German DAX 30 has been a very strong index also. So, the ETF side is basically telling me how I want to trade those DAX futures. I want to remain on the long side. A little bit of a concern here, of course, with that MA diff cross, but this would be corrective in nature. It’s only a new trend if we break down below the T cross long at 4690, and we also break below the monthly and the yearly opening price. That is not happening. We’ve had a retest back here at the beginning of the month, only for it to extend higher. So, of the two main indexes, or of the main indexes, excuse me, the Russell 2000 and the DAX do look to be the better play.
Volatility Index ($VIXY)
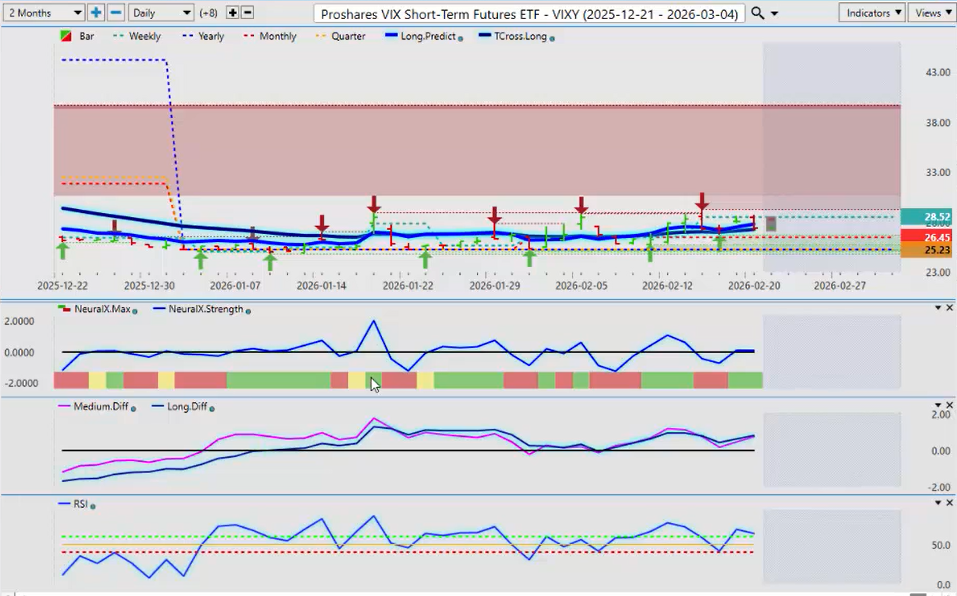
Now, we also want to make sure we’re measuring the VIX to see what’s happening. And again, the VIX is warning us that more volatility is on its way here. Uh, we’re holding above the yearly and the monthly opening price, but a very mixed signal. There isn’t a lot of momentum here at the current time, but it is still positive on the year, and that’s showing up in the QQQ, the NASDAQ, the S&P 500. But I should also mention, too, that the Dow Jones Industrial Average has done very well also. Those are the three that I would focus on, but heavily weighted towards the DAX and the Russell 2000.
Bitcoin ($BTC/USD)
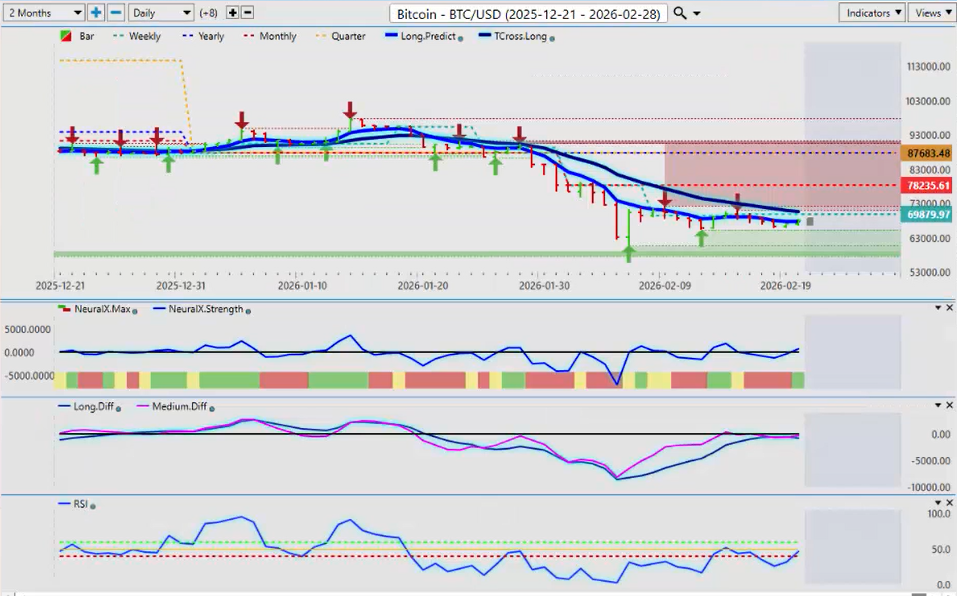
Now, when we look at Bitcoin going into next week, what I can forewarn everybody is that there has historically been strong buying of Bitcoin in the month of March. We’re not in March yet, but I’m keeping a very close eye on these VP indicators. Right now, the neural index strength is moving higher. The neural index, as we can see, is in agreement, but we’re not getting those crossovers to the upside, and we still remain below the T cross long, the monthly, and the yearly opening. So our resistance point, the first one we need to break and close above, is the long predicted 67,734. That would allow us to target 70,698. This is the order in which I’m looking for it to move towards by the end of the month. But if we can’t get over that TROS long, then it’s still a problem. But I will tell everybody again, keep an eye on Bitcoin. I’ve seen strong buying in even in down years like this. I’ve seen strong buying not just in October, but also in the month of March. So keep a very close eye on that. And again, I’ll update everybody weekly.
Light Sweet Crude Oil
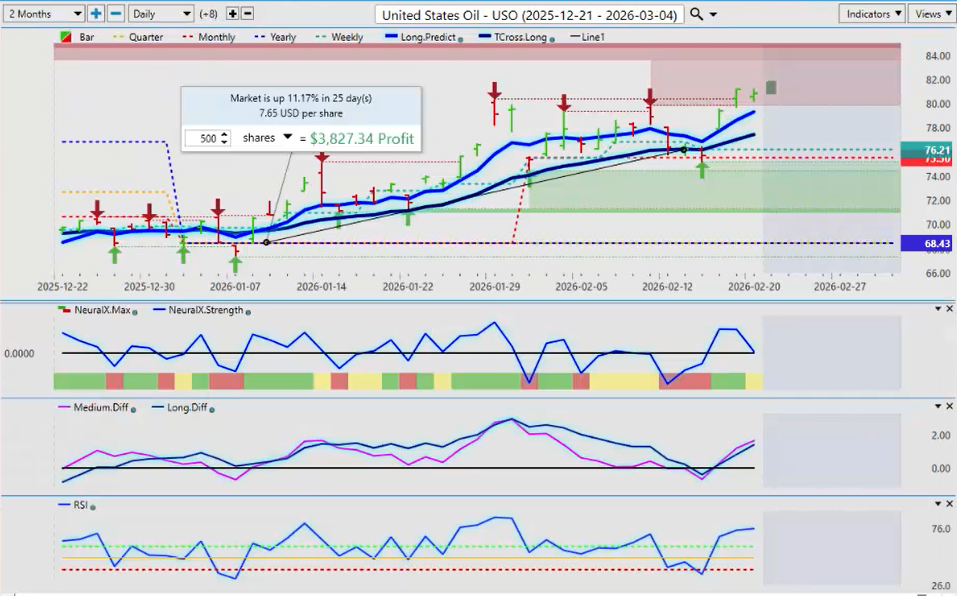
Now, if we look at light sweet crude oil via the ETF market, it continues to advance. I believe that oil will remain very firm in the next few weeks with everything that’s happening between the US and Iran, the tariffs. There’s a lot going on here, guys. But the bottom line, the US economy is expanding, and I believe that oil will follow its normal seasonal patterns, where it’s stronger through mid-March through mid-June, early July. So right now, our key retracement points, the long predicted 7931 and the T cross long at 7745. I believe we can come a little bit lower on this, but buying the dip would definitely be the preferred strategy.
Euro versus U.S. Dollar ($EUR/USD)
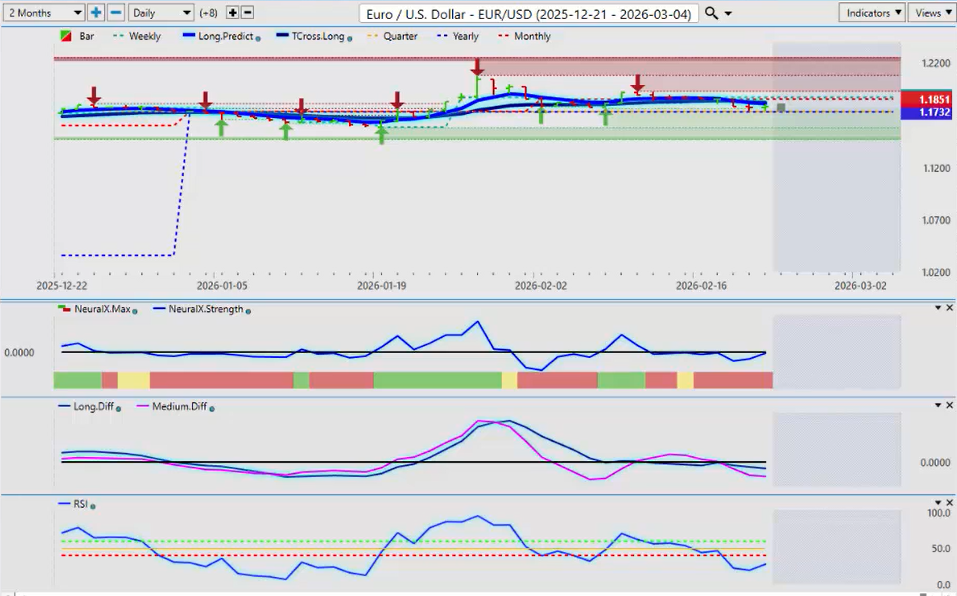
Now, as we look at some of our main FX pairs this week, all eyes will remain on the euro next week, guys. And again, we can see that we’ve come down, hit the opening price, but a very shallow bounce off of that near the end of the week. Now, again, our MA diff crosses crossed to the downside. We have a medium and a long-term crossover. But once again, we can see that that neural index strength is not really in agreement with these other indicators. And we remain the primary trend on the year on the euro is up. That’s indisputable while we’re above that very important yearly opening price at 11732.
Now, for the more savvy trader that knows his or her levels, then you can set up a sell stop below 11740. And if it breaks down below that, then you know that we’re probably going to have a deeper run to the downside. Even if it’s only short-term, it would likely be potentially maybe even a couple hundred pips. So, keep an eye on that. But remember, your line in the sand is 11732.
U.S. Dollar versus Swiss Franc ($USD/CHF)
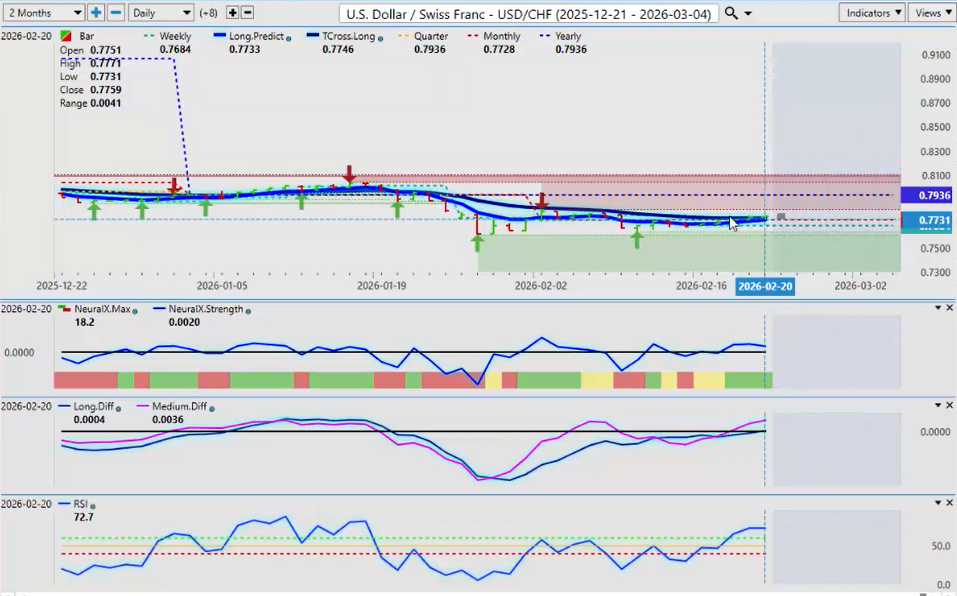
Now, the US/Swiss franc, again, a very slow advance this past week, but it did advance just the same on dollar strength. But be very careful if we go into a risk-off scenario. Not only will the dollar strengthen, but so will the yen and the Swiss franc. So that would be my concern right now. Any move higher here is a retracement in nature. It’s not a new trend, guys, until we turn positive on the year, 7936. I believe we may be able to get towards that by the first few days, first three or four days into March. I don’t know if we’ll get there before then, but we’ll keep an eye on that. And the main thing is, guys, again, as I always say, the catchphrase I like to use is know your levels. And that 7936 level, along with the TROS long at 7746. These are the big levels that we want to keep our eye on.
British Pound versus U.S. Dollar ($GBP/USD)
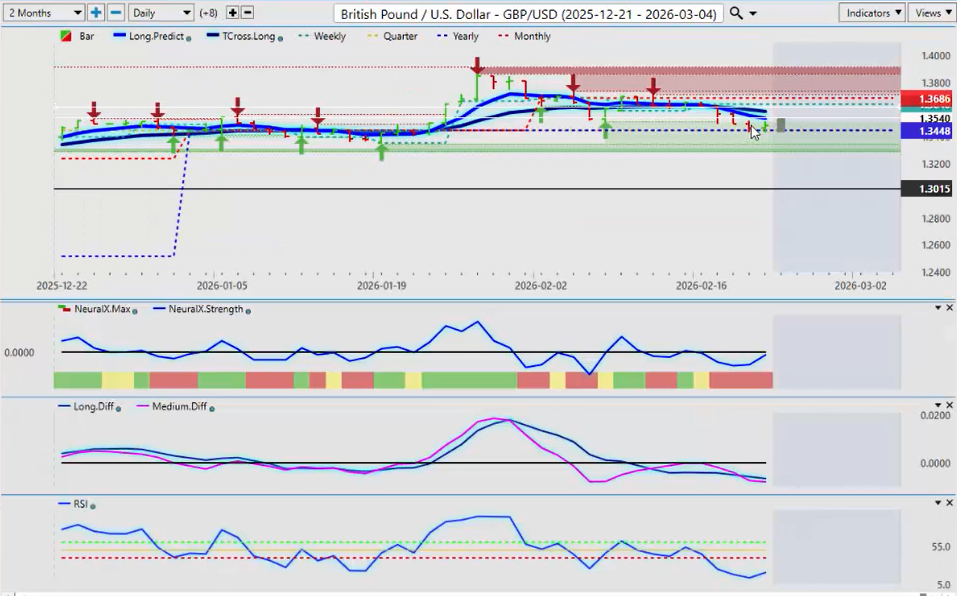
Now, the pound/dollar, again, the data hitting it very hard this week at the beginning of the week, but we hit the yearly opening price to the number. This is not a coincidence, guys, why it stopped right there. Then we rebounded off that on Friday, but a very shallow bounce. Okay. Now, the neural index strength here, too, is pointing up, suggesting that the dollar will weaken next week. But once again, the yearly opening price here, 13448. As long as we’re above that, longs are in play. But if we close below that for two days in a row, we could see a shift in the trend. And let’s be honest here, the data coming out of the UK is not good. Not good at all. So there’s a whole number of issues with the UK right now. So we’ll keep an eye on it. But again, that main level of 13440 is very, very important.
U.S. Dollar versus Japanese Yen ($USD/JPY)
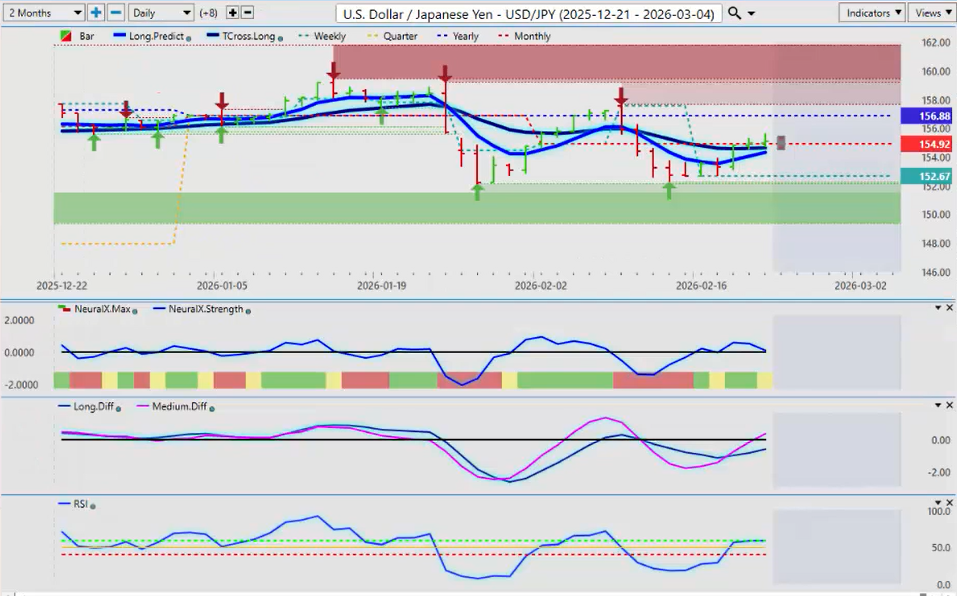
The dollar/yen, once again, with the dollar/yen, in my view, only in my respectful opinion only, this is the carry trade, guys, by definition. Buy the dollar, sell the yen. So if the market believes the Fed is going to have to cut the interest rate differential between the Bank of Japan and the Fed starts to narrow, then they tend to leave that carry trade. So right now, I believe this is a retracement higher towards 156.88, where ultimately it’s likely to fail. The Fed minutes this past week were just, I don’t even know what to say about that. There were several people on that panel that suggested rate hikes. Anyway, I don’t see the Fed hiking in 2026. I do see cuts. Ultimately, I see cuts, but we need more incoming data. But ultimately here, the dollar/yen is a short while below 156.88.
U.S. Dollar versus Canadian Dollar ($USD/CAD)
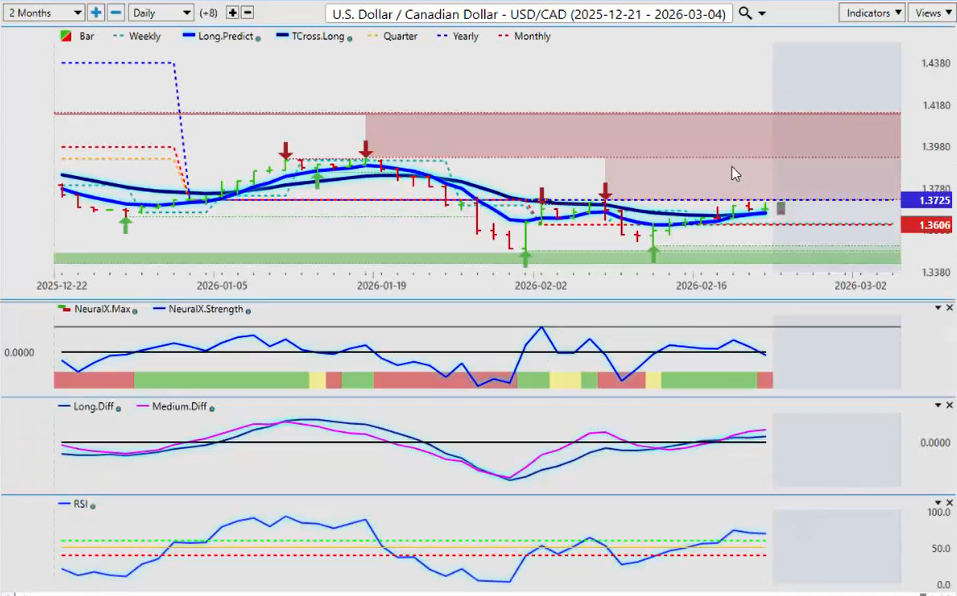
Now, as we look at our main three equity/commodity currencies, once again, the Canadian dollar, US/CAD pair coming right up to the yearly opening price, and it couldn’t get over it. Okay. So, what we’re looking for is a clean break of 13661, which I would argue we do have three days above the TROS long. But the yearly opening price at 13725, that’s the big area, guys, that we’ve got to watch. So, I believe the Canadian dollar will strengthen towards the end of March and definitely April, May, and June. So we could see some upside pressure. But once again, that neural index strength, very powerful tool, and now the neural index also is in agreement. What the problem here is that we have a medium and a long-term crossover above the zero line, and we are above the TROS long. So really, in short, the only thing keeping this pair down is that yearly opening price. So if we break it, we could take a run up towards 138 potentially very quickly. So keep that in mind.
Australian Dollar versus U.S. Dollar ($AUD/USD)
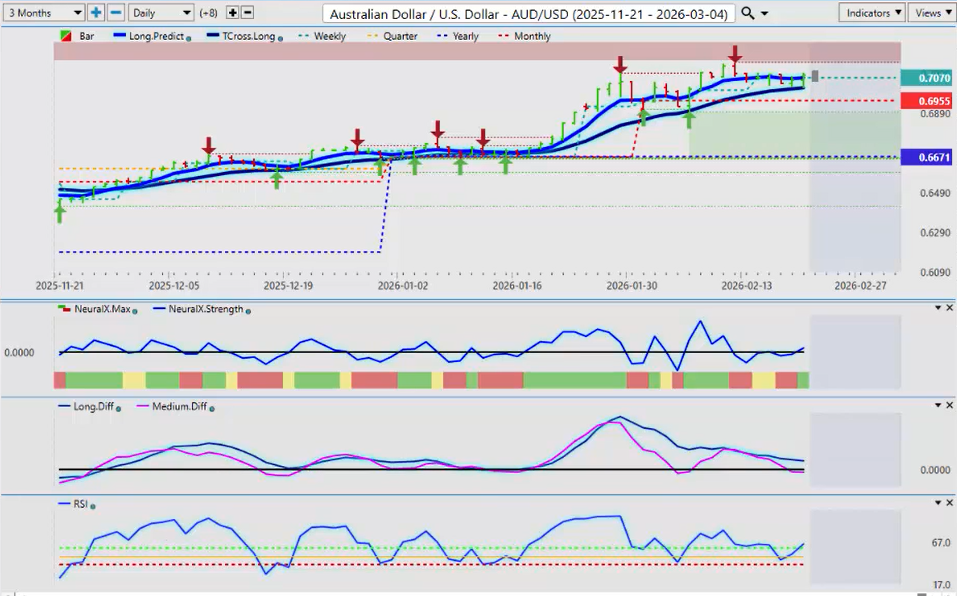
The Australian dollar and the New Zealand dollar both remain a buy, a strong buy on a dip here, guys. It’s indisputable, the uptrend here. We are stalling out, so a retracement would be perfectly normal. We’ve had that on Thursday and Friday. So again, only a few years ago, pre-COVID, I was trading this thing above par. So we are a long way from there. So just when you think it can’t go any higher, guys, always remember, try and stay with the primary trend above the yearly opening, above the monthly opening, above the Vantage Point TROS long, which is coming in at 7020 there. There is, at least for now, guys, it’s very, very bullish. Okay, but a retracement would be perfectly normal.
New Zealand Dollar versus U.S. Dollar ($NZD/USD)
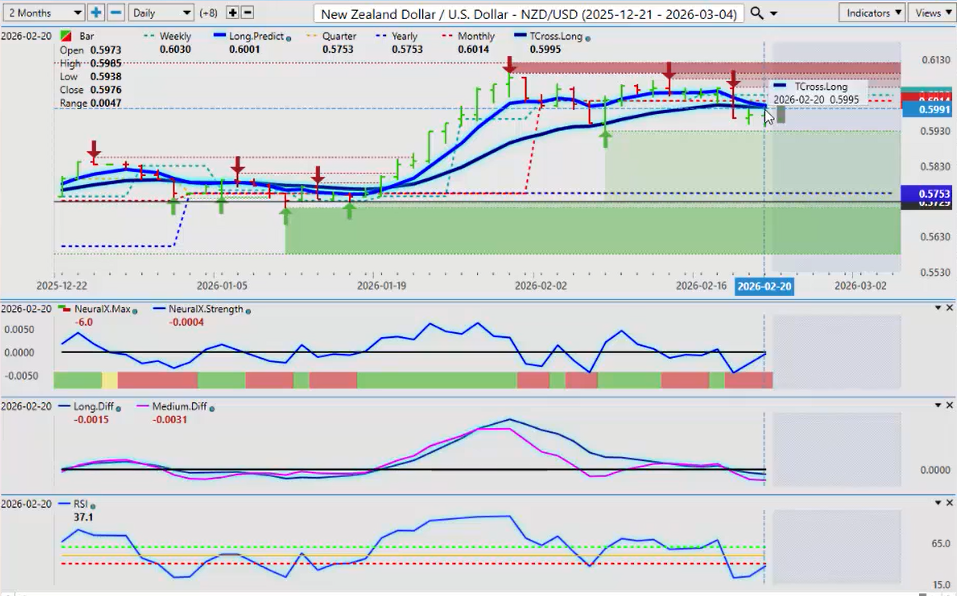
But again, the New Zealand dollar was the one under pressure this week, and this is all around interest rates. What is the bank going to do? Are they going to hold? Are they going to cut? And the market basically is ADD with this stuff. And ultimately, when you look at the 2% inflation target, it really is interesting if you Google where that 2% inflation target came from. And it didn’t come from anything in economics. It came out of New Zealand. The finance minister out of New Zealand, I believe, just blurted it out one day and said, “Okay, you know, we’re at 17% inflation or 17% interest rates. I think we should go with a 2% inflation target.” And they adopted it. Then the UK did, then the US did, then Canada did. So, but that wasn’t really based on any economic paper. So again, maybe the market’s putting a little too much emphasis on what these central banks are doing. But remember, we have no control over that, guys. Okay? So, we want to make sure we know what the primary trend is, and most importantly, we know our levels. So with that said, this is the Vantage Point AI market outlook for the week of February the 23rd, 2026.


