


Welcome to the Artificial Intelligence Outlook for Forex trading.
VIDEO TRANSCRIPT
Hello everyone, my name is Greg Firman and this is the Vantage Point AI Market Outlook for the week of February the 5th, 2024.
Now, to get started this week, we’re going to go a little bit further than where we did last week where we start to bring in some additional indicators into our in-market technical analysis. So, what we’ll do is we’ll look at the global indices to see how the stock markets are doing globally, not just in the US. Now, I won’t do this every week, but I will do it from time to time, so our anchor point, or our key market, is the S&P 500; we’re above our yearly opening price, our monthly opening price, and it looks pretty good here.
Nikkei 225
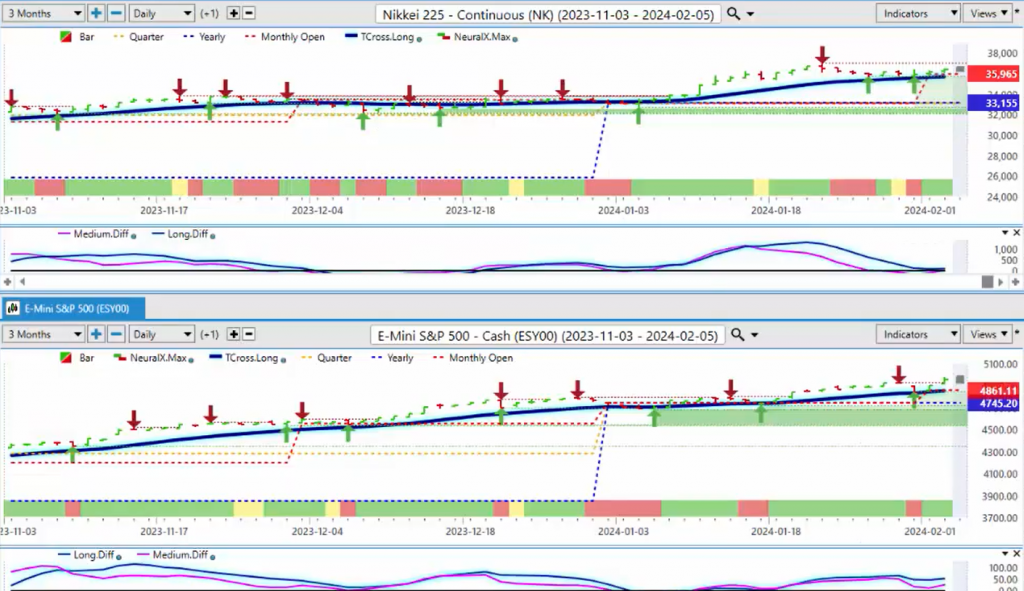
However, usually, the US dollar has a strong seasonal pattern in mid-February to mid-March, so we should be very cautious of that. When we look at our Nikkei 225, we’re still recovering; we’re also holding above our yearly opening price at 33,155, and again, the Tcross long coming in at 37,500. Now, this area here is going to be key for the international traders if we can hold above this, but if that S&P 500 drops, then it’s going to pull that Nikkei down with it.
DAX 30
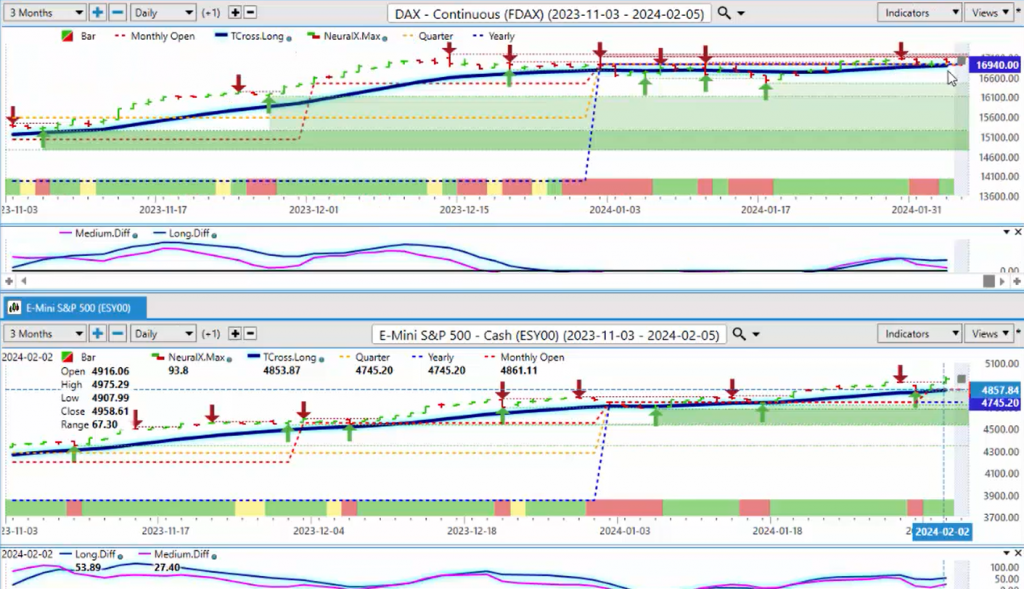
If we look at our DAX 30, now the DAX 30 paints a slightly different picture here; our yearly opening price there is $16,940. I would argue this is the weaker of the group, and one of the reasons I say that is that we’ve got an MA diff cross that occurred back here on January the 30th, and we’ve only barely recovered here; we’re holding along the TCross long, 16,917.
CAC 40
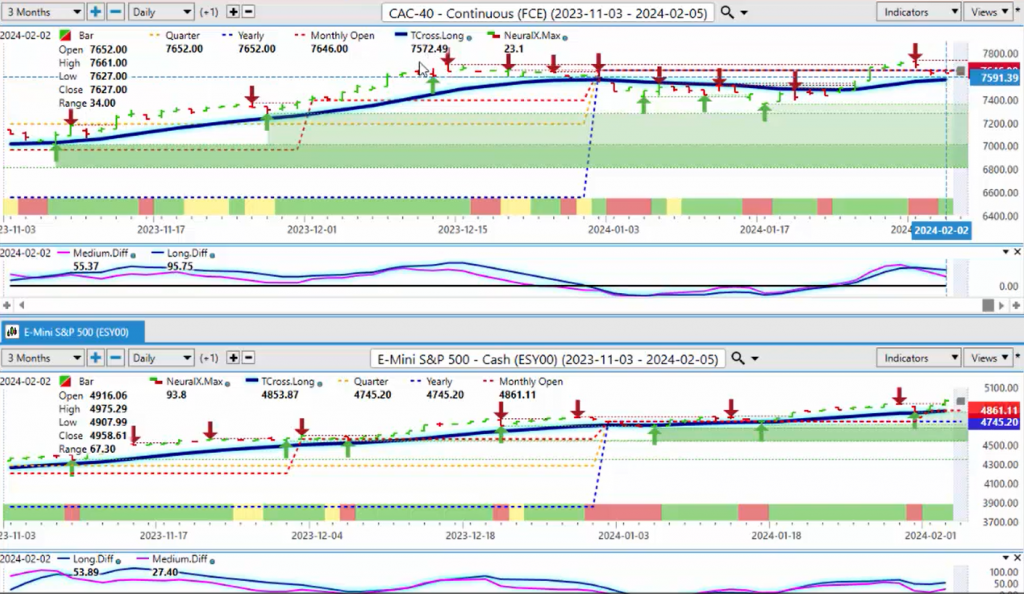
Now, when we measure this against the CAC 40 in France, once again, the picture changes somewhat. Our yearly opening price there 7,652; we’ve closed the week at 7,627, so that French index is showing some weakness, but we’re holding above the T-cross long, 7,572, but we must get above 7,652, and my optimism on that in the month of February remains heavily guarded based on that potential dollar strength.
Euro Stoxx 50
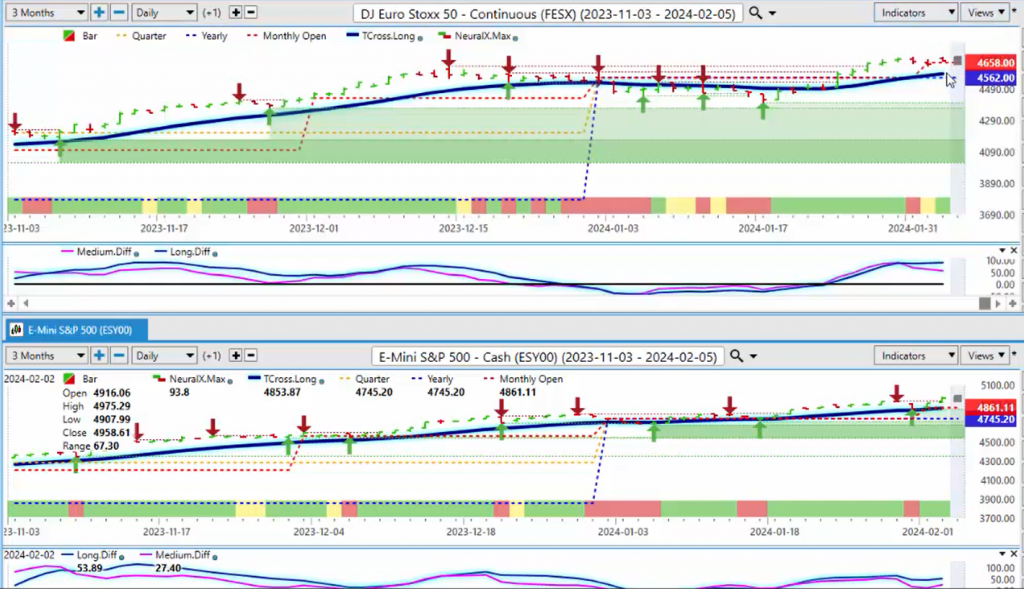
Now, when we look at the Euro Stoxx 50, we can see that it’s doing much better. Now, again, the monthly opening price, what we’re doing here, what I’m doing here this week is I’m combining contrarian indicators, looking for a reversal, which we can see is starting to form here on the Dow Jones Euro Stoxx 50. But the monthly opening price and our yearly opening price, they’re very objective numbers; there’s very little to debate about that. If we’re above it, it’s bullish; below it, it’s bearish. So, we are holding above these levels, but I would say that a retracement back to our T-cross long at 4,587 is likely a likely outcome if that S&P 500 dips. We’ve got an MA diff cross here also warning of downside, uh, potential pending weakness on this particular index.
FTSE 100
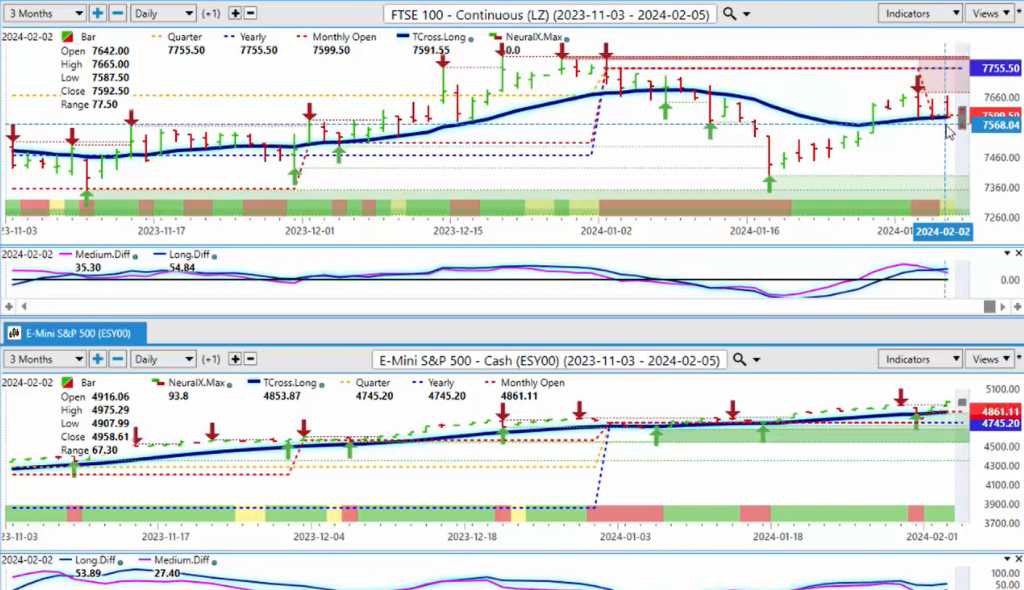
The FTSE 100, when we look closer at this, very choppy to say the least, but we’ve recovered; we’re holding, and this is a very good example of how you can use the Vantage Point T-cross long as a daily entry point. Each day, we come down to our TR cross long and we rebound out of there, but again, when we look closer at this and bring in price-based indicators like our monthly or our yearly opening price, we are still bearish on the FTSE this year. We can see that again, that yearly opening price, 7,755.50, we are firmly below that. So again, we’ve got a chance of moving back up to that area, but we must have the S&P 500 moving higher and we’ve got to hold above the T cross long at 7,591.
Hang Seng Index
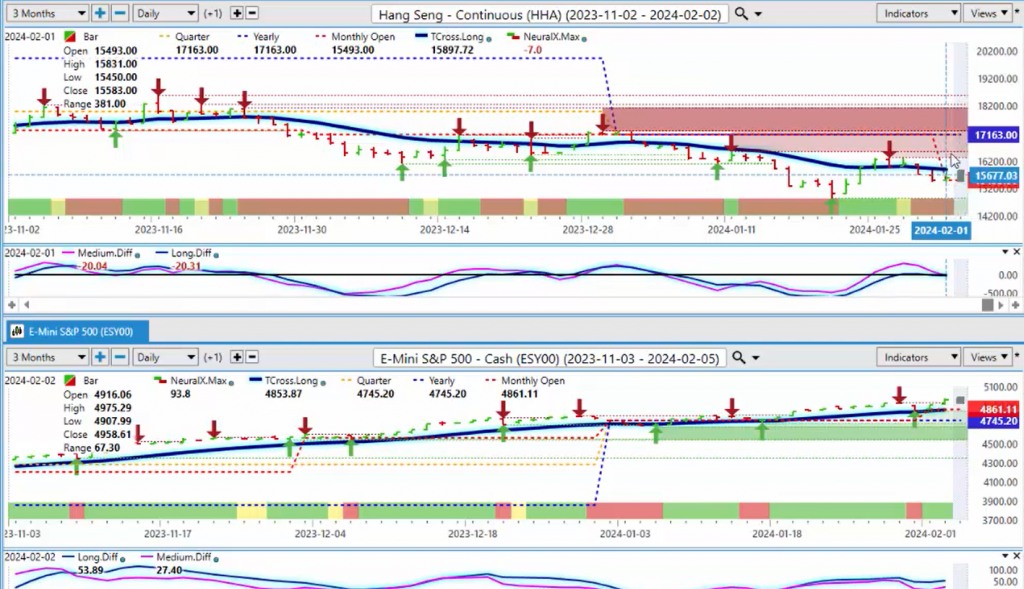
Now, our global Hang Seng, again below the yearly opening price, 11,163, so if we can get a decent rally in the S&P, then this could a place of value to buy the index, but right now, clearly bearish on the year, the indicators rolling back down to the downside, so we should be very cautious with that. The Dow Jones, again very almost identical to the S&P 500, holding firmly above the yearly opening price, 37,566, and our monthly opening price, 38,185. But, if we break down below the monthly opening price, which I believe we will, then a retest of the yearly opening price is likely imminent.
Russell 2000
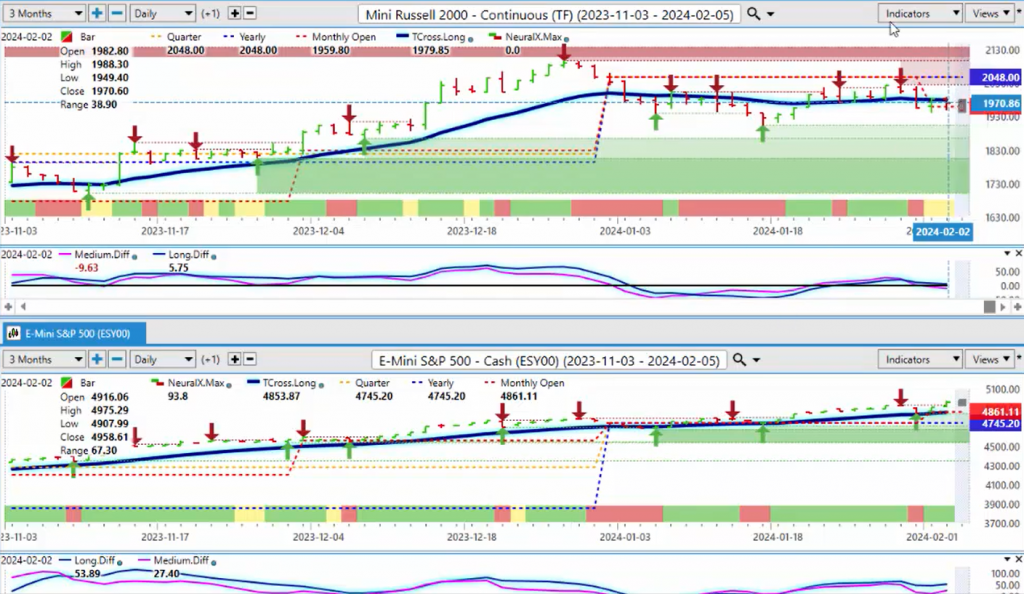
When we look at our Russell 2000, once again, it paints a little bit of a different picture. The correlation is still there to the S&P, but this is the weaker link here. The Russell 2000, holding below the yearly opening price, 2,048, not able to get above and stay above the Vantage Point T-cross long at 19,979.85. So again, this could be an early warning sign of what’s coming in the S&P 500 as we get extremely toppy at these particular levels.
Gold
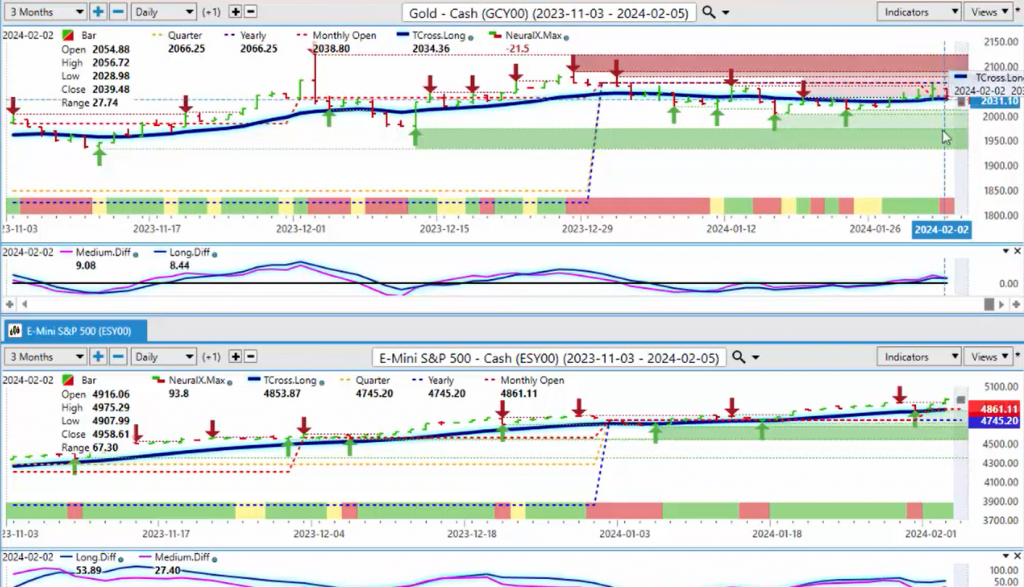
Now again, when we look at that S&P 500 and do a comparative analysis to something like gold, we can see that gold is starting to rebound a little bit. I would argue that it’s positively correlating right now to the S&P, meaning that if that dollar strength comes to fruition with that seasonal pattern in February and March, then both gold and your equity markets are at risk here; that’s what this is telling me. So again, we’ve got to watch this very closely, and with gold, we are not getting over the yearly opening price at 2,066. Now, I will say I’ve seen gold and the S&P 500 move up and down together in the month of February, a positive correlation, but it’s always very short-lived. So, for gold prices, keep a very close eye this week at 2034-36, then we have some very strong verified support down at this particular low around 2,012, but that 2,000 mark is still a psychological level that if we break down below that, that could trigger a considerable selling, but I don’t think we’re there just yet.
U.S. Dollar Index
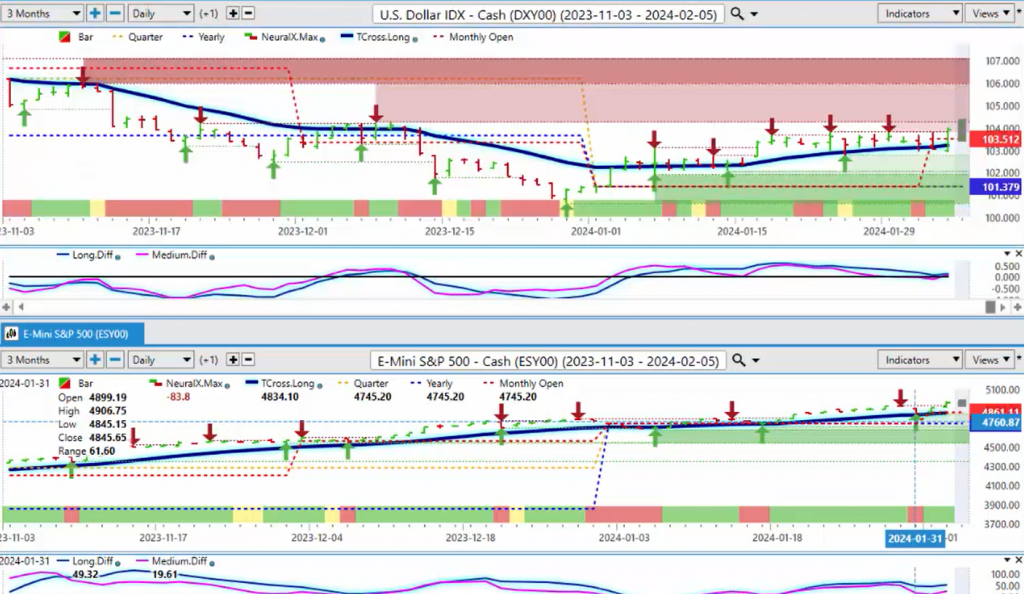
Now, with all of these correlations, again, we want to make sure that we’re looking at that inverse correlation between the S&P 500 and the dollar index or the global indexes and the dollar index. So, as you can see, the dollar is firmly above its yearly opening price here at 101.37, our T-cross long, and we’ve closed the week above the monthly opening price.
Only in my respectful opinion, I don’t really see that unemployment number as being hot. The U6 number has moved higher; people are going home with less money, not more money. The average hourly earnings, uh, again, could that deter the Fed from cutting? Well, he’s basically saying that he’s, uh, still looking at incoming data, just basically said a whole lot of nothing, in my opinion. So, the market should be still long the dollar for at least a couple more weeks here. Uh, but again, there has been historically a very strong seasonal pattern between mid-February to mid-March, one of the strongest points of the year for the dollar, other than from September into October, another very strong period for the dollar index and the dollar in general. But, uh, right now, uh, there’s a slight bias here; we can see that the predicted differences are moving above the zero line, and again, in my respectful opinion only, that is a warning sign for stock traders to be very cautious in the month of February.
Volatility Index
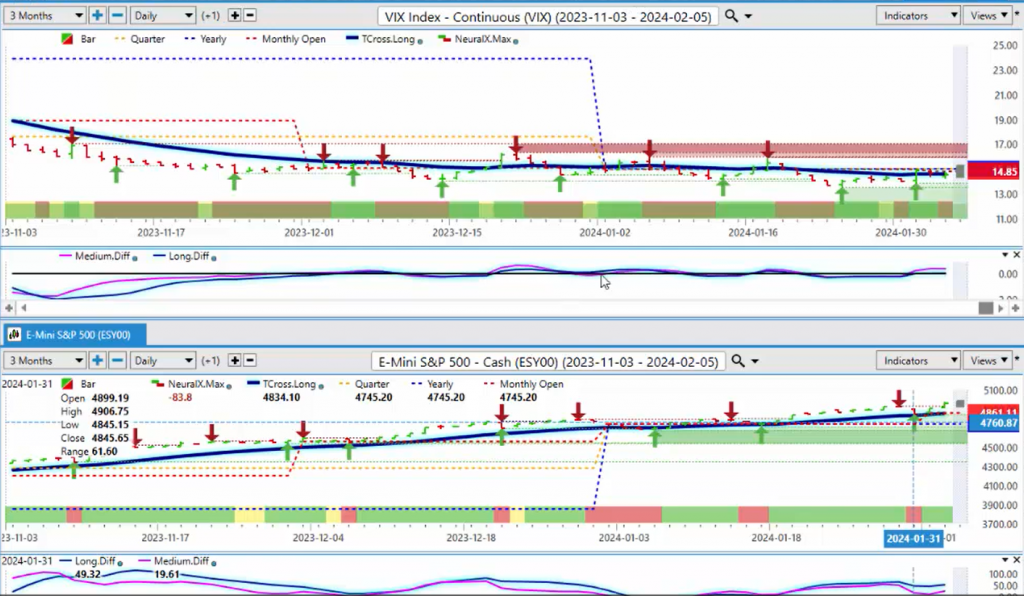
So, when we look at the VIX again, another indicator that can warn us of how the stock indexes are doing, and that VIX is gaining momentum. Our predicted differences are above the zero, so if we look at the dollar strength, the VIX, this is not pointing towards a stronger equity market. However, in 2024, ultimately, I believe stocks will do very well. I’m just not at all convinced they’re going to do well between February and April, so be very cautious. That VIX is starting to pressure that yearly opening price at $15, so again, it’s just a warning sign.
NASDAQ Index
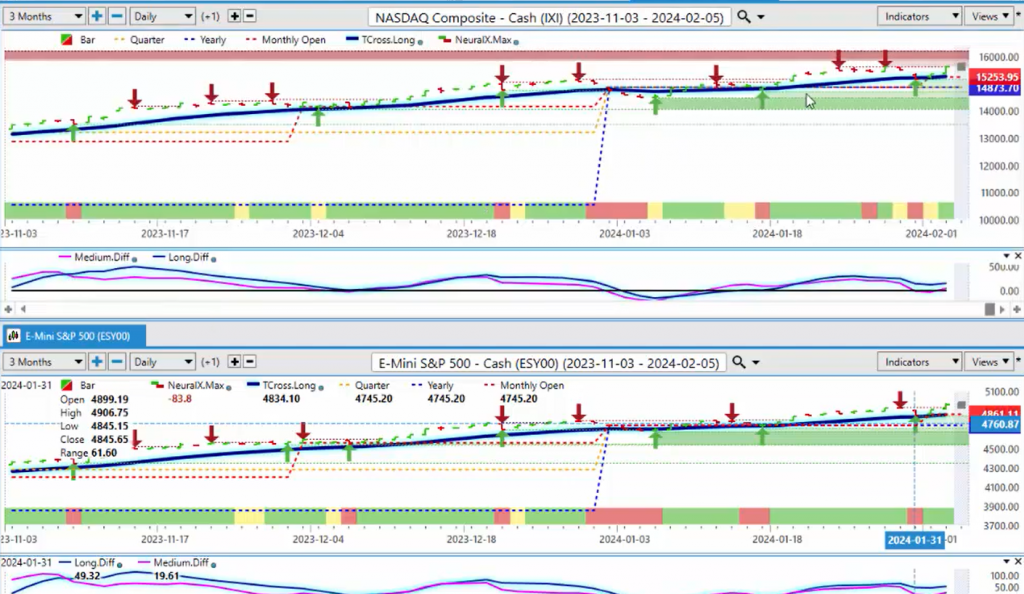
The NASDAQ also is one we want to make sure we’re looking very closely at. NASDAQ holding above its yearly opening price, monthly opening price, bullish, but again, it’s going to be choppy and it’s still going to follow that S&P 500.
Bitcoin
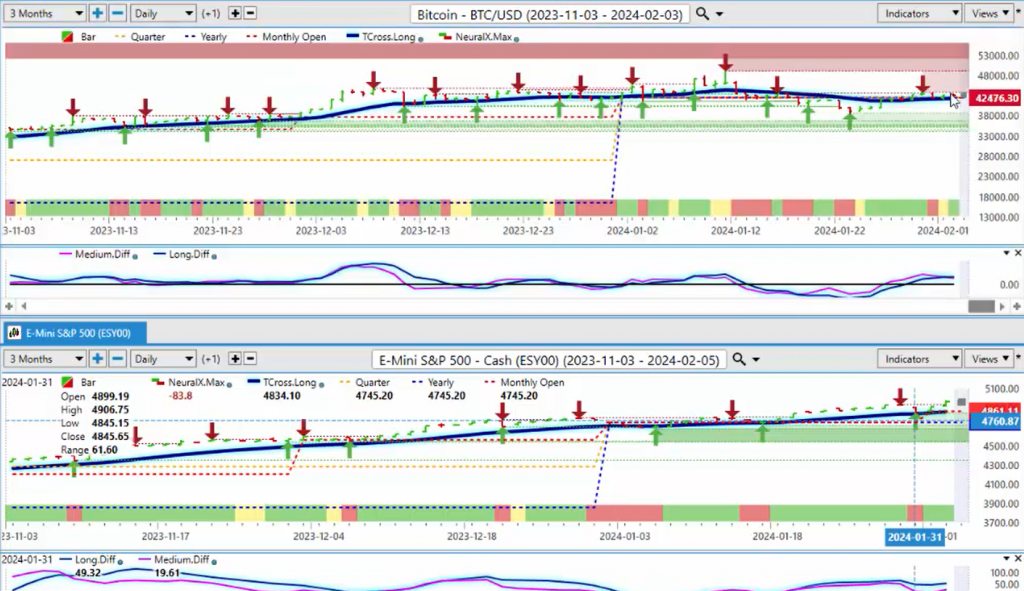
Now, the final thing we would look at here, of course, is Bitcoin, because where does Bitcoin fit into this? Bitcoin, there’s a lot of debate over this. My view is that we go higher, regardless of what gold, the dollar, and all that, ultimately this year, Bitcoin is likely to have another good year. Uh, but historically, not so much between February and March because you have that pattern on the dollar. So, right now, our TCross long, 42,0369, we’re holding above that, our yearly opening price, 42,500, very good buying here, but small moves, no real big triggers to push this up yet, probably not till April, so it’ll probably move a little bit sideways, and I would argue there’s a very loose sell signal there. The MA diff crossing over the long, there’s medium-term crossing over the long-term predicted difference, that usually tells me there’s going to be a corrective move, but the verified support low, 38,589, that’s where we’ve seen the buyers coming in, and that’s likely the area that I would hold out for if you’re a Bitcoin trader.
British Pound versus U.S. Dollar
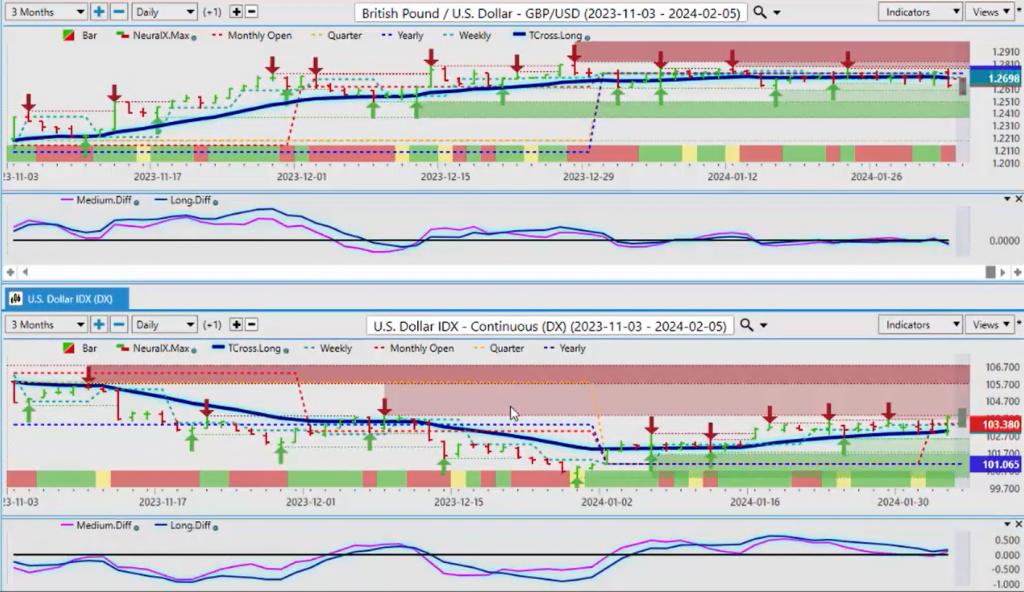
So now, let’s shift over to our Forex market. So, what we’re going to do is apply the same methodology. We’re going to look at intermarket correlations directly on a per pair basis. We’re going to be using our T-cross long as our main pivot area to help determine the trend, our MA diff cross, the medium and long-term predicted difference to show us pending reversals or potential reversals. We have our neural index, and we have our monthly, and yearly, and quarterly opening prices, all built in, so a nice tight little package here. And then we split the screen so we can always visually see these inner market correlations. The dollar up, basically all of these other pairs are likely going to come under pressure.
So, right now, as I had stated, the dollar is holding above the T-cross long, the yearly opening price, the predicted differences are starting to turn back up, that is putting downward pressure on the British pound US dollar. The British pound is the base currency, trading against the dollar, so the dollar index up, British pound down. You can see we’ve been running all along the yearly opening price. This is why we use the current monthly opening price and the current yearly opening price. We don’t want to get into a rolling, a lagging rolling performance model. We want to stay current each month because each month, we have a series of economic releases. We’ve got the CPI, the retail sales, the non-farm payroll number, the PMIs, all of these numbers repeat each month, and we want to gauge the strength in the market.
So, for now, going in, our neural index is down; we’re breaking down below the failing at the yearly opening price and closing below $12696, the Vantage Point T-cross long.
That’s where all of our resistance currently resides.
Euro
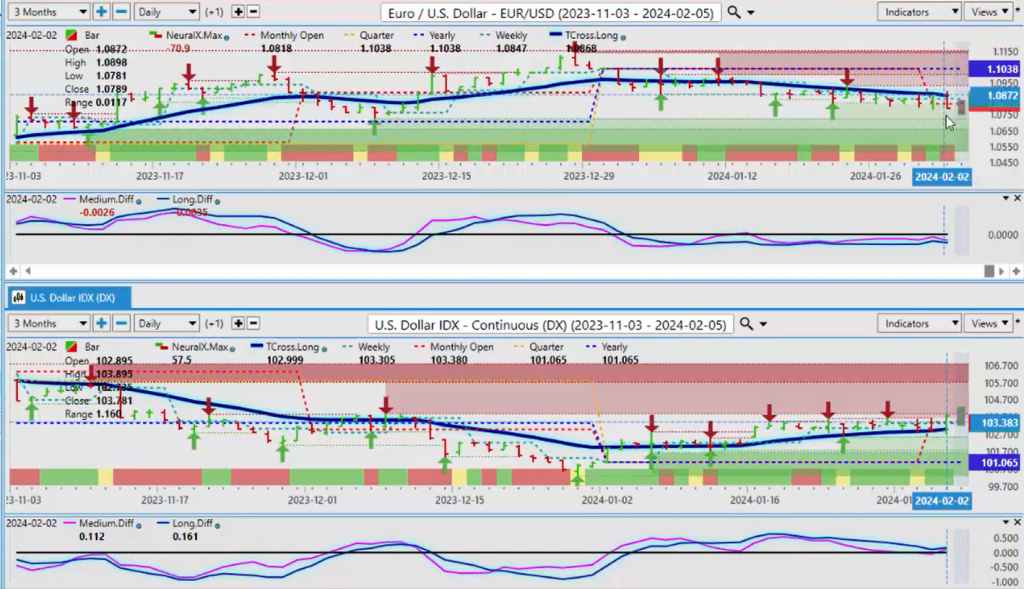
Now, when we look at the Euro, we were doing this one live in the Vantage Point training room this week, and selling into this T-cross long, you can see that every single day, Wednesday, Thursday, and Friday, we hit into that Vantage Point T-cross long and we failed. We’re below the yearly opening price; we’re pushing below the monthly opening price. But that’s the one you want to watch next week, 1.0818. Can we stay below that? And then our T-cross long at 1.0868. So, I believe the Euro ultimately is likely to go higher in 2024, but it is very unlikely in the month of February, barring any more comments from the Fed.
And I think he is speaking Sunday night, so be careful, but right now there is a bearish tone. Predicted differences, neural index, everything here. The main thing is, guys, know your levels. The Tcross long, 1.0868; as long as we’re holding below that, shorts are definitely favored here.
Magna International
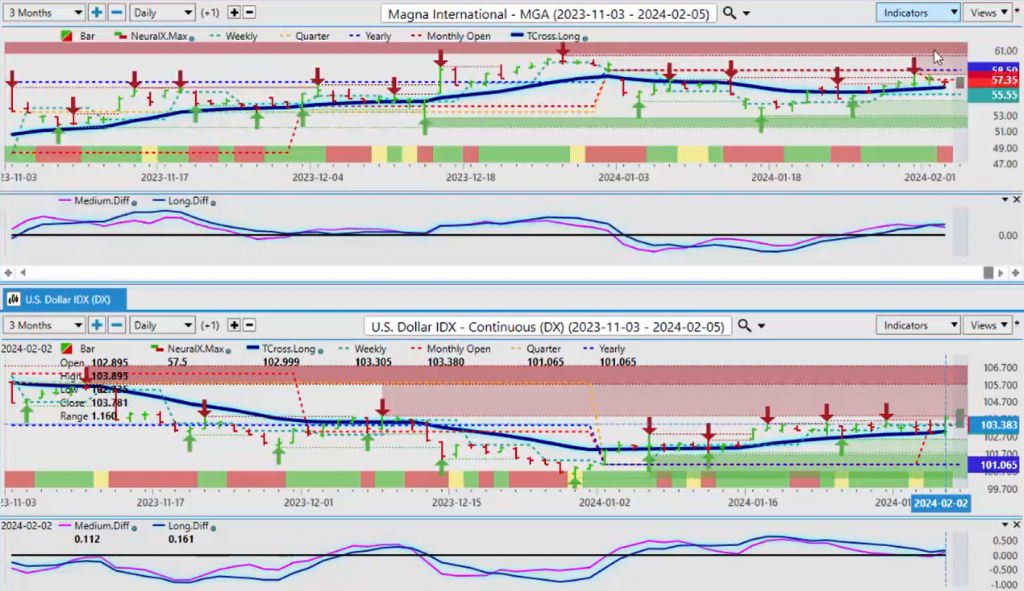
Now, one of the tools I use from an intermarket analysis standpoint is Magna International stock. So, for you option traders and your stock traders, there has been about a 94% inverse correlation between the dollar index and Magna. I am actually watching to see if Magna can break down below the Tcross long here at 56.41 because if it does, that confirms to me the dollar is going higher. I have monitored this particular inverse correlation for years, guys, and it’s a real thing. The neural networks have found this intermarket correlation via the bull bear gauge and some of the other powerful tools in the Vantage Point software. So again, right now, if this stock breaks down, that is a confirmation for me, and now I’m sharing that with you so you can actually monitor the same thing.
But again, we are going to see choppiness in these markets, but there is an underlying pattern with seasonals, correlations, and things of this nature.
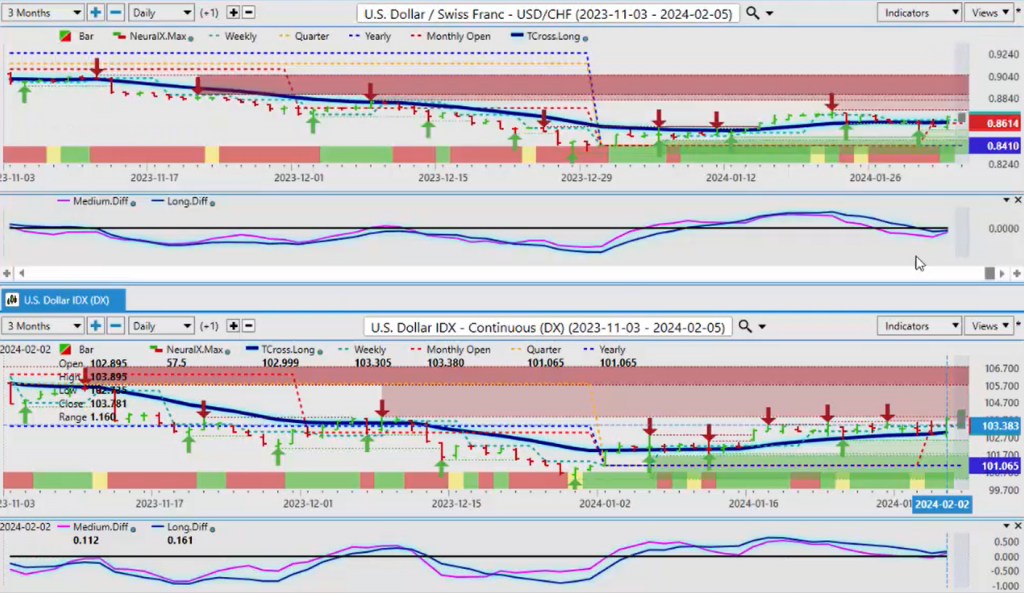
U.S. Dollar versus Swiss Franc
So, when we look at the US Swiss franc for next week, we can see that it’s starting to turn bullish here. We’ve got an MA diff cross that’s coming in. This pair is about 92% positively correlated to the dollar index. So, if we can get above our yearly opening price at .8410, stay above that, then we should be good. And as you can see, we’ve been above it the better part of the year. Now, if we can get above the T cross long, excuse me, at .8618, then we could extend higher here. But ultimately, I don’t believe the dollar will make a lot of gains against the Swiss franc because the Swiss franc too is a risk-off type of currency. So again, we’ll monitor this, but for now, as long as we’re above these levels, this too looks pretty good.
U.S. Dollar versus Japanese Yen
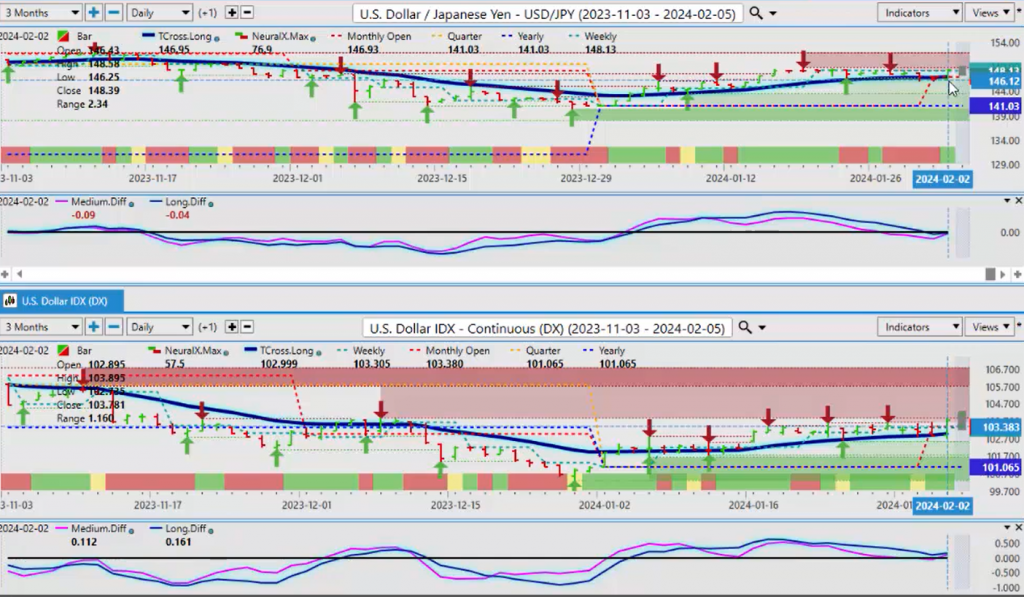
The dollar yen, again, I’m a firm believer that the Bank of Japan is going to step in and intervene here soon. So, while the long looks very very good right now, I would exercise extreme caution around anything that has the Japanese yen in it because if they intervene, the yen could violently strengthen overnight within a few minutes. So, be careful of this one, but for now, it is above our T cross long, it is above our yearly opening price, the indicators are turning bullish again, and this is the carry trade. So, realistically, without the Bank of Japan, it heavily favors dollar longs here, but be careful is what I would warn, and make sure that you’re even more cautious if we break down below 146.95, our T cross long.
U.S. Dollar versus Canadian Dollar
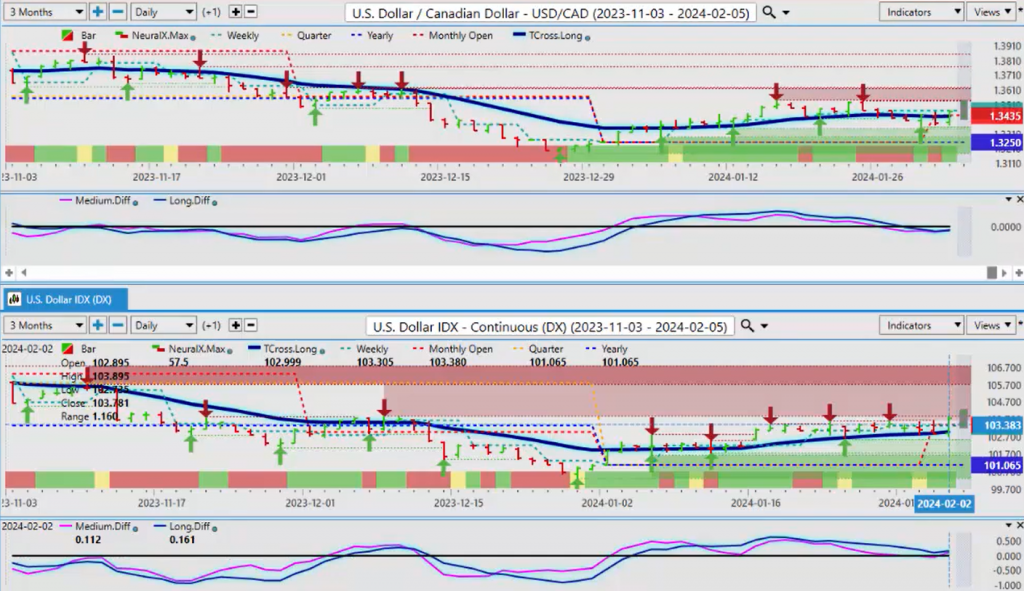
Now, the US Canadian pair, again, we want to be very very cautious with this particular pair because it very often, and I’ll show you this in a minute, is that light crude oil tends to positively correlate to the dollar, and there is a small seasonal pattern in oil, which I’ll talk about in a second. So again, that could help the Canadian dollar here to some degree, but I also believe ultimately the Bank of Canada will be first to cut, not the Federal Reserve. So for now, we’re above our yearly opening price at 1.3250, we’ve got to get above this T cross long at 1.3431, and stay above that particular level if we’re going to remain long on this. The indicators do favor more upside at the current time.
Crude Oil
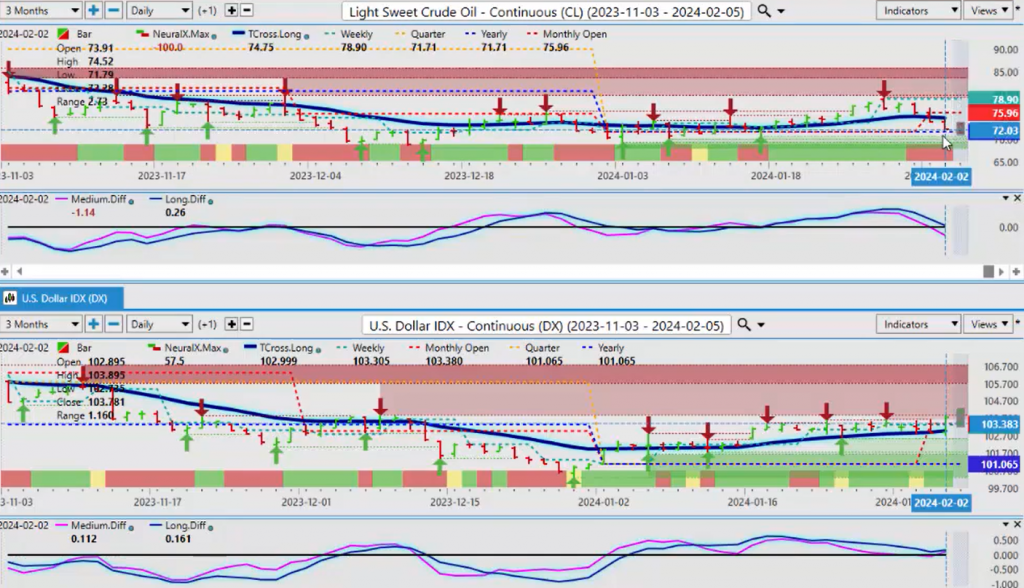
But again, as promised, I will speak to oil here. Now, oil is coming into one of my favorite trading areas, the yearly opening price at $71.71. Shorts are very very high risk here, guys, because of that positive correlation to the dollar. You remember in the fourth quarter last year, they were pushing everybody to energy stocks, and energy kept dropping and dropping and dropping, and that’s because the dollar did, and the dollar was pulling those oil contracts down. That’s one of the many reasons why oil went lower, but that’s the big one that stands out for me. So, if the dollar turns back up, and if oil is going to rebound, it is going to be at this level or slightly below. Be careful of a big push to the downside on Monday only to see a reversal on this on Tuesday. I would revisit longs on oil contracts on Tuesday of the coming week because again, this isn’t an outlook, guys, not a recap of something that’s already happened.
Australian Dollar
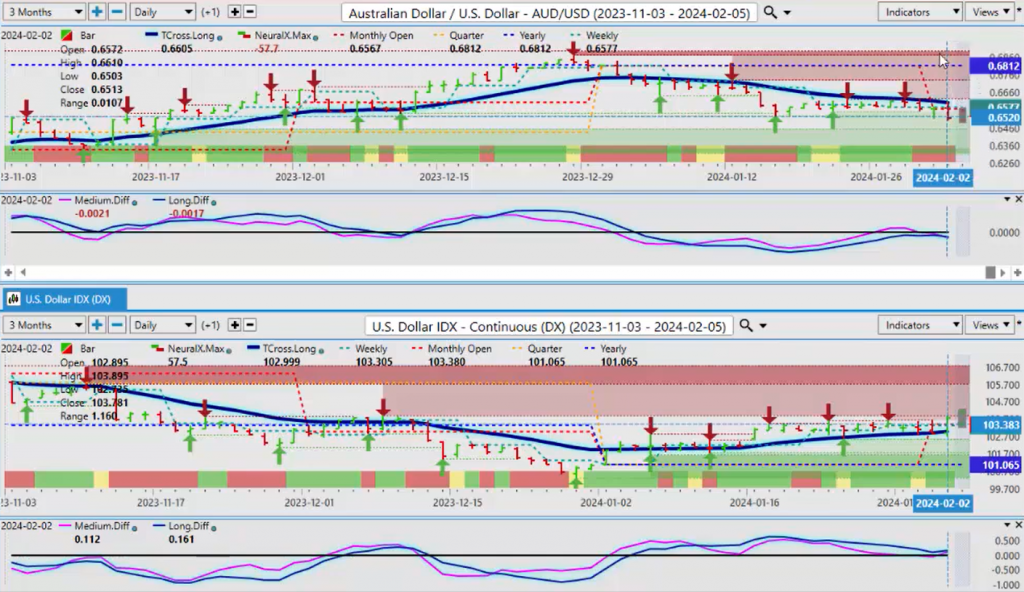
Okay, now when we look at the Aussie US and the New Zealand US, again, we’re, it’s almost the exact same trade is what I would argue here.
So, the Aussie is being affected by this dollar strength, the new yearly opening price, .6812, we’re holding below that, and yet another sell signal coming in here. But I believe the downside will be limited in the Aussie this year, probably to around the .63 area, so short a little bit more, uh, short selling on this, but then we would probably look to start looking at longs.
New Zealand Dollar
And I believe the Kiwi to be the same deal here, guys. Uh, again, we’re bearish for now on this period of known dollar strength and the potential of a seasonality between February and March. So, these are the things that we need to keep a very sharp eye on, but it’s critical that you know your inner market correlations and you know the key levels when using the Vantage Point software. So, with that said, this is the Vantage Point AI Market Outlook for the week of February the 5th, 2024.


