


Welcome to the Artificial Intelligence Outlook for Forex trading.
VIDEO TRANSCRIPT
VANTAGEPOINT AI MARKET OUTLOOK
VantagePoint A.I. Market Outlook for February 9, 2026
Okay, hello everyone, and welcome back.
My name is Greg Firman, and this is the Vantage Point AI market outlook for the week of February the 9th, 2026.
US Dollar – USDU ETF
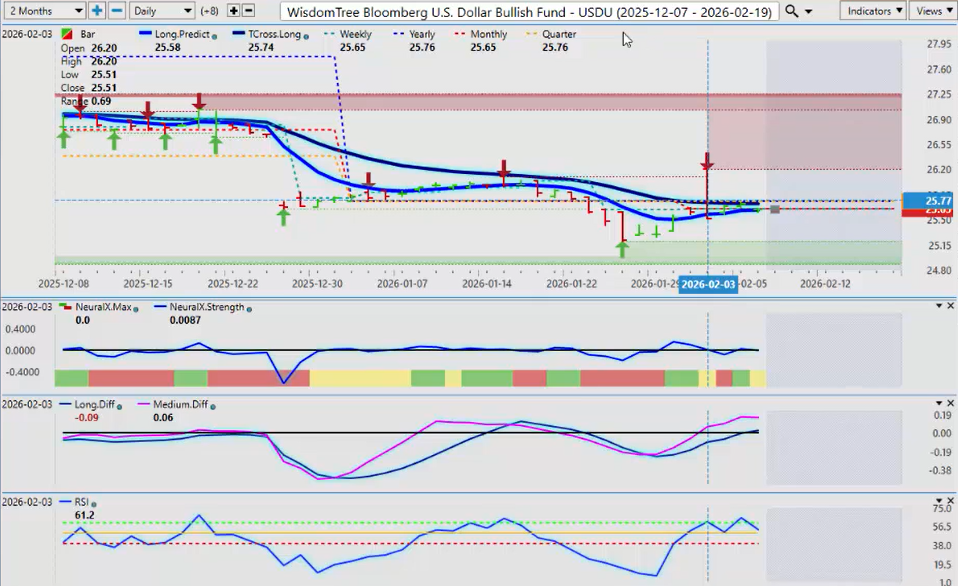
Now, to get started this week, where we’ll begin where we always do, that very important US Dollar. Now, once again, I am using the USDU ETF to gauge the strength and the weakness of the US dollar. Now, we know the dollar is strong in the first week of the new month until the week after the non-farm payroll number. Unfortunately, the payroll number is delayed, uh, with the partial government shutdown, but the dollar is holding firm, and usually it’s about midmonth when the dollar really starts to tank, just like it did last month.
So, for now, basically this is pretty much going to be a make-or-break week for the dollar. We’re sitting right on the T cross long. We’ve got the calendar yearly opening price, 25.76. They’re both sitting right there. We do have a medium- and a long-term crossover, but you can see the predicted RSI and the predicted neural index is picking up on a lack of momentum.
So again, always watch your trading on Monday and Tuesday. Monday is usually a fake price, and it reverses on Tuesday. So if we see a big push up on the dollar on Monday, it’s very likely it’s going to go lower on Tuesday. But again, there are a number of different reasons why the US dollar should go up, and there’s just as many reasons as to why it should go down.
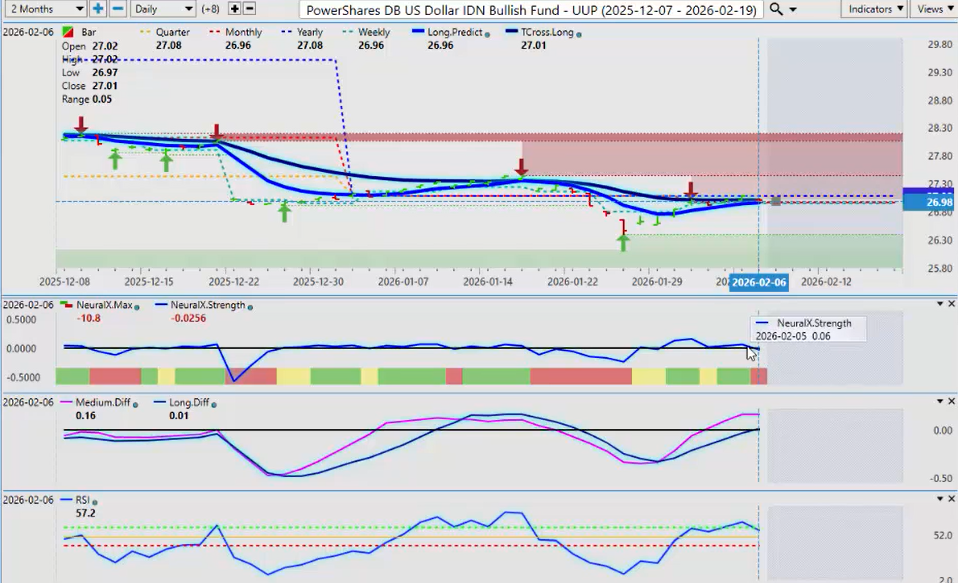
So we look at the critical levels, and we do, and we also want to do a comparative analysis to the UUP ETF, again heavily weighted to the euro. But the predicted indicators in VP are a little bit more advanced on the UUP ETF, pointing down with the neural index, where you can see on the USDU ETF we’re getting a caution on the neural index and the neural index strength.
So again, we’ll see how this one plays out, but unless we can break above the T cross long and the yearly opening price and stay above it, then the dollar remains on borrowed time as we get closer to the middle of the month.
Gold
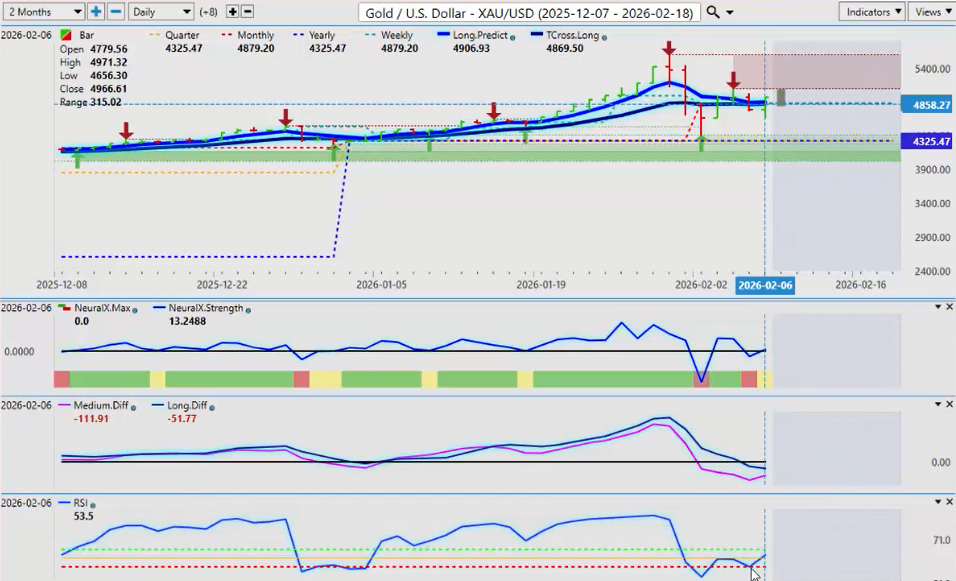
Now, with Gold, a very choppy week this past week here, guys, but we still end up finishing the week above the T cross long at 48.69. The indicators in VP, again using a 60/40 split with that predicted RSI, it tells me that I’m lacking momentum here.
I would further point out that we came right down to the calendar yearly opening price, that 43.25, and shot right out of there. So again, that’s a big warning sign, guys. And when you’re looking at ways to identify what the overall primary trend is, there’s no better tool than the yearly opening price. If it’s above it, it’s bullish. If it’s below it, it’s bearish.
You have retracements inside of larger trends, but they’re not necessarily trend reversals. So, as the indicators point here right now with Gold, everything does look good for a move higher next week, but we also want to keep a close eye on that dollar index.
S&P 500 – NASDAQ – Dow – Russell
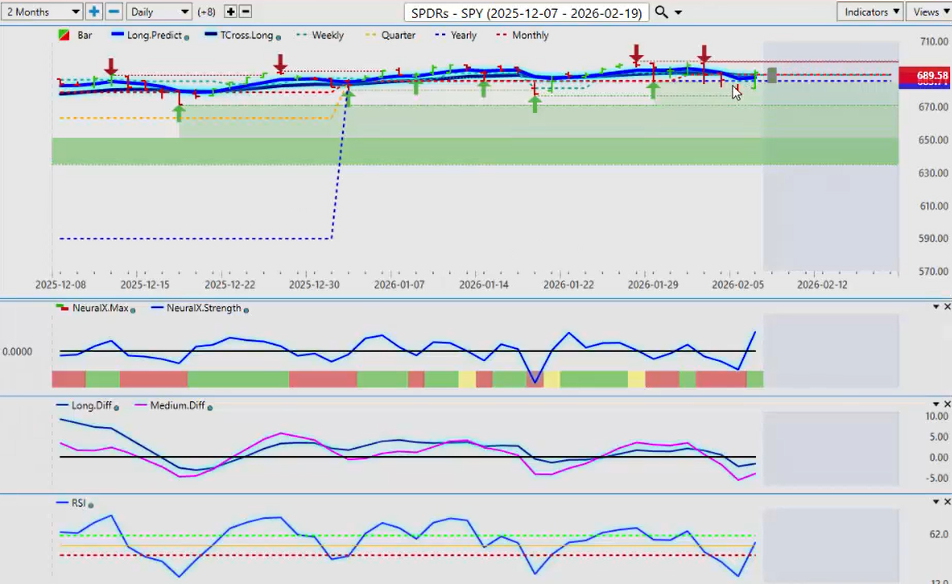
Now, the SPYs going into next week, uh, again, a tough part of the week for the NASDAQ and the S&P and the Dow, but again, my pick has been the Russell. I’ll talk about that in a moment.
But for now, we finished the week above the monthly opening price and above the yearly opening price, 68.571, 68.958. These are our key levels. The VP indicators are starting to turn bullish on stocks again. But again, the fact that if you look at where we’ve been running in the month of January and February, we’ve been running along that yearly opening price or just below it on a regular basis.
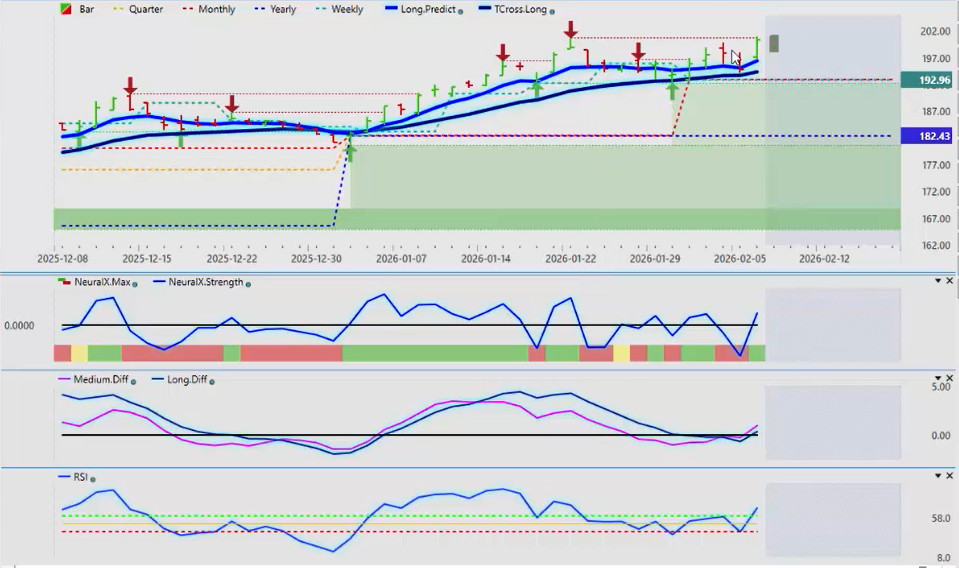
Now, when I look at the Russell, there is a considerable gap, and even this past week, with all the volatility, the Russell has fared very well. Now, the yearly opening price there, uh, on this particular IWM ETF, 182.43.
So again, holding above the monthly opening price also, and the TROS long, 194.38. And again, we’re positioned nicely just above, excuse me, the monthly opening price at 192.96. So everything looks good here on the Russell’s side.
And with all of this volatility in the tech sector, the Russell, uh, as I’ve talked about from the very beginning of the year, that the Russell would be my pick as the better index of the group.
DAX Index – DAX Futures – Global X DAX ETF
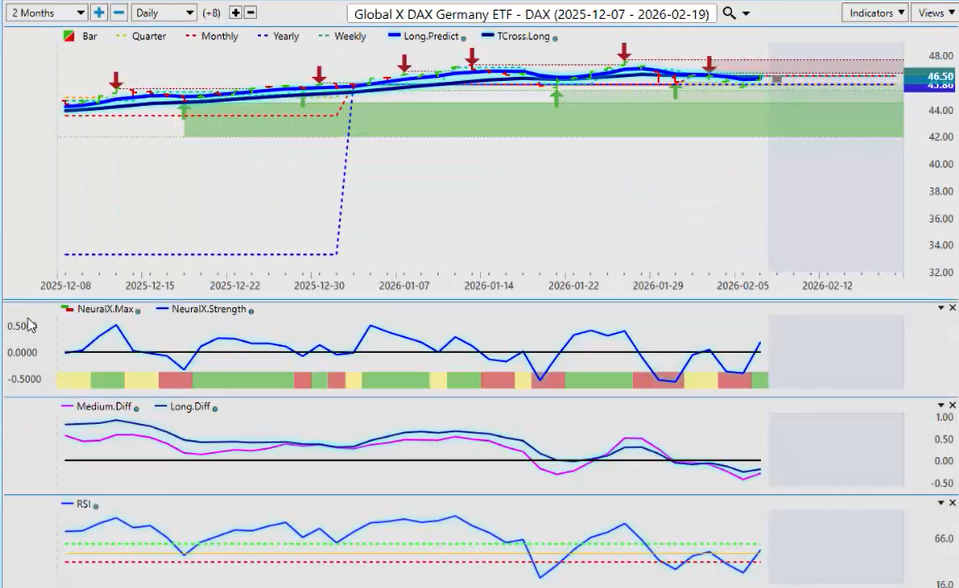
Now, I’m also a big fan, uh, as I know my friends in Germany are too, of the DAX. Now, the DAX has been relatively correlated, surprisingly, to the EUR/USD Forex Pair, or the euro in general, which I will talk about in a moment.
But for now, uh, again, a good buying opportunity off that yearly opening price. Now, the DAX Futures are seeing a lot more volatility. The ETF, actually the Global X DAX ETF, is helping smooth things out.
Uh, and again, I know some people prefer the futures. I say look at both, but I believe that this one is a more accurate price. And I can use the Global X DAX ETF to actually trade DAX Futures, believe it or not.
So again, right now, these indicators, much like the Russell, are pointing back up. So everything looking pretty good there on both the Russell and the DAX. And again, in my respectful opinion only, those are the two indexes I like the best.
VIX Index
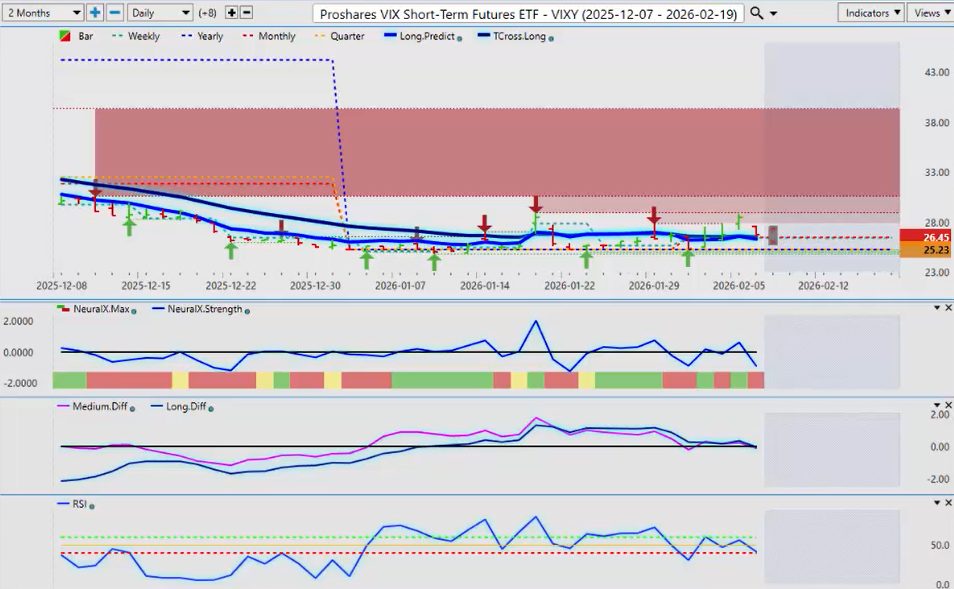
Now, we would still have to make sure we’re looking at at least the short-term VIX Index. So again, the VIX Index remains flat. Uh, we’re essentially trapped between the verified resistance high, 28.95, and that all-important yearly opening price, 25.23.
So again, very tight channeling, very tight so far in 2026, but we’re not breaking down below that calendar yearly opening price, which is our year-to-date price. Now, the predicted RSI is pointing down, and the neural index strength.
And again, I have two neural index indicators on the screen here, guys. The neural index strength, which is internally what’s going on inside that very important neural index, then your yellow telling us bullish, bearish, and caution. But the neural index strength really does give a stronger signal, in my respectful opinion only, and it’s saying, “Look, uh, we’re getting ready to move lower here.”
So, for now, it does look like the VIX Index is supporting the main stock markets.
Bitcoin
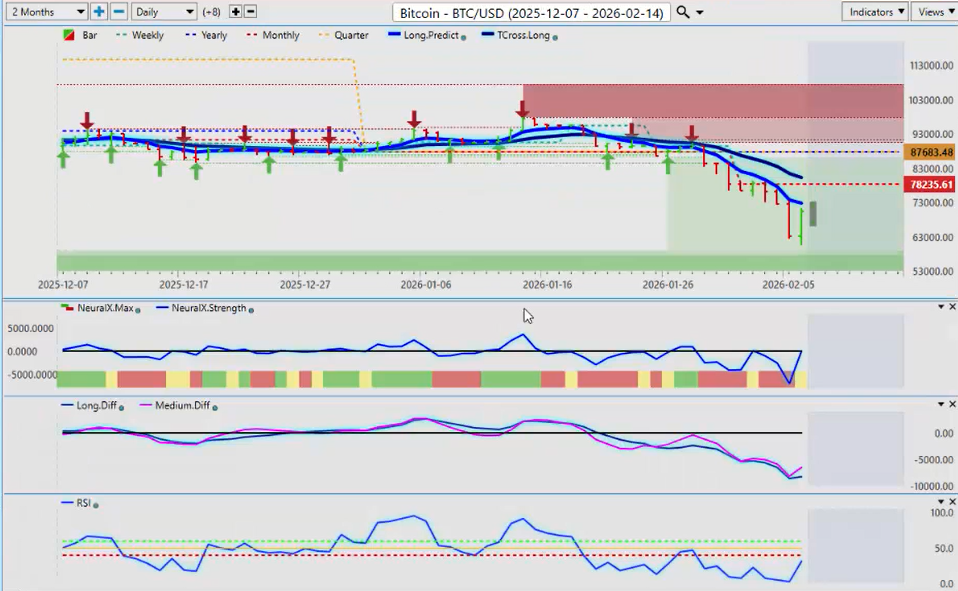
Now, another tough week for Bitcoin. Now, this one has taken a really big push with the help of the media, but here’s where we are starting the month of February. The monthly opening price there, 78,235.
So that’s our retracement point right now. Our predicted differences in VP, we’ve got a rising predicted RSI. The neural index is not giving us a green, but there’s a caution, a yellow, with a rising neural index strength.
So that tells me that Bitcoin may see some buying next week. But we are, to be clear, we are definitely in a downtrend officially. We’re below the yearly opening price. We’re below the TROS long, and we’re below the monthly and quarterly opening.
So again, the primary trend is clearly down. So you’re going to have sellers looking to get in. And I believe that they’ll be targeting between the yearly opening and the TROSS long.
But our mean reversion points are between the long predicted and the TROSS long, 72,070 and 80,353. That’s where that mean reversion would take place.
And that’s not based on anything around Fibonacci or any of this stuff, guys. It’s based on more of the science of the predicted moving averages. And we have the monthly opening right in between both of them.
So that’s a big warning sign for me that that’s the area we’re coming back to likely next week.
Crude Oil – $USO ETF
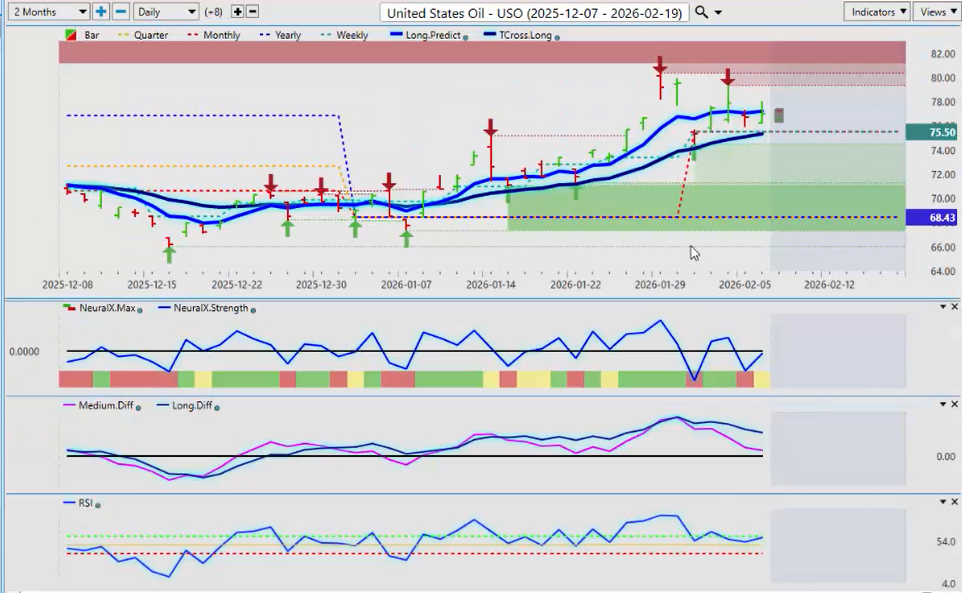
Now, with Oil Contracts, oil, it’s been choppy here, guys, with what’s going on in China, you know, but it’s still holding in there. So USO ETF, things are still structurally looking good.
The yearly opening price, 68.43. Then we’ve got our monthly coming in at 75.50, and the TROS long sitting right there at 75.35. So, some pretty good support here.
Uh, but I would expect a pullback prior to oil’s main seasonal pattern closer to March and April. So, a little bit of down pressure is possible next week.
But always remember, guys, this is an outlook, not a recap of something that’s already happened, and it’s for one week only. I do try and take a bit of a longer-term perspective on some of the markets that I forecast, but it is intended to be for one week only, much like the dollar cycles that I continue to warn people about.
So oil still looking good for longs, as long as we’re holding above that TROS long.
Euro versus U.S. Dollar ($ EUR/USD)

Now, when we go into some of our main Forex Pairs for next week, all eyes are going to be again on EUR/USD. We’ve had a flat week.
Right now, guys, here’s the two key levels that I want to warn you of. The monthly opening price at 1.1851 and the yearly opening price at 1.1732.
Now, here is a strategic play that you can think about if you don’t want to get involved with this daily chop. You can put a buy above 1.1851 and a sell below 1.1732.
And whichever way the market breaks, you’re prepared for it. That’s the advantage of knowing your levels, guys.
Where most people are using Fibonacci, all these different wild and wacky things from the turn of the century, we want to make sure we’re applying intermarket correlations, science, seasonalities in our trade.
So, one way or the other, one of these two levels is going to break.
U.S. Dollar versus Swiss Franc ($USD/CHF)
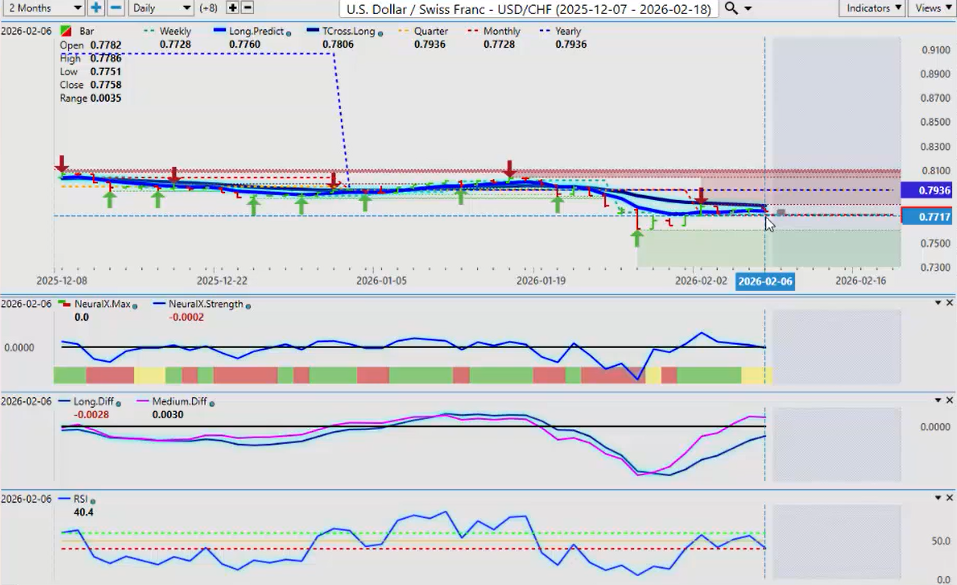
Now, when I look at USD/CHF, again, uh, despite that dollar strength that we saw last week, uh, this pair really didn’t budge.
Now, always remember, in a risk-off environment, when the equity markets are falling, the Swiss franc and the yen are two currencies that will strengthen in a situation like that.
So, if we get more volatility, uh, even if we get dollar strength next week, it may not affect this pair. So be very careful right now.
Again, much like the euro, we are trapped right now between the monthly opening price at 0.7728 and the yearly opening at 0.7936. The pair is officially in a downtrend, and we have our TROS long coming in at 0.7806.
So that’s the level you have to get above. But the all-important yearly opening price at 0.7936, that’s the key one that you’ve got to keep an eye on.
And as you can see, the neural index strength is really not showing any kind of momentum whatsoever.
British Pound versus U.S. Dollar ($GBP/USD)
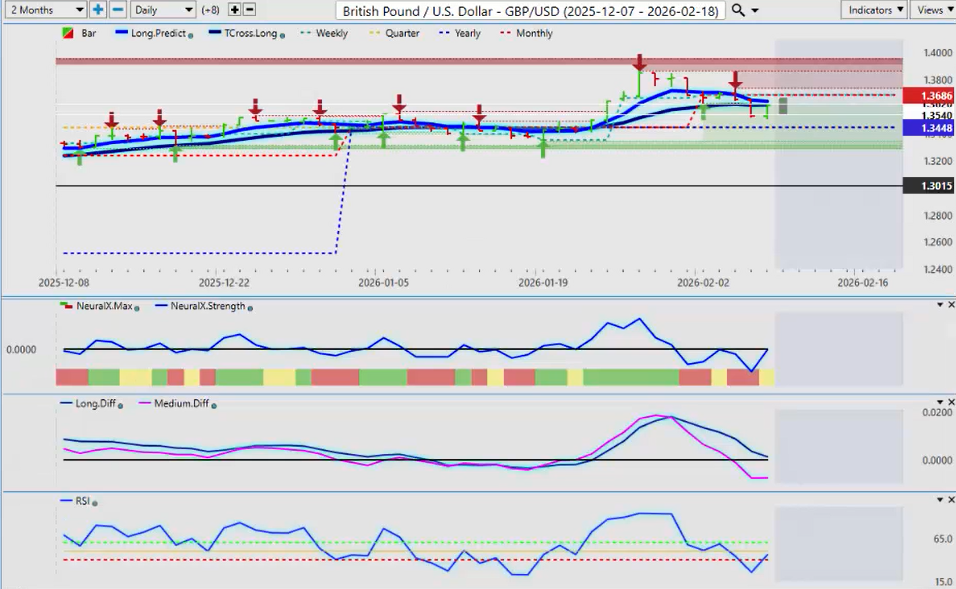
Now, the British Pound, again, a tougher week. The pound came out of the gate to begin the week very strong, but then the Bank of England kicked in, and it sent it considerably lower, but then it rebounded on Friday.
So you can see, again, the monthly opening price, 1.3686, the yearly coming in at 1.3448. So that’s again the levels we’ve got to break here, guys.
And the T cross long is a key level to watch, 1.3610. First of all, what we need to do is get above that, close above that two days in a row, and then, and only then, will we be able to take out the monthly opening price at 1.3686.
So keep an eye on those levels. Very, very important.
U.S. Dollar versus Japanese Yen ($ USD/JPY)
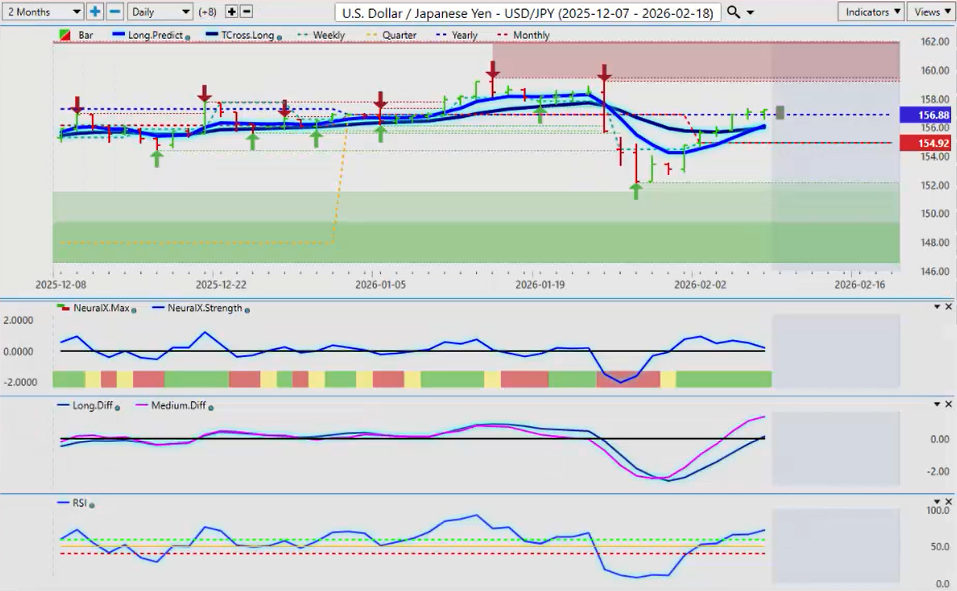
Now, the USD/JPY likely to have a very choppy open on Sunday night, with the, uh, I believe the Japan elections are this weekend. So that’s going to affect the yen right out of the gate on Sunday night. So be careful with this one.
But you can see that they’re betting that this carry trade is going to continue. Now, this is the critical level at this time of year, 156.88, the yearly opening price, and the T cross long, 155.98.
The indicators in VP here are bullish, but that election result could change things very, very quickly, and any statements that come out of that.
So caution, or just let this pair settle in a bit. I would argue Tuesday or Wednesday may be a better time to target this particular pair.
U.S. Dollar versus Canadian Dollar ($USD/CAD)
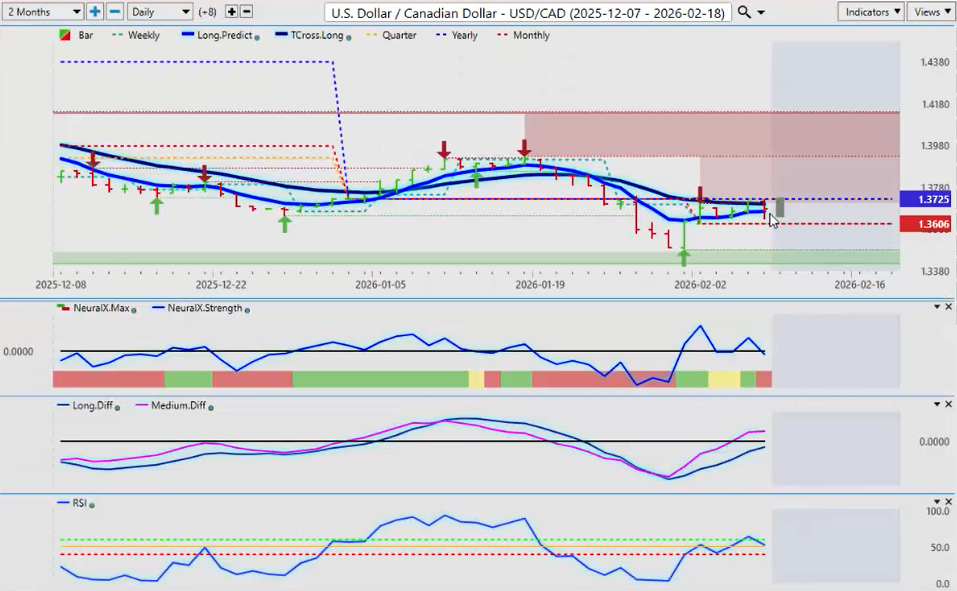
Now, as we move into some of our equity-commodity pairs, the USD/CAD, again pushing up against that calendar yearly opening price and the TROS long. They’re both sitting right there.
Now, here’s the play once again, guys, because this is an outlook, not a recap of what’s gone on the past week. We’re forward-looking.
So in this particular scenario, one could put a buy stop above the yearly opening price at 1.3725. One could also put a sell stop order below the monthly at 1.3606.
Because on a break of one of these two levels, guys, we’re going to get a bigger move.
With the North American free trade talks up for negotiation, everything that’s going on in Canada doesn’t bode well for the Canadian dollar, but that could change if there’s a deal made there.
But I don’t really get the feeling that the US administration wants a deal with Canada. So that could keep the pressure on it.
But again, those are the two key levels. And right now, the T cross long is protecting that very important yearly opening price.
So a break of this level, you could see a rise very quickly back up into the 1.39 area. So always keep that in the back of your mind.
Australian Dollar versus U.S. Dollar ($AUD/USD)
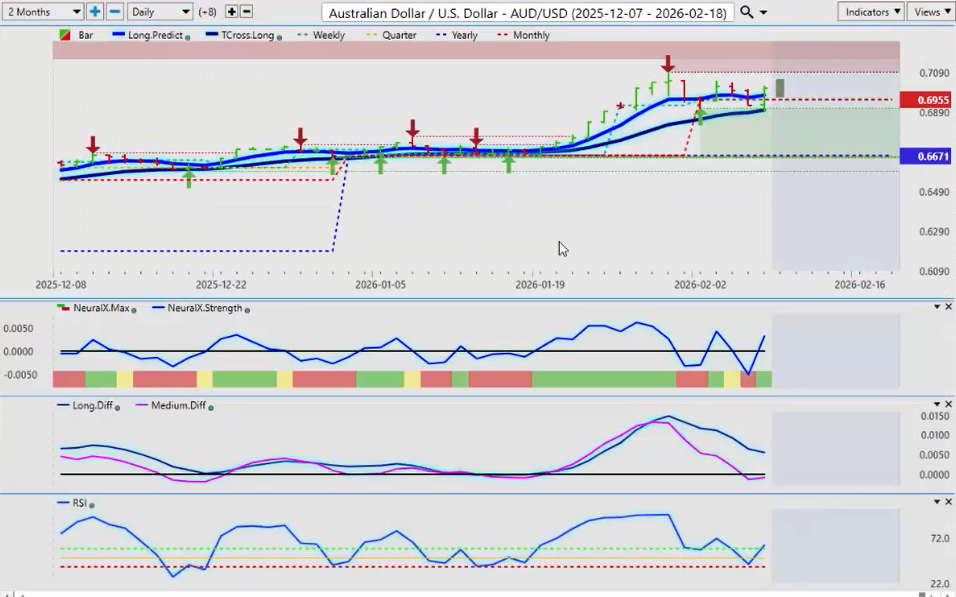
Now, the AUD/USD, uh, one of my particular favorites, to be perfectly honest. I’m a big advocate of buying this pair, and I like the NZD/USD too.
We’ve had a heck of a year right out of the gate here. This has been one of my favorite places to sell US dollars.
And again, we do have a new verified resistance high at 0.7094. That’s fine. We’ve got a retracement back to our TROS long, which has absolutely nothing to do with accumulation, distribution, Fibonacci, or these kinds of things.
It has to do with the static pivot level of that TROS long, the predicted moving average. So that level is critical for next week, 0.6902.
We need to hold above that level. I would prefer we stay above the monthly opening price at 0.6955, and that can open up the door to a much bigger move to the upside.
And again, if we go back and we look at this one year ago, you can see the AUD/USD really took off in April, but it did very well until the end of February.
So just a little side note, just kind of warning everybody ahead of time that we could see some selling on the Aussie near the end of the month.
But until then, as long as we’re holding above that TROS long, things look very good for the Aussie.
New Zealand Dollar versus U.S. Dollar ($NZD/USD)
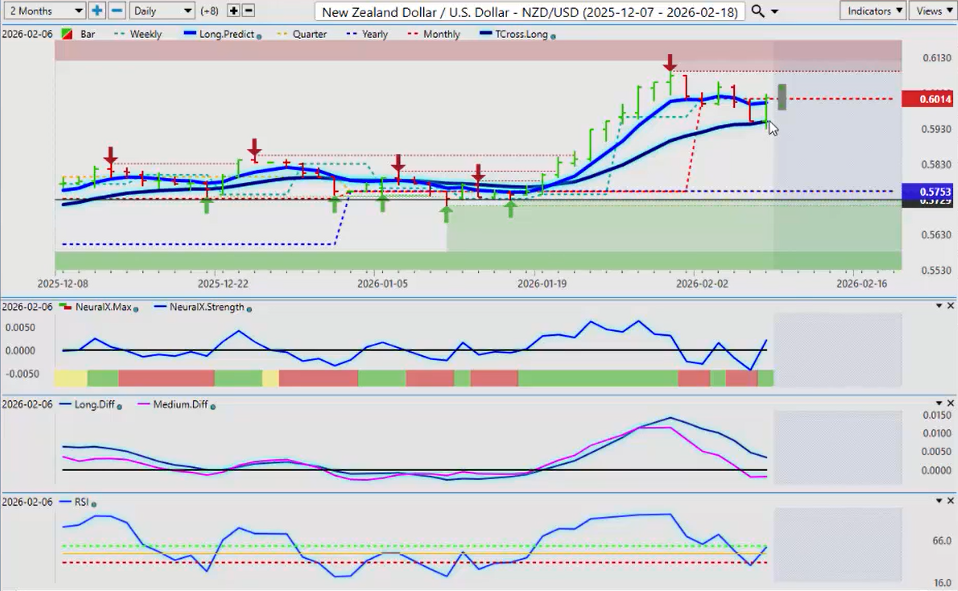
Same thing for the NZD/USD. The Kiwi is holding a very similar pattern. We look at the neural index, we look at the primary trend, which is clearly up, guys.
People, and I hear this all the time, people arguing about what the actual trend is. Well, if we look at where we closed the week on Friday, we’re positive on the year by 4.43%.
There is nothing to debate on this. The trend is up. Does that mean it’s just automatically going to go higher? Well, not necessarily, but it tells us what the trend is.
And then we layer in the TROS long and say, okay, well, the TROS long that’s coming in at 0.5950.
So the only thing that’s keeping the Kiwi down is the monthly opening price at 0.6014. So if we can get above that, then again, I believe that this pair has plenty of room to the upside.
You know, it wasn’t that long ago here, guys, that I was trading this thing pre-COVID up near the parity level, and the Aussie, I believe, was over the parity level.
So could be some very good opportunity with both of those particular pairs.
So, with that said, this is the Vantage Point AI market outlook for the week of February the 9th, 2026.


