


Welcome to the Artificial Intelligence Outlook for Forex trading.
VIDEO TRANSCRIPT
VANTAGEPOINT AI MARKET OUTLOOK
Okay, hello everyone, and welcome back.
My name is Greg Firman, and this is the VantagePoint AI Market Outlook for the week of January 12th, 2026.
U.S. DOLLAR INDEX
Now, to get started this week, we will begin where we always do—with that very important U.S. Dollar Index. Now, we see the dollar rising here, moving up, but again, in most cases, a week after the non-farm payroll number, the dollar is weaker. So what we would be looking for is a retracement in the dollar back up towards our T-Cross long at 12,619.
Now, the payroll number out of the U.S. was not great, but it wasn’t bad either. So again, I don’t think there’s enough in that to move the Fed to a rate cut going forward out into March. So the dollar should fail near the T-Cross long this coming week.
Now, that does support gold longs.
GOLD AND SILVER ($XAU/USD)
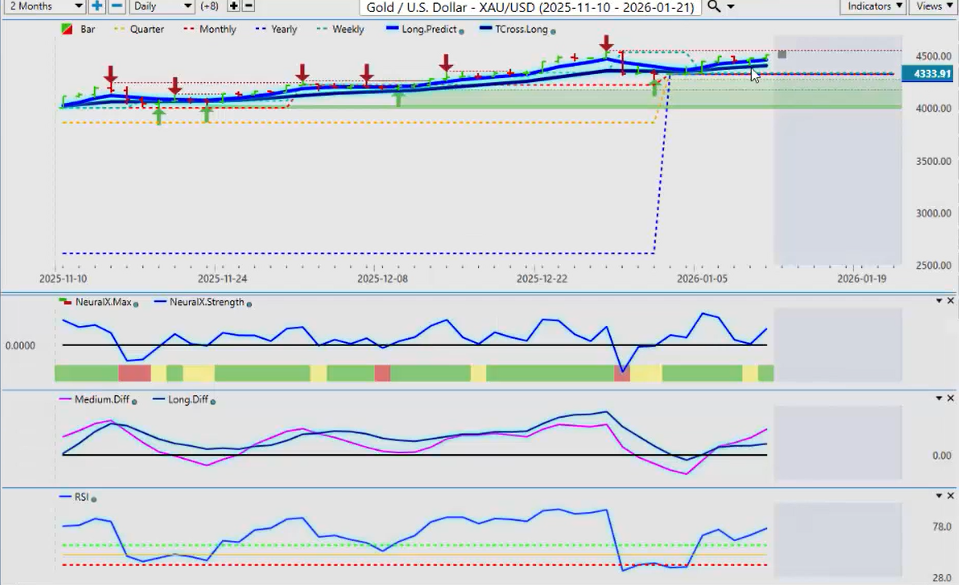
Now, Gold is holding above its yearly opening price. Very important to watch the 4,408 level. If we can continue to hold above that, then Gold, Silver, and a number of other metals should continue to move up.
Now, we do have an MAF cross back to the upside. And the main thing I want to point out here is that both the medium- and long-term crossovers have completed, and they’re both above the zero line. So again, that’s a firm trend to the upside still in place, in my respectful opinion, with the critical level again at 4,408.
EQUITY MARKETS – U.S. AND GLOBAL
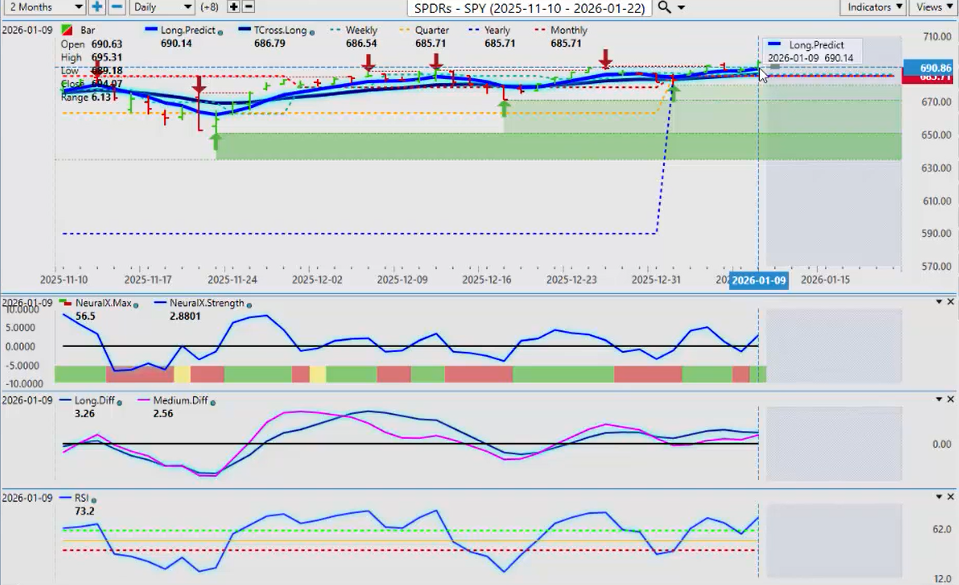
Now, when we look at the equity markets going into next week, this should be interesting. The SPY, the NASDAQ, I’m a strong advocate for the DAX and the Russell. I still like those two of the main global indices.
But looking at the SPY, we’re well supported on the yearly opening price. That’s at 685.71—quarterly and monthly, obviously the same price this year. Now, our predicted differences are holding above the zero line. The predicted RSI still is warning us of upward momentum.
Despite these very lofty levels in stocks, they still look very good. So as long as we’re holding above the key area, this one’s pretty easy to identify. The support is at 685.71, and our T-Cross long is sitting at 686.79. So all of our support is sitting right at that particular level. If you believe we’re going lower, then you would want to make sure your sell stop is below those critical levels.
DAX ETF AND DAX FUTURES
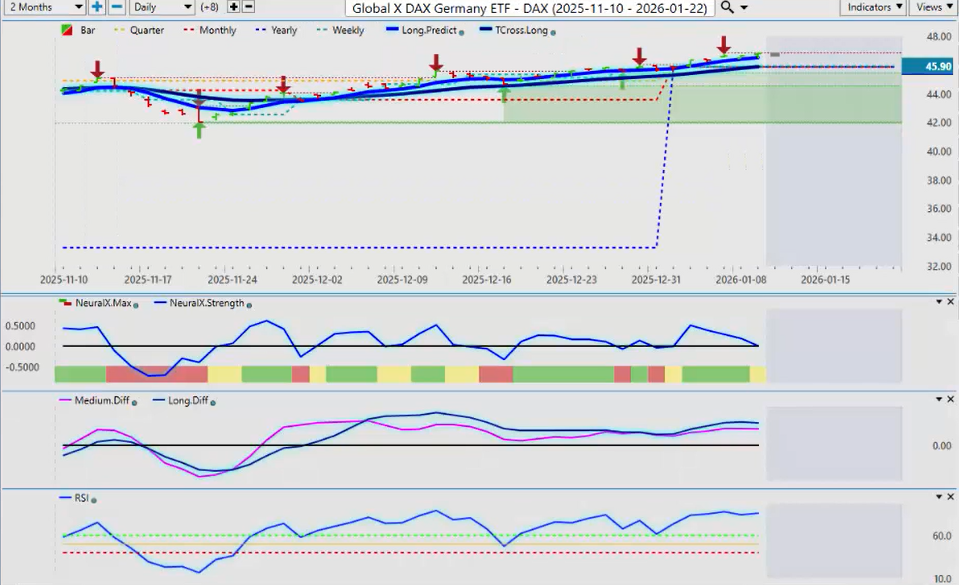
Now, when I look at the equities from a global standpoint, we definitely want to make sure we’re looking at the Global X DAX ETF. Now, it mirrors the S&P 500, but once again, it’s starting off the year showing strength.
A little bit of a concern with the neural index strength indicator pointing down, but for now, it still looks pretty decent for longs. Regardless of whether you’re in DAX Futures or the DAX ETF, this ETF has been very accurate as of late.
So longs are still in play, but a corrective move lower would be perfectly normal back into the 45.87 area—45.86 for the calendar yearly opening price. So as long as we’re holding above that level, longs are still the better play, in my respectful opinion only.
BITCOIN
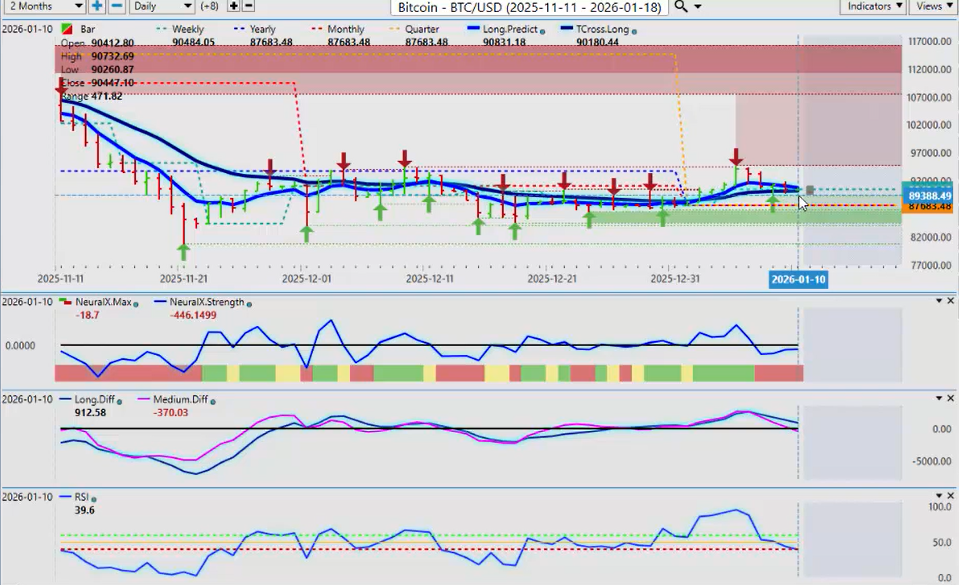
Now, Bitcoin too is holding above those critical levels—the monthly opening and the yearly opening price. So everything is sitting essentially right around 87,683.
We need to stay above that level if we’re going to continue to buy Bitcoin. Now, a little bit of a concern—the medium-term crossover has occurred. But always remember, guys, we only use the medium-term crossover and validate that once if we break down below the T-Cross long. That area is at 90,180.
So we need to break down below that and close below it for two days in a row. But in my respectful opinion, the critical level again is that quarterly yearly opening price at 87,683. We must break down below that if crypto in general is going to move lower.
CRUDE OIL ($USO)
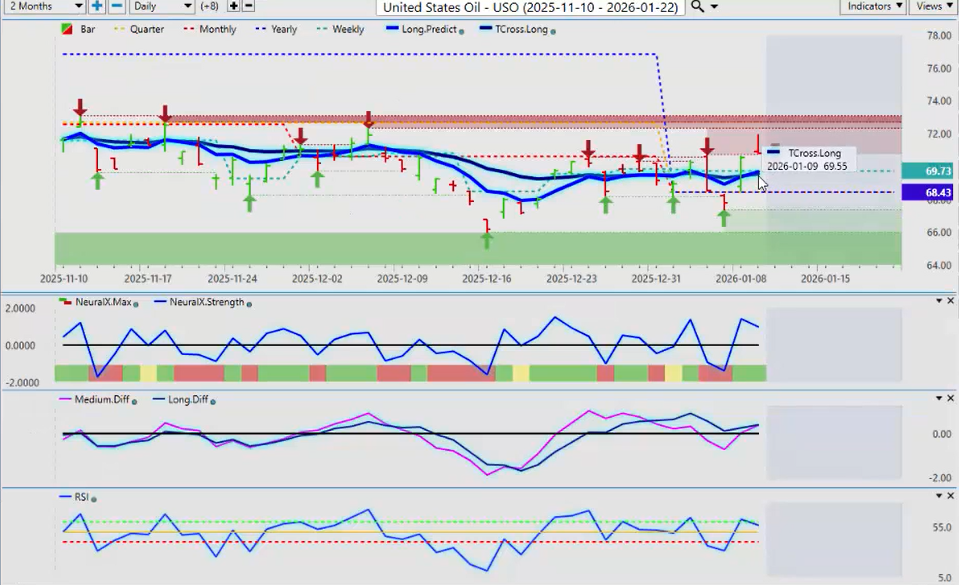
Now, on the energy side with Crude Oil, we can see that oil is again moving on either side of the yearly opening price, but we’ve only had one day below it. The other ones, you can see that they were buying off that area.
We had a false break lower, then we immediately rebounded. Now again, I expected a little bit more of a risk-off scenario this past week, but we didn’t get it. But we did get a lot of volatility in oil, and again, be very careful about using too tight stop losses in this type of market.
So for now, Crude Oil remains on the bullish side while we hold above 68.43, and more specifically, we want to hold above that T-Cross long at 69.55.
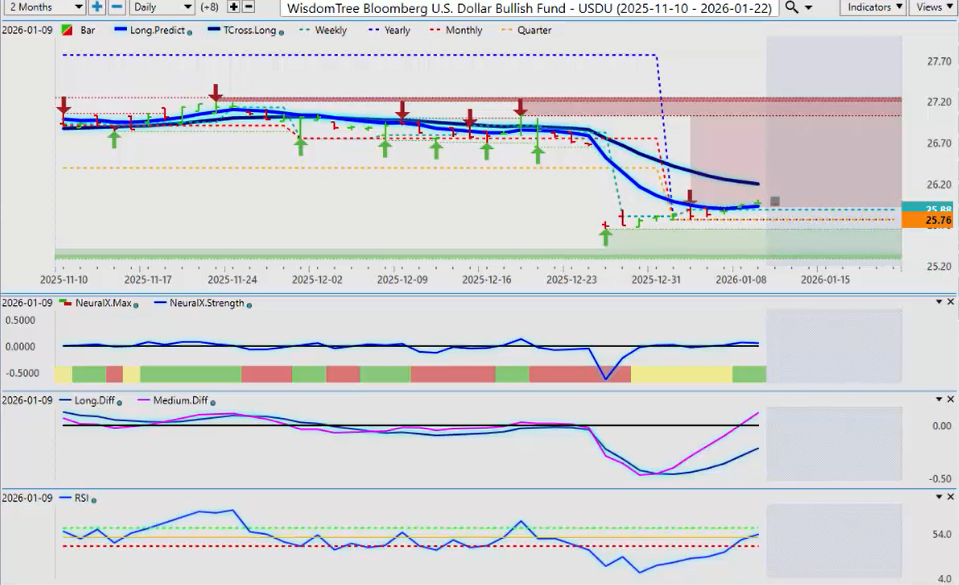
$VIXY – VOLATILITY INDEX
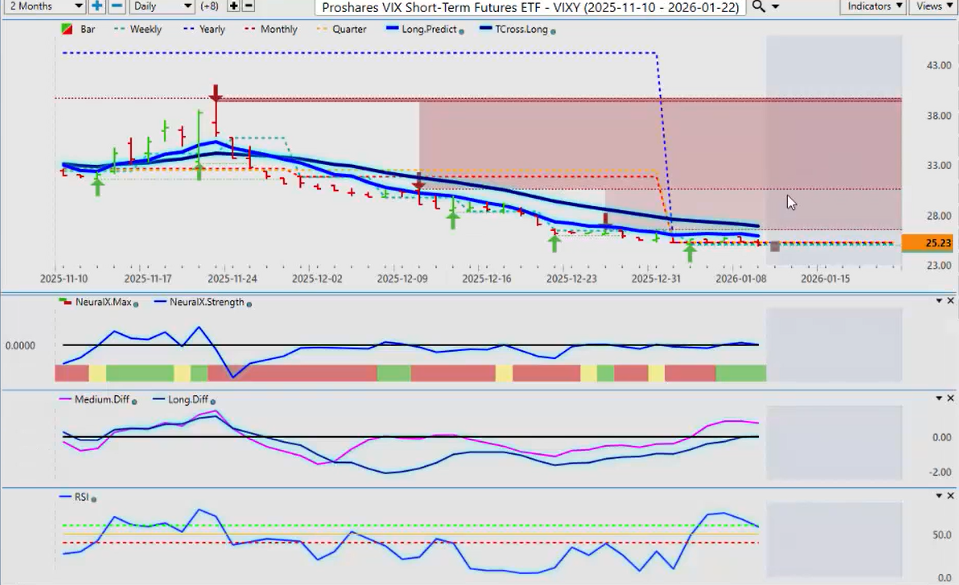
Now, a quick look at the VIX market to see what it’s doing. And again, the VIX is sitting right at the breakout point to the downside—the yearly opening price at 25.23. Our T-Cross long additional resistance is 26.92.
So that’s the key area. If you’re going to short this thing, that’s where it would be. Again, we’re losing momentum to the upside, so shorts on the VIX still look to be the reasonable play.
Euro versus U.S. Dollar ($EUR/USD)
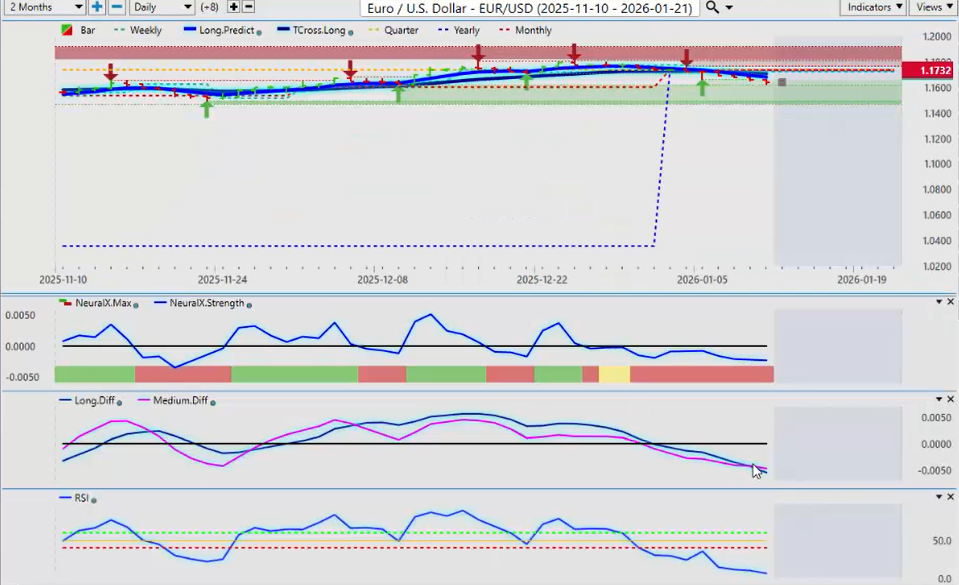
Now, as we look at some of our main forex pairs, I’m just going to do four this week because, again, I am in Tampa doing the VP P Summit.
So once again, when we look at the main forex pair, EUR/USD, all eyes are going to be on that one to see if it can reverse. Right now, we do have a warning sign. The primary trend is down—I would certainly agree with that.
However, in most cases, again, the week after the non-farm payroll number, the dollar tends to run out of steam. So again, I would expect a move lower on Monday and probably part of Tuesday, and then watch out on Wednesday or even mid- to late-day Tuesday for a potential reversal. That is a very powerful reversal tool in the VP software.
The medium-term trend to the downside is shifting to the upside. Now, this would just be a corrective move in most cases, but either way, it’s a warning to be careful with shorts.
Australian Dollar versus U.S. Dollar ($AUD/USD)
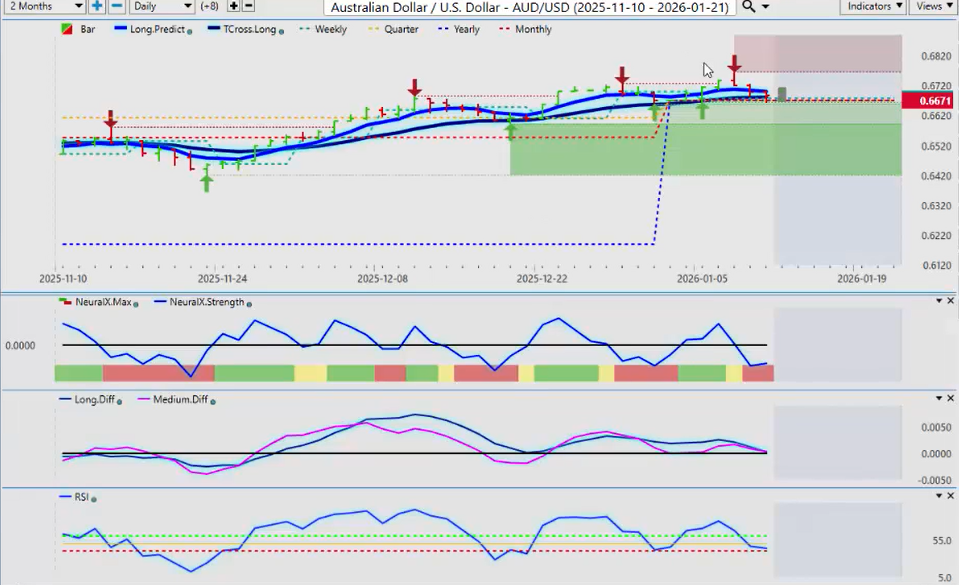
When I look at the AUD/USD pair, the same thing here—we’re holding right on the yearly opening price. So if the Aussie is going to turn around, it would probably be midday Tuesday.
A little concern with whether the Fed is going to be able to cut anytime soon—that’s certainly an issue. But either way, the main thing, guys, know your levels. The T-Cross long is 68.882. Yearly opening price coming in at about the same price, 66.71.
If we’re holding above that level, then we’ve got a trade. Now, the neural index strength is very interesting. The neural index itself is down, meaning red, but you can see that the neural index strength is flattening out.
Our predicted differences are still above the zero line, and the predicted RSI is not showing momentum. So watch for a potential long here early in the week.
U.S. Dollar versus Canadian Dollar ($USD/CAD)
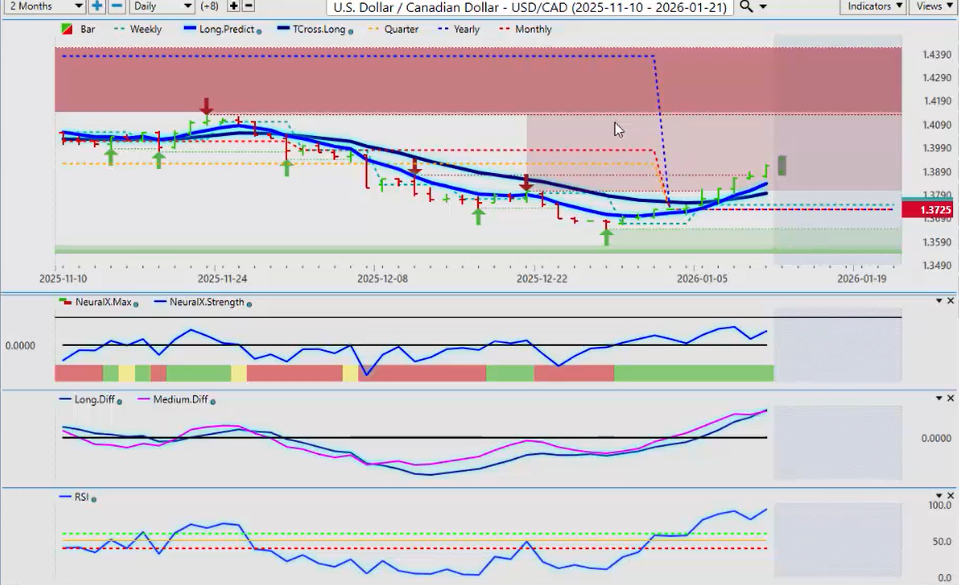
Now, when I look at the USD/CAD pair, once again, this pair bounces around all over the place here, guys. And with stronger oil prices, not even that helped the Canadian dollar.
But I would respectfully submit that if we start getting up into this verified zone around 140, this pair would run out of steam. I would definitely watch this one for a counter-trend short.
And you can see the MA diff cross is trying to form. So if we can get that pink line over the blue line by Tuesday’s update, then I think we do have a short here. Because again, this is an outlook, guys—not a recap of something that has already happened the previous week.
We’re looking forward-thinking here. So if that pink line can cross, then we would have a counter-trend short at nothing, at the very least, back to our T-Cross long at 137.97, and potentially to the yearly opening price at 137.25.
British Pound versus U.S. Dollar ($GBP/USD)
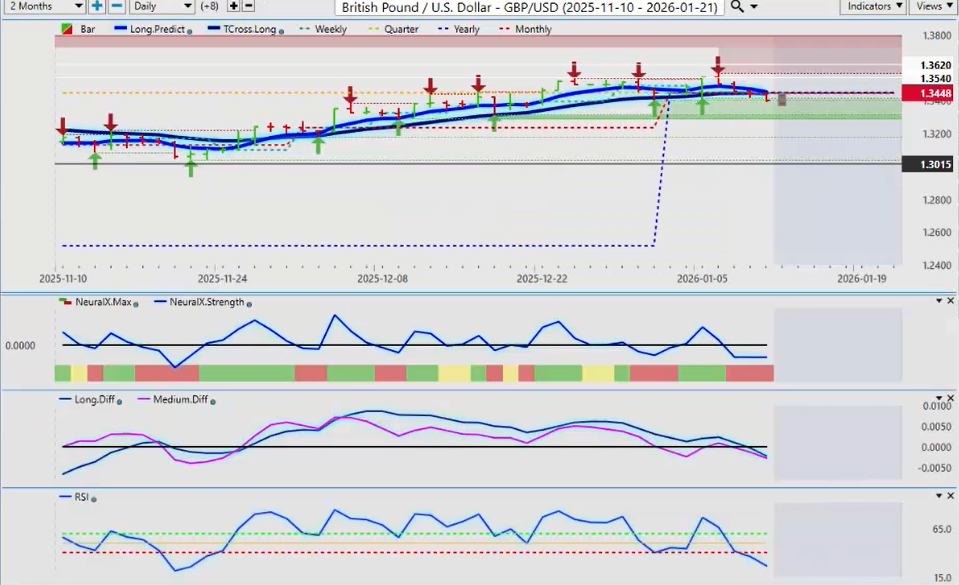
Now, the GBP/USD, another one to keep a very close eye on. The bulls and the bears are fighting it out right around the T-Cross long at 134.41. The yearly opening price is 134.48.
So for the savvy trader, if you believe, like I do, that ultimately this one could probably go a little bit higher, then I would simply wait for it to pass over these critical levels with a buy stop—say roughly about 134.60. We clear that area, and then we start moving higher.
However, if we can hold below the yearly opening price at 134.48, then the downside remains intact, and we would be below that calendar yearly opening price.
U.S. Dollar versus Japanese Yen ($USD/JPY)
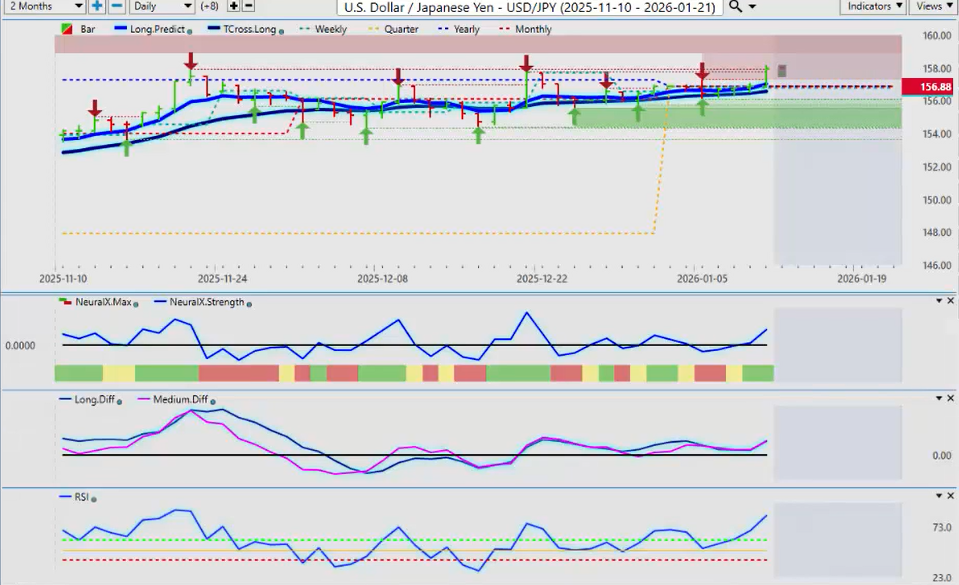
So very important to watch some of these markets, but everything will center around that very important U.S. Dollar Index. And I think the USD/JPY should be an interesting one too.
Once again, hard to believe that we have buyers up here at that critical level—the yearly opening price at 156.88. But if the market believes the Fed is not going to cut, the carry trade is still in place, and this pair actually could move higher.
So again, I believe we have some CPI data next week. You’ll see more volatility, but with that, there will always be opportunity.
So with that said, this is the VantagePoint AI Market Outlook for the week of January 12th, 2026.


