


Welcome to the Artificial Intelligence Outlook for Forex trading.
VIDEO TRANSCRIPT
VANTAGEPOINT AI MARKET OUTLOOK
Okay, hello everyone, and welcome back. My name is Greg Firman, and this is the VantagePoint AI market outlook for the week of January the 19th, 2026.
Now, to get started this week, we’re going to do things a little bit differently. Now, what I want to talk about here briefly, uh again, the comments section in here is usually open, uh and that’s for constructive,
positive, and uh you know, comments of that nature. But every once in a while a comment is just so far out there that it needs to be addressed. And the comment was that the past is not the future and the US Dollar is a go.
US Dollar
So let’s really look at that for a second, shall we? And again, all technical indicators, guys, are based on past data. The whole theory behind it is that history repeats itself.

Now, if we look at a 200 plus year study of excess returns of a multi asset portfolio, the seasonality is at the top of that list on a performance basis, which is based on price, past price data, past price patterns, patterns that repeat each other.
We’ve all heard of sector rotation in stocks each quarter. Certain stocks do better than other stocks. This is a real thing here, guys. So again, we’re we’re certainly all entitled to our uh opinions, but we most certainly are not entitled to our own set of facts. And these are facts.
Now, when we look at further into this, my argument here is that the dollar predominantly does not do well midmon. And there’s a reason for that.
If we look at this from uh this is an intern actually from Goldman Sachs, the dash for cash monthly market impact of institutional liquidity. Again, we want to look at facts, not opinions that are not based on anything other than that somebody’s opinion.
Uh, when we look at this, this gentleman also we present broad based evidence that the monthly payment cycle induces systematic patterns in liquid markets around the globe. First, we document temporary increases in the cost of debt and equity, uh equity capital, that coincide with key dates associated with month end cash needs.
So again, what that means here, guys, is again that at certain times of the month, dollars, for example, are required. Nobody is required to buy a stock, an ETF, a futures contract, but they are required to buy Canadian Dollars, US Dollars, Euros to settle trade balance with the US.
We have pension money that has to be paid out at the beginning of the month. So, when we look at this just over a one year basis, I noticed the same thing this this intern from Goldman Sachs did. He wrote that article in 2018. I noticed it long before that, but the fact is I noticed it.
So, when you look at a chart here, guys, and again, when we’re talking about the past is not the future, that is not based on any type of relevant fact that I’m aware of with regards to trading.
This pattern is very clear. At the end of the first week of the new month, the the dollar tends to cycle, or the cycle tends to be that the dollar weakens.
So, when we look at that here going back into December or January, February of 2025, we can see the dollar struggles after that first week. We see it again in March, a big drop. When we look at it in April, the same thing.
The week after this week that we just finished actually is usually the end of the dollar rally. We can see right here in May the dollar had an extra week of liquidity or an extra week of buying, but ultimately it dropped again.
So then again, when we keep going with this into June, the same thing. After the week of the 13th, the dollar tanked. We see a little bit of a difference there again in July as we come up in to the week of the 18th.
Basically, it’s showing us that the dollar in the in the third and fourth, well, about the about two and a half weeks in, the dollar really struggles.
Right, we look at it in August after the 8th, same thing. Again, when we look at it in September, same thing again. When we come over here into October, same thing again. When we start moving into the next week, it points towards weakness in the dollar again.
The same thing occurred in November. When we look at November, December, excuse me, of 2025, same thing again.
So this, if it happens once, guys, it’s a coincidence. If it happens ten out of twelve months of the year, it’s no longer a coincidence.
So we need to look at these things and gauge that because all future price points are based on the past data.
If we look at how we forecast the weather, well, we don’t wait for it to start snowing and saying, well, okay, I think it’s going to snow because it’s snowing.
No, what we do is we look at historical price, or we look at historical weather patterns in the month of January. What usually happens in Canada? What happens in Florida? What happens in Hawaii?
But the fact of the matter is we can gauge what the average temperature is going to be. How much rain are we going to get? How much snow are we going to get? And it has a degree of accuracy of about 80%.
So again, when we’re talking about factbased trading and saying that the past does not influence the future, there is absolutely nothing based in fact that would suggest that that statement is true.
So we need to have an open discussion about this. This is again, this is a weekly outlook for one week only, guys, and it’s intended to be for educational purposes to show you things like this that are factbased, to say that there isn’t a a regular price pattern.
And this isn’t just this is just one year. I’ve seen this going on for over 20 years now.
And again, if we’re not looking at these price p patterns, then how would we ever get a portfolio to have this kind of success when we layer in inner market technical analysis with seasonal patterns or repetitive price patterns?
If nothing else, even though we’re still speculators like everybody else, it does give us a significant edge, right? That is the whole theory behind that.
U.S. Dollar Bullish Fund ($USDU)

So if we look at over the last several months, I have implemented the USDU as as a better alternative to the US Dollar Index. And I will demonstrate this right now.
When we look at the USDU, if you Google the Wisdom Tree uh US Dollar Bull Fund, then it shows all the liquidity needs for the US Dollar against all the other global counterparts.
It’s not all weighted to the Euro. The Dollar Index, the UUP ETF, is all weighted to the Euro, guys. So if you’re trading EUR/USD, I guess it’s okay. It’s good for that.
But the USDU measures the broader dollar strength and weakness.
So we can see this past week, as I had discussed exactly in last week’s outlook, and said I believe we will come back up to the Tacross long and we will fail there.
I said that before it happened, not after, because I have seen this pattern over and over and over and over again.
It’s not about being right or wrong or trolling internet YouTube websites giving your opinion that’s not based on fact. It’s about facts, cycles, repetitive moves in the market.
So, as I discussed in last week’s outlook, that this USDU DU is showing me, is giving me a better idea of how the dollar is actually doing.
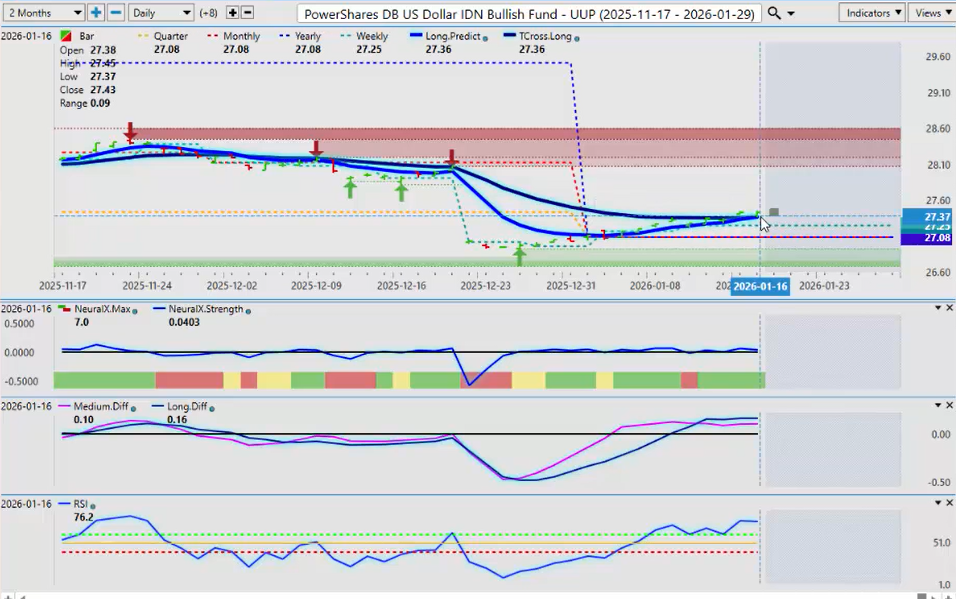
So again, when I measure that against the UUP, I could see how somebody may be somewhat confused by this because this is giving a different signal.
But there’s an MA diff cross on both of these, guys. But whether it’s right or whether it’s wrong, the first thing we have to do is identify this particular pattern.
And again, that is a clear warning sign that this move up in the dollar, as small as it was this particular week, this past week, the actually the dollar didn’t even make gains against the Kiwi or the Aussie and in several other currencies.
But this is considered a failure, and that was discussed again before it happened, not after.
This is an outlook, not a recap of something that already happened.
Gold
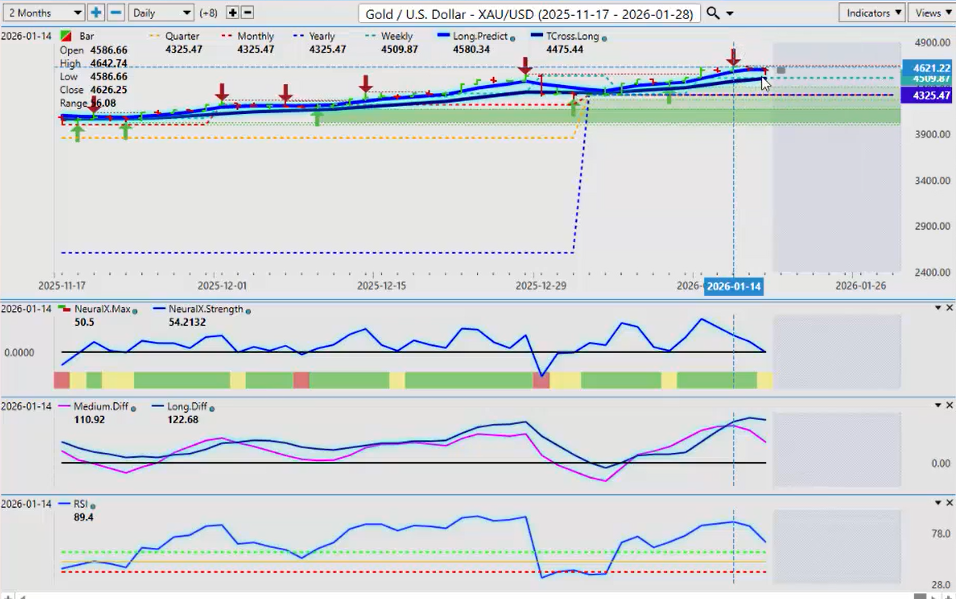
Now, when they made that comment, they managed to push Gold a little bit down here, as you can see, that uh once again Gold is struggling a little bit up here, but the media is trying to influence people.
If JP Morgan is trying to push the dollar strength, then chances are, guys, they’re going to be short on that and they’re trying to get the market to go the other way, because it doesn’t match the price patterns that I showed, right?
But the other more recent example I can give you of this is Goldman Sachs putting out, when Oil was trading last month at 50 some dollars a barrel, they put out a price projection target of $30 a barrel for Oil.
I immediately said, “Buy Oil right now.” And Oil immediately reversed and is back up over $60 a barrel.
It’s a setup, guys. We’ve seen this time and time again of of the media trying to influence influence to go the influence us, excuse me, to go the wrong way.
So, Gold right now is correcting mildly lower based on those comments that the Fed is not going to cut and a hike is coming in 2027.
I don’t see any evidence that that is going to happen, and I need a lot more data in 2026 to even think about a hike in 2027.
So Gold remains firm well above the tross long that’s coming in at 454.
Bitcoin
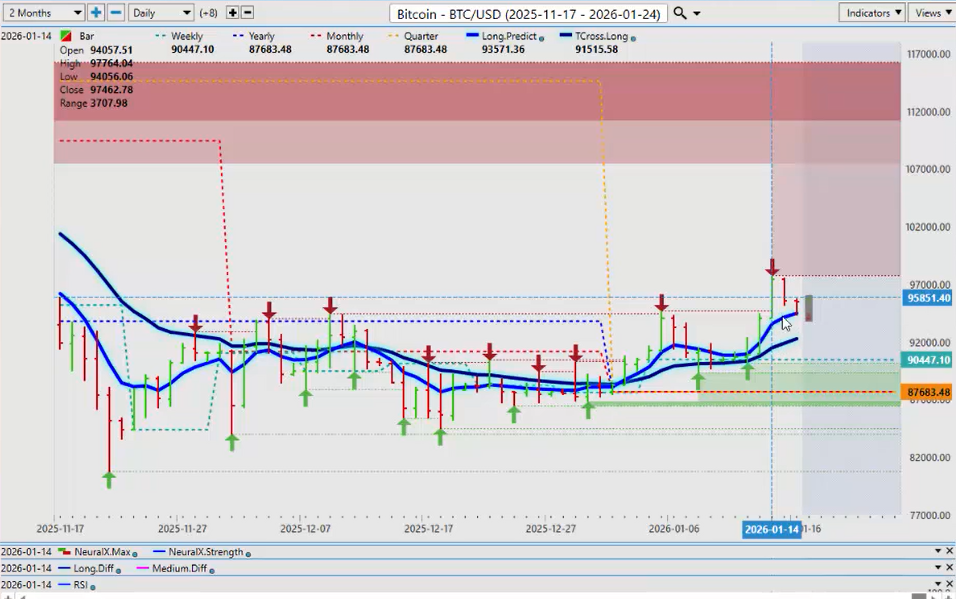
When we look at Bitcoin again, Bitcoin is doing actually fairly well here. It’s it’s uh trying to hold on to its gains.
A little bit of a concern here is that I would like to see Bitcoin above 100,000 to get past that psychological level, but we are above our tross long.
Now again, when you have a high bar of trading, a big volume bar like this comes up, hits and fails, most likely we’re going to see uh a retracement to the mean.
That’s between these two custom predicted moving averages, the long predicted and the tross long.
So the tcross long, long predicted, coming in between 94,000 and 92,000, that is likely a retracement area for next week.
And longs remain in play while above 87,683.
But be very very cautious with Bitcoin longs because in again looking at those historical patterns, past price patterns that are paramount to our success, ignore them to your own detriment, guys.
Uh again, you can troll different websites and give your opinions, but there’s very little facts supporting that.
Bitcoin, three years up, one year down. Three years up, one year down. Last year was the third year of a three year rally, but we had a selloff of about 36% between October and January 1.
That’s what I would have expected in 2026.
So, Bitcoin remains bullish while above the Tcross long and the long predictive.
DAX
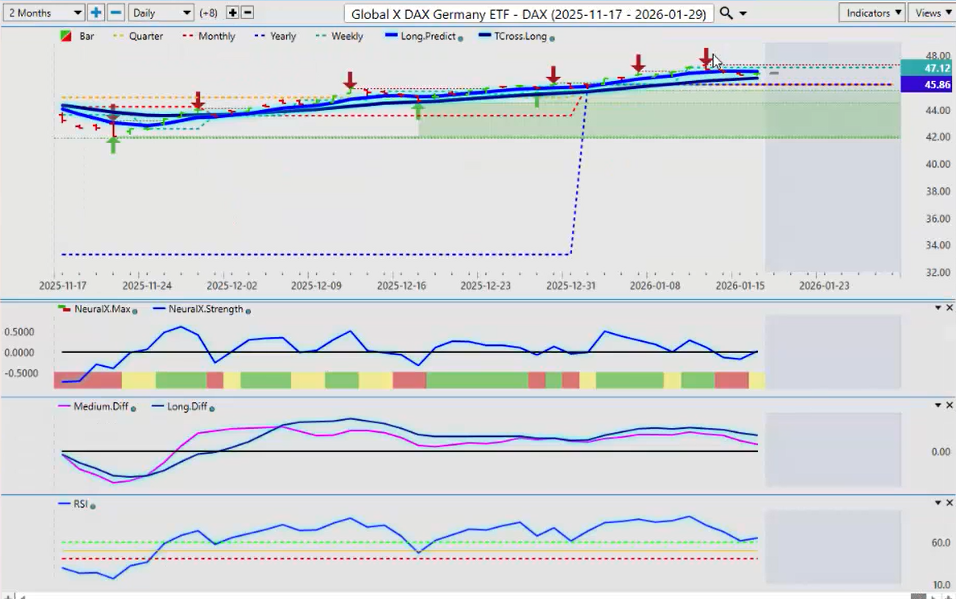
Now, when we look at uh the German equity markets, once again, the uh the global XDAX ETF, which I’ve uh somewhat promoted on here because much like the USDU, it’s giving me a different signal than what the future side is, and it’s been highly effective.
So, the DAX, for now, should the dollar move lower next week, that would support the the DAX longs, S&P 500 longs, Russell longs, NASDAQ longs, even technically Bitcoin longs.
They’re all tied together.
But for now, you can see the predicted RSI is still good. Predicted differences are still above the zero line. Neural index starting to turn back up.
So your key levels here, the tross long 4633, and of course that all important yearly opening price 45.86.
As long as we’re holding above that, whether you’re in in the DAX ETF or DAX Futures, both remain a long trade.
VIX
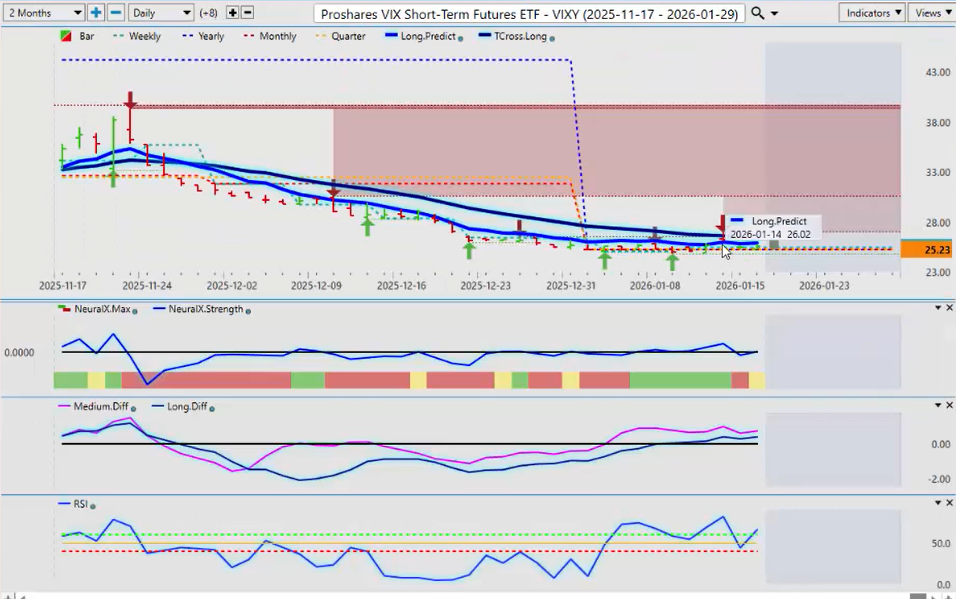
If I look at the VIX from this previous week and looking forward into next week, we had a singular spike up here and we did not close above that TORS long. Right now, the VIX on this particular ETF is stuck between the TROS long at 26.49 and the yearly opening price at 2523. We’re looking for a break of either one of these two levels as potentially as early as next week or the week after. and that will tell us where we’re going.
Now, my concern for the global indices here is that the predicted differences are above the zero and the predicted RSI has had a retracement to the to the 40 level and bounced off of it and it’s actually showing a little bit of momentum.
So, start of the week, we have a US holiday on Monday. I believe it’s Martin Luther King Day. So Tuesday, Wednesday, next week uh is where your real price is likely to start to show itself more towards Wednesday. So be careful with this one on Monday because there’s definitely uh going to be some volatility there.
U.S Oil ($USO)
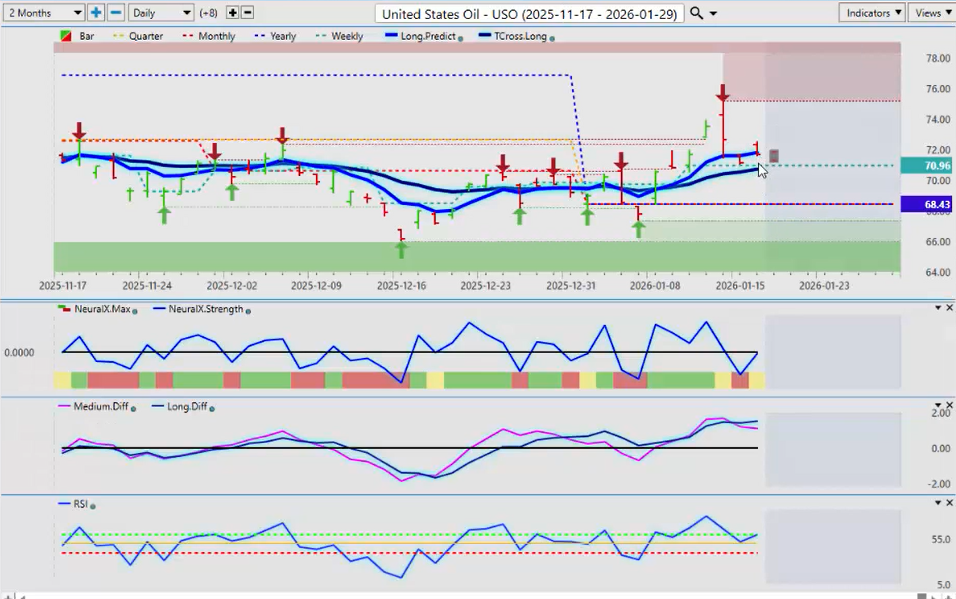
Now when we look at oil prices once again on the last one on the commodity side, oil prices again, it was over here just a week or two ago. I believe it was around this area. was December through to the end of December when uh oil prices were down. Goldman Sachs put that release out. $30 a barrel is the target for 2026. And again, it was a setup, guys. They the market completely reversed because they were probably never short to begin with. They were likely on the long side of this and they’re baiting the market in to take the other side of that trade.
So oil prices remain very firm and they’re only going to go higher the closer we get to May here guys. So for next week on the USO our TROS long 7072 and the yearly opening price 68.43 all of our support is sitting right there. Okay.
Euro versus U.S. Dollar ($EUR/USD)
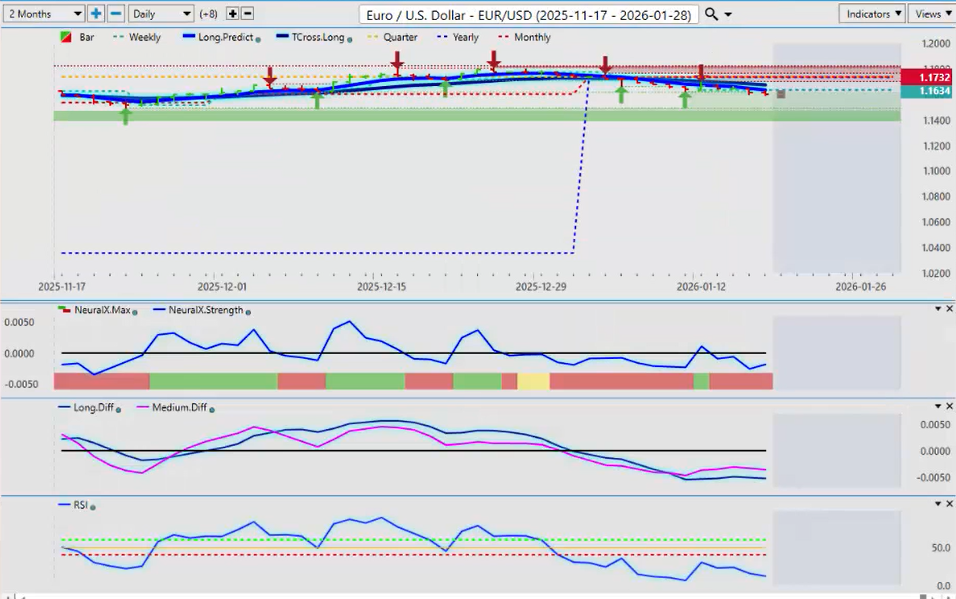
Now when we look at the euro going into next week, the the monthly seasonal pattern, what I can tell on you, what I can tell you here that again is one of the most powerful strategies out there. Vanish offers numerous powerful seasonal tools with the predicted true range at the top of that list.
But again it has very very heavy support on the euro down into that allimp important uh seasonal projected low which is around about the 11520. So any move lower on this is in my respectful opinion only is better to be on the long side. We still have the MA diff cross. Yes, it’s under pressure.
But when we look at the trading for the week here guys, this is where it gets very interesting. All your price pressures on the euro have been we came out of the gate right out of the gate opening the week at the uh the 16 about uh about 11625 we opened on the week actually and then we went straight up to 117.
So the bulk of the trading volume to the upside then we’ve slowly grinded lower and then finishing the week out about down about 20 pips. So not exactly a US dollar go. the the same thing with the British pound pretty much ending the week flat. The uh going forward into this, we’re looking for reversal indicators is what we’re looking for, guys, to see if there’s anything.
So, if the if the the dollar is going to weaken again, it’s usually into the into the second week of the new week, but midmon by the charts that I’ve shown you on here, take it for what you want, predominantly the dollar does not do well. That’s what I’ve traded over and over again.
Do I buy dollars during the course of the month? Of course I do, guys. I buy at the end of the month into the first week of the new month on a on a regular basis every month. But I predominantly sell the dollar midmon every month also successfully based on the pattern.
British Pound versus U.S. Dollar ($GBP/USD)
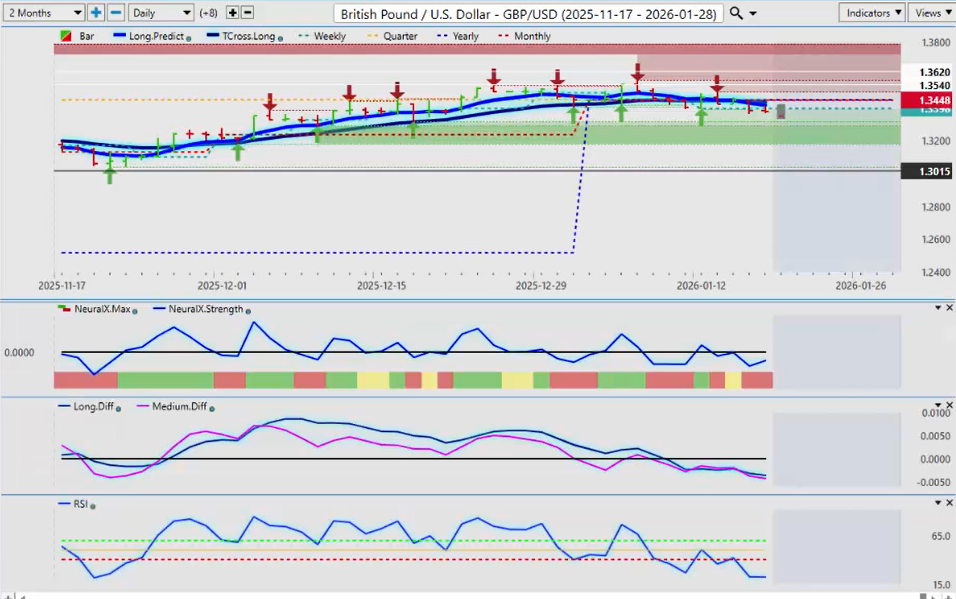
So the the euro and the pound, same trade. They’re basically finishing the week down about 15 20 pips each uh after making a significant gain. The British pound at the beginning of the week starting the week off the open right off the opening of the week 13398 and then went on an absolute tear all the way up to almost 135.
So again, selling dollars right out of the beginning of the week was the play, guys. And it’s not again, it’s not about being right or wrong. It’s understanding how this thing kind of works.
then the dollar uh then the announcements came out about go with from JP Morgan saying oh no the Fed’s not cutting in 2026. I’ll take the other side of that bet. I bet you they cut at least two or three times. And would I bet that there will be no rate hike in 2027? Absolutely. I’ll bet on that. Uh and I don’t think this current president’s going to be on board with any talk of a rate hike. Uh right.
So we look at that the pound kind of goes a little bit flat. So if it’s going to turn around, we look for our VP indicators next week to to further put more upside pressure. But again, the yearly opening price 13448, guys, that’s the line in the sand. And by the end of this quarter, the end of the first quarter into March, uh I can tell you with a degree of certainty that we are likely to be closed above that particular area.
U.S. Dollar versus Japanese Yen ($USD/JPY)
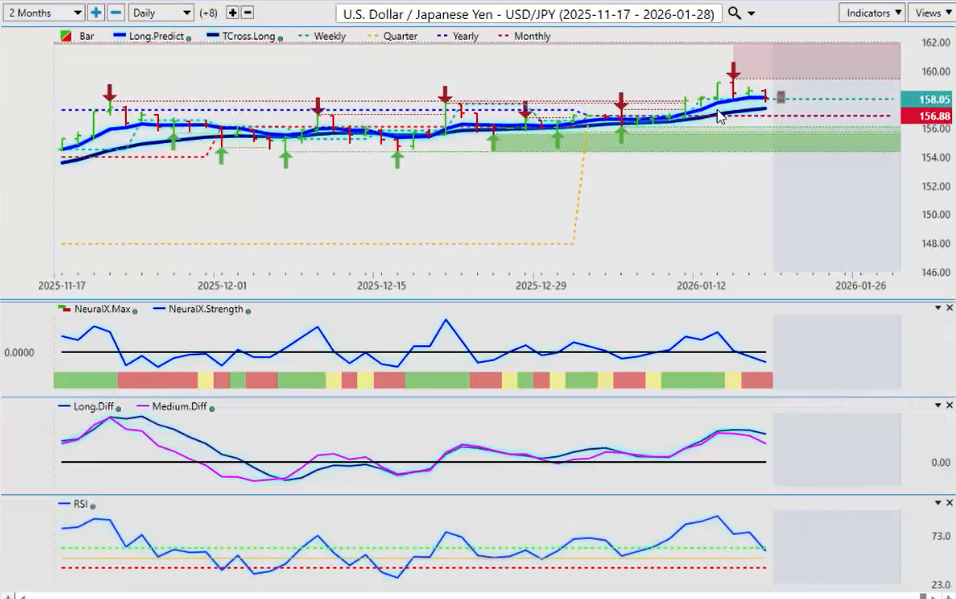
Now, the dollar yen. With the dollar yen, uh, again, the dollar coming out of the week on this one, 245. You can see we’ve got some pressure. So, this is a place where you could potentially have bought dollars at the beginning of the week, but that’s because it’s a carry trade. The yen is virtually zero interest rates. The US is the higher interest rates. That’s the carry trade, right?
But even at the end of the week, the dollar finished negative against the yen. lot of chatter about intervention and I could see it coming but this is a mess the bank of Japan has created for themselves they only have themselves to blame for the currency being at this level right but again a lot of participants very nervous uh to uh about what the bank of Japan’s next move is so be careful of that but for now this is pointing down neural index is down predicted differences are pointing down a falling predicted RSI uh but again, where is the yearly opening price on this 156.88, that’s your line in the sand, guys, this red line right there.
So, for the savvy trader who believes that the dollar is going to lose ground against the yen, uh you would put your sell stops below 156.88 and if the market passes by there, it’ll pick up your short as it does. But again, if the market believes the Fed will not cut interest rates and a possible hike, then the dollar will hold its ground against uh currencies like the yen. Also against currencies like the Swiss Frank, the dollar was be able to make some gains over here. But again, another high yielding currency.
So when we say the dollar is a go, well that’s a very vague comment. The dollar is good to go where? uh well it’s maybe good to go against the yen and potentially against the Swiss frank but not against necessarily against the other currencies. So again that’s a very vague statement.
So when you look at this right now even this is struggling to make any real gains. We open the week at uh let’s see 1 2 3 4 5. Yes, we open the week at 8005 and we close the week at 80031.
U.S. Dollar versus Canadian Dollar ($USD/CAD)
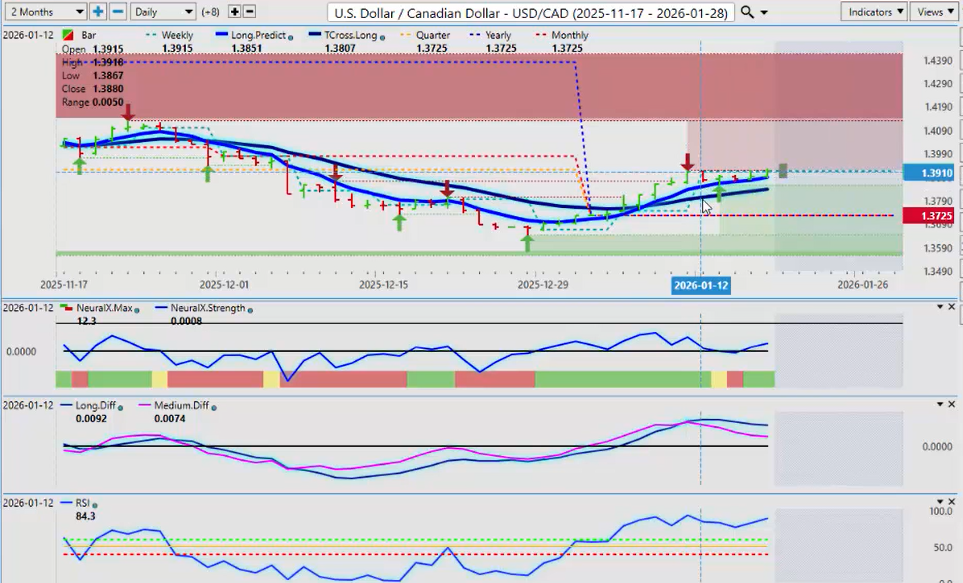
And again, another low yielding currency, right? The US Canadian pair, you can see that really we’ve done the dollar’s done 1 2 3 4 5 right there. You can see that the dollar’s done nothing. Uh in actual fact, most of your pressure on this pair was selling the dollar, not buying it. And and again, we we didn’t finish the week making any gain.
The dollar made no gains against, in my respectful opinion, one of the weakest currencies in the forex market, the Canadian dollar, based on the tariffs and everything else, right? But for now, uh, again, a mixed signal. But if this pair can’t get moving, then I can I can pretty much tell you two months out in advance here, guys, that regardless of what happens with the tariffs, the Canadian dollar is likely to strengthen against the American dollar towards the end of the first quarter in the month of March.
As oil prices start ramping up, we go from winter gas to summer gas. All of this again pri past price patterns guys to even remotely suggest that they don’t influence inner market correlations seasonalities or give us a direct insight as to what a market is about to do is utterly ridiculous. Uh when there’s an overwhelming amount of evidence to the contrary. Okay.
Australian Dollar versus U.S. Dollar ($AUD/USD)
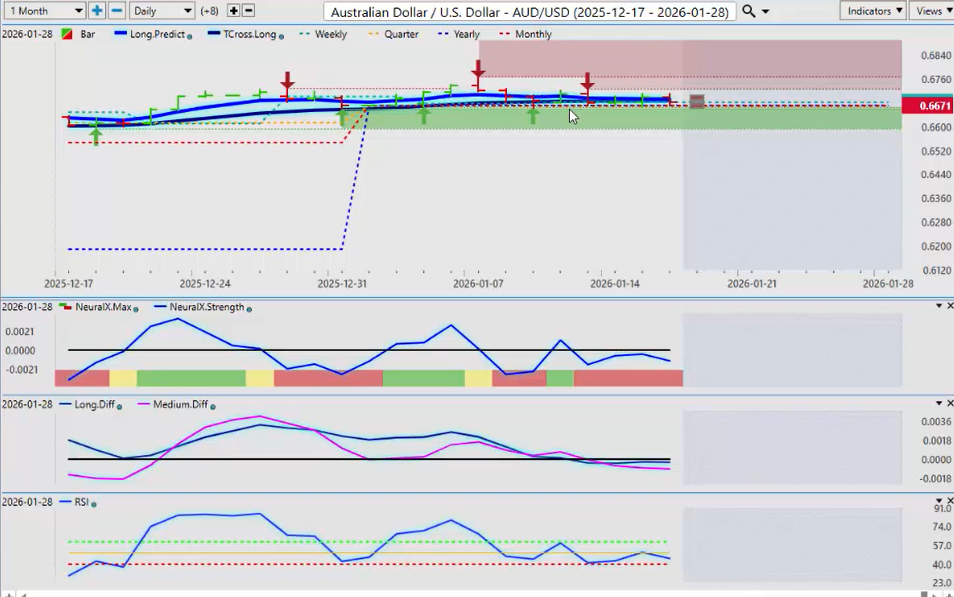
Now when we look at the Aussie and the Kiwi uh this is a pretty easy trade all week guys. Uh we’ve got 1 2 3 4 5. There’s our opening for the week. We’ve got a buy there on Tuesday. We’ve got a buy on Wednesday. We’ve got a buy on Thursday. Each one of these trades running along and again from where we the the US dollar was unable to make any gains against the lowly Aussie currency.
New Zealand Dollar versus U.S. Dollar ($NZD/USD)
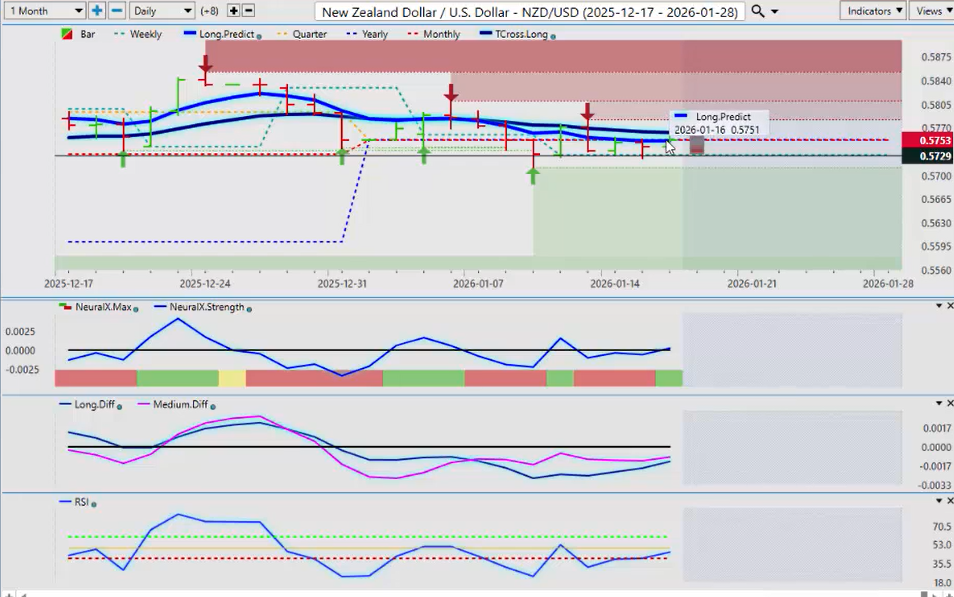
And the same thing I is happened even stronger with the Kiwi. So when you look at that, we’ve got 1 2 3 4 5. We started the week right there. And as you can see, uh there’s a buy every single day off the Monday bar low. Uh we because we’re the US dollar is not making any gains against either the Aussie, the Kiwi, struggling against the Canadian dollar, up most of the week against the euro and the pound.
So again, there’s a rationale why that happens. And and again that would always lead back to seasonal patterns which have a again if you don’t have some type of seasonal tool in your trading arsenal guys uh respectfully you may want to rethink that.
So with that said, this is the Vantage Point AI market outlook for the week of January the 19th, 2026.


