


Welcome to the Artificial Intelligence Outlook for Forex trading.
VIDEO TRANSCRIPT
VANTAGEPOINT AI MARKET OUTLOOK
Okay, hello everyone, and welcome back. My name is Greg Firman, and this is the Vantage Point AI Market Outlook for the week of January the 5th, 2026.
Wisdom Tree Bloomberg U.S. Dollar Bullish Fund ($USDU)
Now, first thing to get started here, happy New Year to everyone. And what we’re going to do is begin where we always do, with that very important U.S. Dollar Index, going into basically the first week of 2026 trading.
So, no shortage of volatility, with an attack on Venezuela, or a strike on Venezuela. So that is likely going to cause some volatility in the equity markets, the oil markets, to start the week. But let’s get started and have a look prior to this.
So, as Vantage Point’s predicted prediction to begin the week—as again, this video is an outlook, not a recap of something that’s already happened—and it’s being done Saturday morning at 10:25 a.m., prior to the markets opening. We always want to be looking forward in our trading, in anticipation of what’s going to happen, not review what’s already taken place.
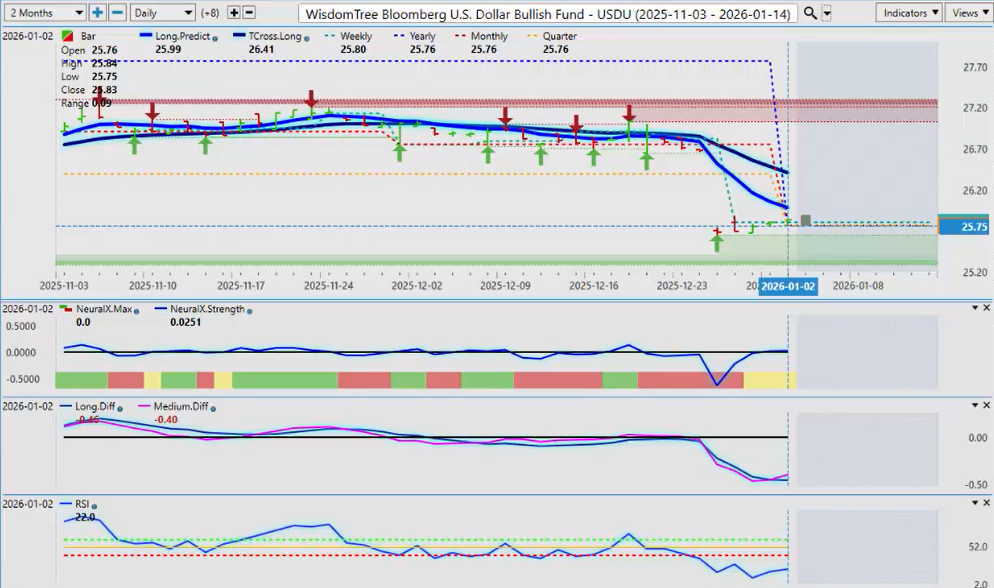
So, when I look at the core indicators from Vantage Point, once again I’ve got my TCROSS long and my long predicted. My mean reversion point is between these two levels, the long predicted at 25.99 and the TCROSS long at 26.41. I have an MA diff cross, the pink line over the blue line, warning me of potential dollar strength.
Now, you remember in 2025, and multiple other years when I’ve looked at this, the U.S. Dollar is usually strong in the first week of the month until the Tuesday after the non-farm payroll number. So that would be a week this coming Tuesday. I would look for the dollar to weaken, but to begin the week, again, we are in the week of the non-farm payroll number. That’s the main event risk this coming week, and it’s a big one.
And then we’re putting on the military strike against Venezuela on top of that, so in potentially thin, illiquid markets. So right now, a corrective move and a real mean reversion theory between these two levels to the upside is very likely.
Then next weekend I’ll reassess what has happened this particular week, reassess the payroll numbers on this coming Friday, and see where we go from there. But for now, the dollar is following its normal cycle, to be strong at the beginning of the month until the Tuesday after the non-farm payroll number.
Gold ($XAU/USD)
Now, with Gold, and again—excuse me there—just one more thing we want to look at here. The core tool that we’ll use at this time of year is the calendar yearly opening price, 2576. That is the level you want to keep your eye on.
Basically, for the next two or three weeks, the market is going to fight to either stay above that yearly opening price, or year-to-date, or it’s going to fight to stay below it. That’s where the bulls and the bears are going to fight this out.
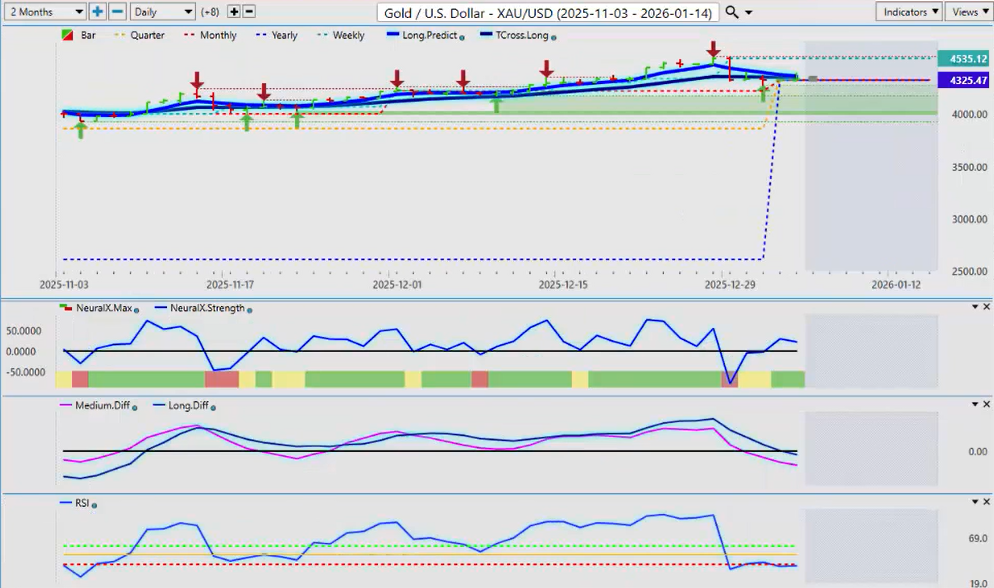
Now, how does this look for Gold? Well, gold normally would be a little softer at the beginning of the month, but with a risk-off scenario like this, it could give gold another boost. So again, we’re going to measure this off the calendar yearly opening price, that level, 4325.47. We need to hold above that level.
Now, what’s interesting about this is I have the TCROSS long at 4353 at the exact same level. The indicators in VP, though, however, are very mixed. Some are bullish in the short term; the medium term are bearish.
So again, we want to make sure we’re combining these indicators. But ultimately, if we can hold above that core level of 4325 and get above our TCROSS long at 4353, then Gold, Copper, Silver, they are likely to extend higher. But in most cases, that wouldn’t be this coming week; it would be the following week.
So again, we’ll monitor things, but for now, a very mixed bag.
Bitcoin
Now, when we look at Bitcoin going into 2026, now I’ve had several conversations about this over the last several months in this particular AI weekly outlook and in the Vantage Point live training room.
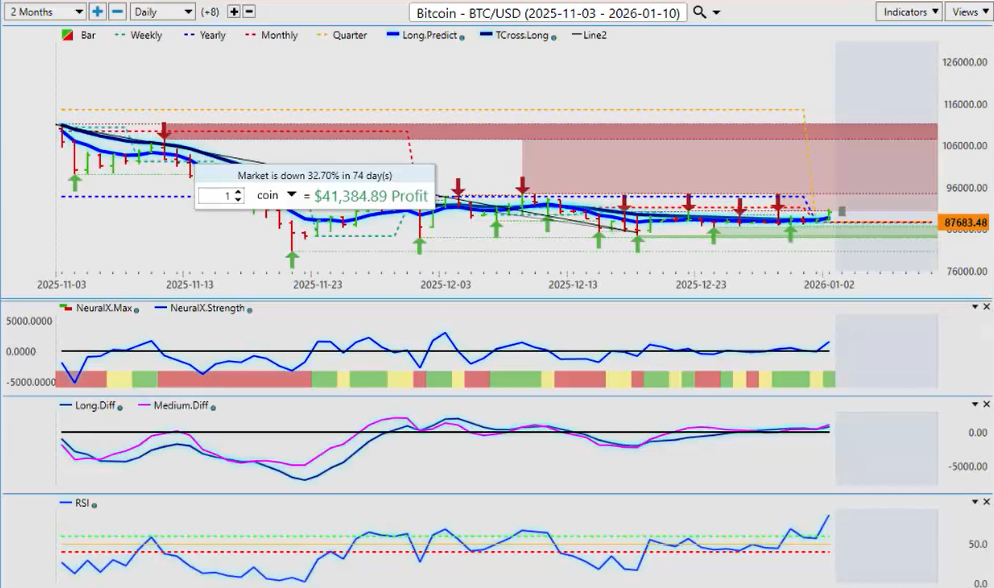
And what I’ve said is, “Mike, what I’m concerned about here is that we finished 2025 negative on Bitcoin, but we had about a 36–38, almost 40% sell-off from October into January 1st.” And this would make me think, is it possible that was the sell-off we were looking for, basically in 2026? Has that already occurred?
So once again, we will leverage the yearly opening price to identify the real trend. If we are holding above 87,683.48, then Bitcoin remains bullish. If we’re moving below that area and staying below this core yearly opening price, then Bitcoin would follow its normal cycle and have continued downward pressure, at least in the first quarter.
So we’ll reassess it as we go along. But for now, the VP indicators are actually pretty bullish on Bitcoin, but we need more liquidity, guys.
So again, it will be an interesting level, interesting week, but we just need to know our levels here. Very important. The TCROSS long, 88,534.
So again, as real liquidity starts coming into the market on Tuesday and Wednesday of next week, then we will be able to see if we can remain positive on the calendar year. And make no mistake, guys, that’s how we identify the trend each calendar year.
In most cases, in the month of January, a trend in all markets will start to form, but it will do so around that very important yearly opening price.
SPDR SPY ETF ($SPY)
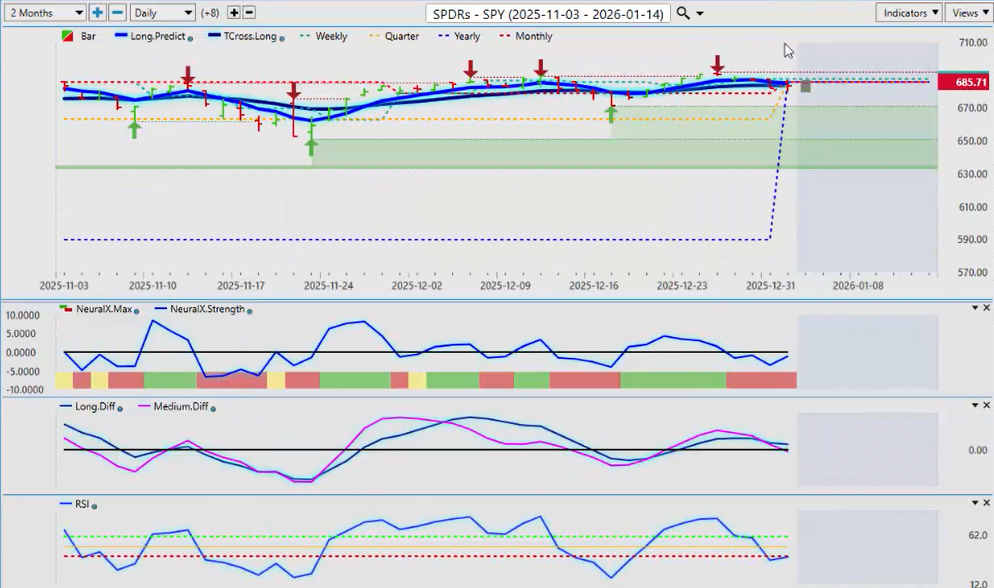
Now, when we look at some of our equity markets here, again, looking at the SPDR S&P 500 ETF (SPY), they’re a little bit below the calendar yearly opening price. That’s coming in at 685.71. We’re closing at 683.17.
But again, I’m not going to put a lot of weight on a single trading day on Friday. We need more volume coming in. We do have an MA diff cross to the downside here, but again, we want to make sure we’re combining all of our tools, not just looking at one crossover or one overbought, oversold reading.
We need to look at everything here, guys, but with a heavy focus on that calendar yearly opening price, which is 589.39.
So if we can get above that and stay above it, then equities will start to make their rise again. But if we can’t, then we start moving lower.
So again, the indicators—we do have a medium-term crossover to the downside. We are below the yearly opening price. So the SPY, the S&P 500, probably going to come under a bit of pressure either way on Monday and Tuesday with what’s going on in Venezuela. But then we’ll reassess once we get into mid-week.
U.S. Oil ($USO)
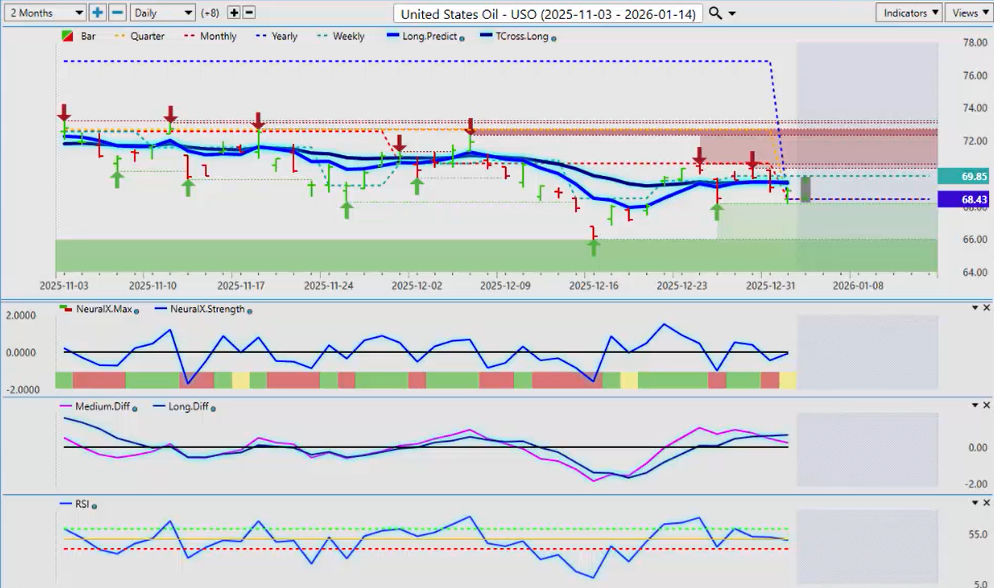
Now, Oil prices. I believe oil was already a buy to begin the year, guys, in the quarterly. If we look at it from a three-month perspective, oil usually doesn’t do too bad, actually, in the first quarter of any calendar year.
So right now, that key level, 68.43, and all we’re looking to do here now is get above the TROS long at 69.48. I believe we will get above that, probably next week.
So that is the key level. My only concern is prior to what’s happened on the weekend, we did have an MA diff cross to the downside. So this could be a corrective move. But again, as long as we’re holding above 68.43, Oil and energy in general look pretty good to get started.
DAX
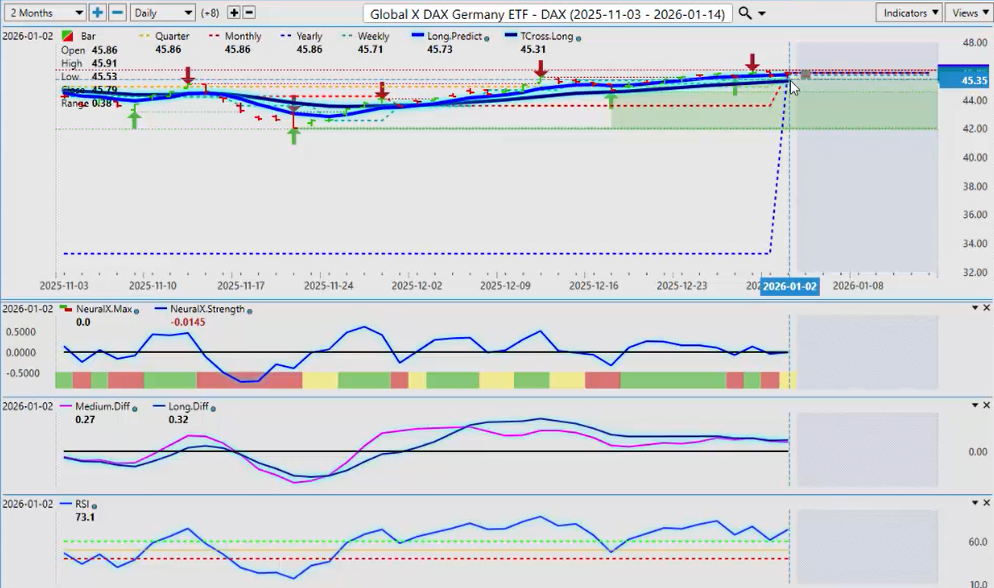
Now, we also want to look at the other side of the pond here in Germany, the DAX. The DAX having one heck of a year in 2025, and the question is, can it build on that?
Well, it will need the help of the U.S. indices. Right now, our T-cross long is 45.31, but that calendar yearly opening price at 45.86—this is the level we need to hold above.
And again, when we look at the DAX back in 2025, it had its ups and downs, but there were far more ups than downs, particularly in this ETF, I believe, closing out the year up around 35–38%.
So again, we want to focus on this very closely. The indicators are somewhat sideways. So again, we’re going to leverage— in most cases, the equities would be a little bit soft next week with that dollar strength and now a bit of a risk-off scenario, which will affect the global equity markets, not just the U.S. stock market.
So again, keep an eye on that particular level, the T-cross long at 45.31. The rest of our indicators still remain moderately bullish.
Volatility Index ($VIX)
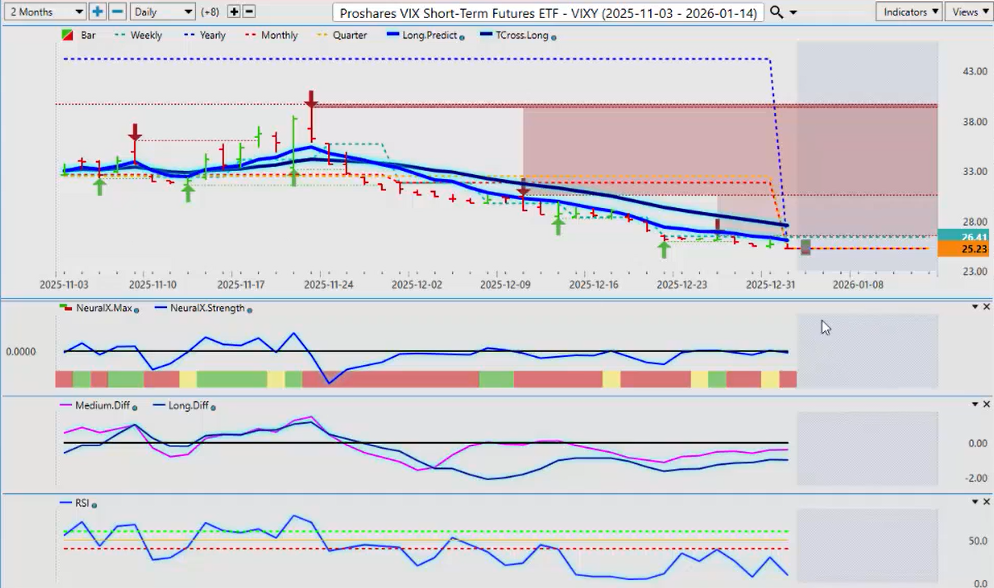
Now, we also want to make sure we’re checking the VIX. The VIX to begin the year—again, that T-cross long at 27.59. The yearly opening price, 25.23, and you can see that we closed just a hair below that.
So, looking at the VP indicators, our predicted differences are still below the zero line. Neural Index is negative. But I believe the VIX can climb for a couple of days next week, maybe the entire week. We’ll see.
But either way, we would have to clear the T-cross long at 27.59 if we’re going to look at actually buying this. That is the key point that I would make.
Russell 2000 Index ($IWN)
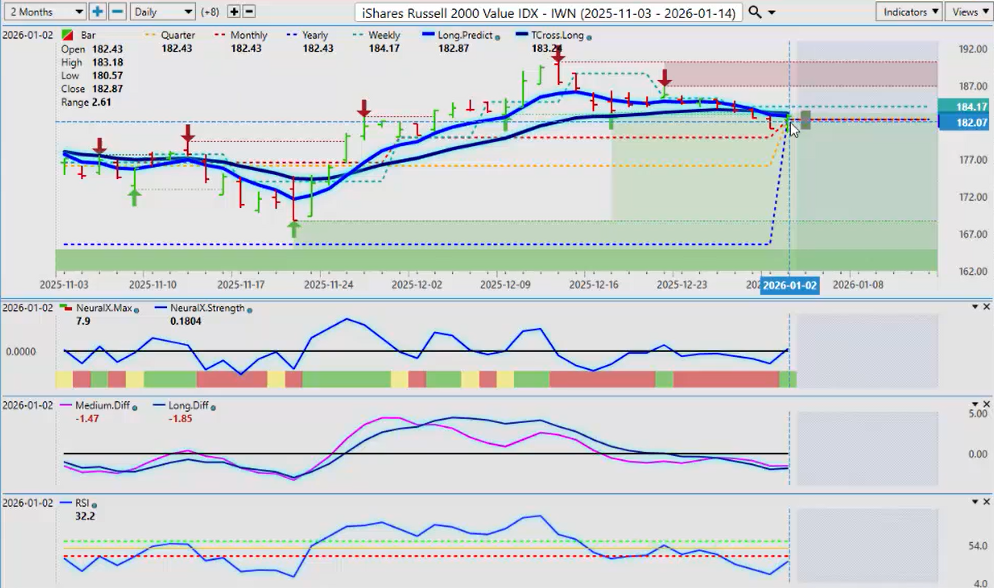
Now, if we have a quick glance here to begin the year at the additional equity markets, the Russell 2000 and the NASDAQ-100 (QQQ). The Russell 2000 is putting up a little bit better of a fight here. We’ve closed out the week at 182.87, and our yearly opening price here is 182.43.
So again, we’ve closed just a hair above that level. The indicators here are pointing up on the Russell, so a slightly different signal there between the QQQs and the SPY.
Power Shares QQQ ($QQQ)
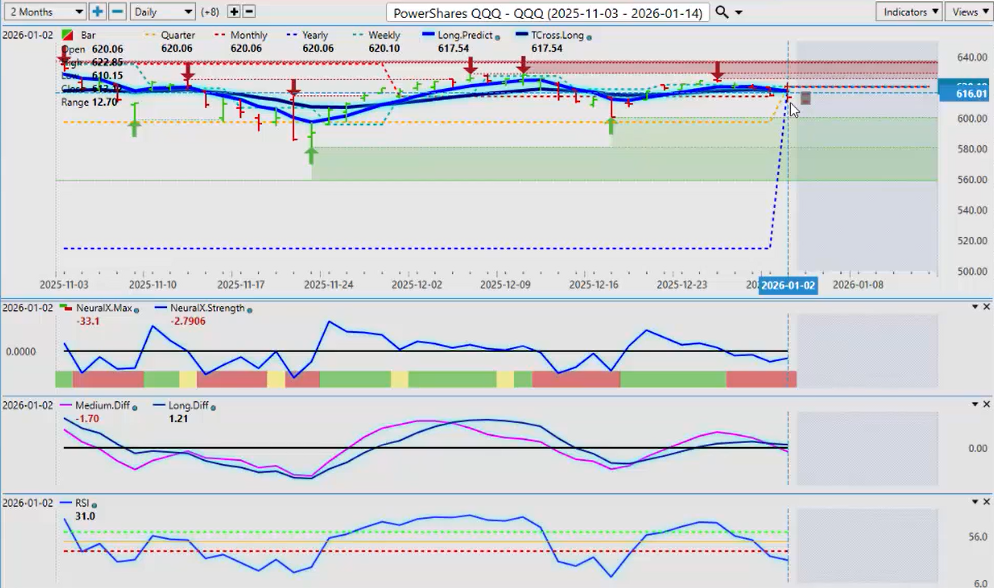
But again, we need to hold above that very, very important 182.43, the calendar yearly opening price. The same thing would be for the QQQs here, guys. But you can see that the NASDAQ is struggling a little bit here.
But I believe that can potentially rebound, and I will be watching Bitcoin very, very closely—that direct intermarket correlation between the QQQs, the NASDAQ, and Bitcoin.
So right now, the level we want to keep our eye on to start the year is 620.6. We need to get above that. But we also need to get above the TROS long at 617.54.
We’re not that far away from that, but again, we do have a medium-term crossover to the downside. But as you can see, the long-term crossover has not completed.
Now, we are building a little bit of momentum to the downside with a break of the 40 level on the predicted RSI. Again, I like to use a 60/40 split here, guys. I’m not interested in overbought, oversold, accumulation, distribution, or things of this nature. I’m looking for momentum, and this is suggesting there is a bit of downward momentum here.
So to begin the week, I believe all of the global indices could come under pressure while we await to see what the U.S. next move is with Venezuela and who else potentially could get involved in this particular conflict.
Euro versus U.S. Dollar ($EUR/USD)
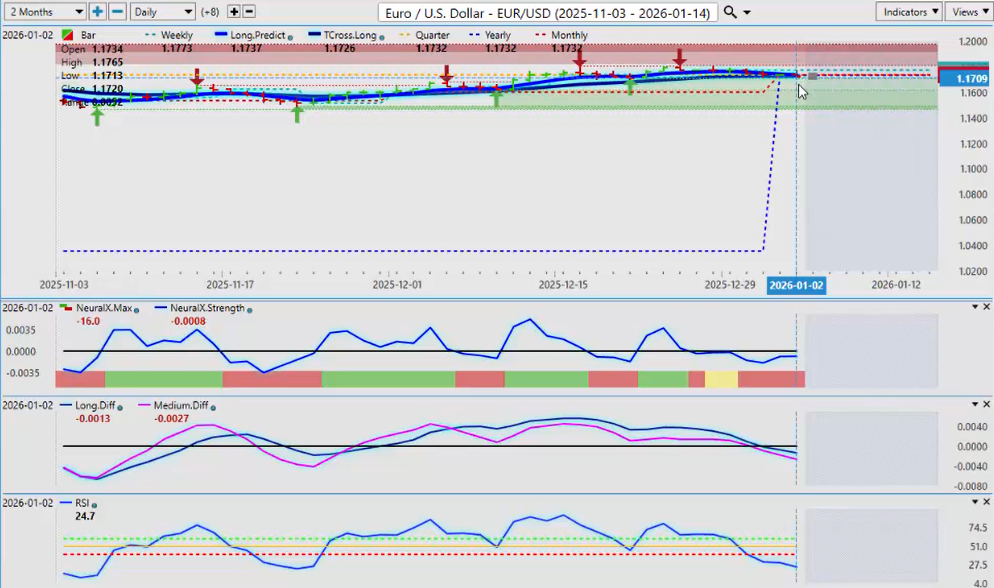
Now, when we look at some of our main forex pairs, all eyes again are going to be on EUR/USD. Can it replicate the performance that it had in 2025?
In my respectful opinion, I believe that will be very difficult in the first quarter. So when I look at it right now, again, we need to understand what determines a trend here.
If it’s positive on the year, the trend is up. If it’s negative on the year, the trend is down. The euro will likely move on either side of the yearly opening price at 1.1732.
But what’s interesting here is the TROS long is also sitting there at 1.1726. So the line in the sand, so to speak, is going to be drawn right around this area.
If you believe the euro is going lower, then you would sell into 1.1732. If you believe the euro is going higher, then you would buy above 1.1732. That’s the simplistic way of looking at this.
And then we layer in the T-cross long and the VP indicators. In this particular scenario, I believe the VP indicators are correct—that the predicted differences, both medium- and long-term, are pointing down. We have momentum building to the downside, and of course we are in a period of known U.S. Dollar strength.
U.S. Dollar versus Swiss Franc ($USD/CHF)
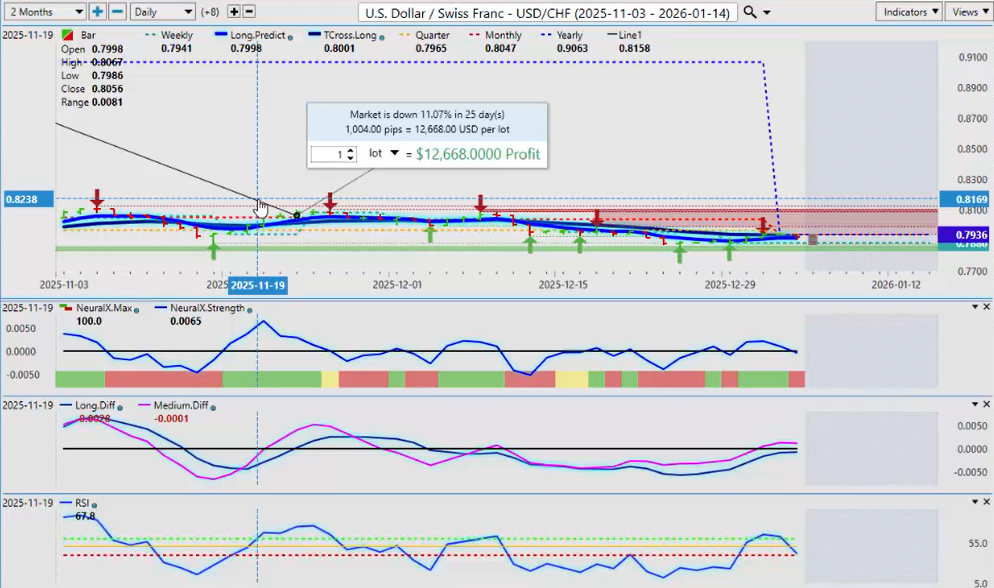
Now, when we look at USD/CHF, in a risk-off scenario you will usually see the Swiss franc strengthen. So it’ll be very interesting to see what happens next week.
These indicators in VP are very mixed. We need more real data coming into the market to analyze this. But if we can get above the yearly opening price at 0.7936, then we go higher.
But I think that will be very difficult under the current conditions. In a risk-off scenario, you have three currencies that usually strengthen: the U.S. Dollar, the Swiss Franc, and the Japanese Yen.
So it’s a very mixed bag here, and I would respectfully submit that you may want to hold off a day or two—Tuesday or Wednesday—before taking any positions.
But again, know your levels. Clearing the yearly opening price right here, guys—everything is sitting at the same level. 0.7936 on the yearly opening, 0.7933 on the TCROSS long.
The more savvy trader could put a buy stop right above 0.7933, say 0.7940. It breaks above that, triggers the long, and then away we go.
Or if you’re on the short side of this, you can actually sell into 0.7933. I believe that would be a reasonable play. So again, it’s all in how we look at it.
British Pound versus U.S. Dollar ($GBP/USD)
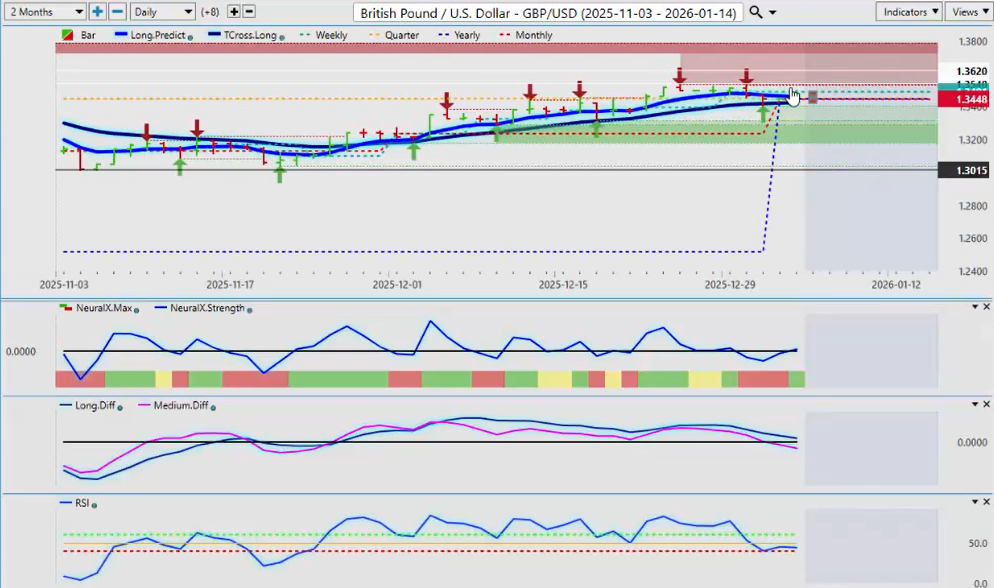
The GBP/USD will succumb to a risk-off scenario, and that could see it moving lower on dollar strength. Again, we’re in a period of known U.S. Dollar strength.
So the TROS long here is coming in at 1.3424. Our yearly opening price, 1.3448. That is our resistance. We closed just a hair above it at 1.3459.
But I would be very surprised if the British Pound can move higher, at least to begin the week, in a risk-off scenario.
U.S. Dollar versus Japanese Yen ($USD/JPY)
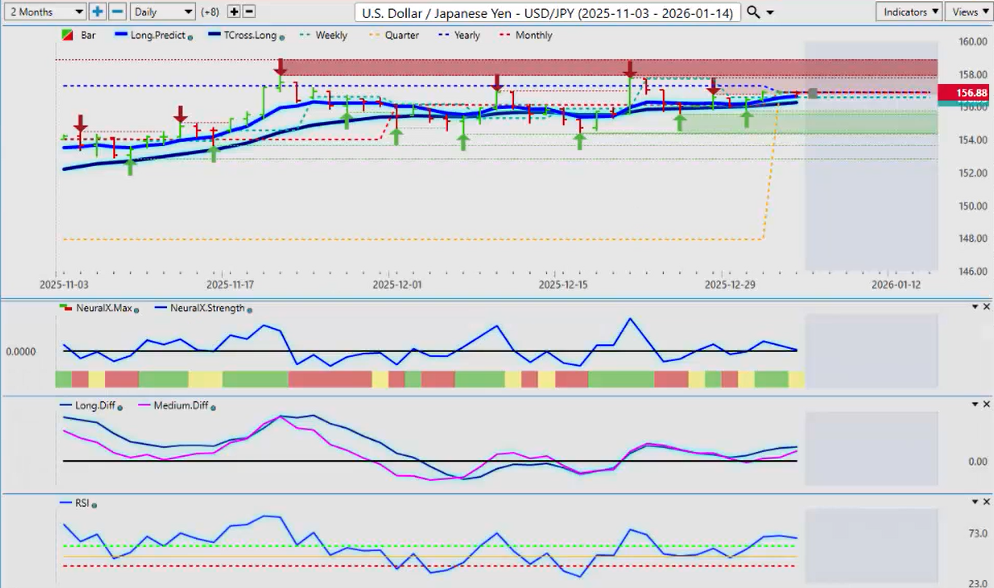
Once again, we want to keep a very close eye on USD/JPY. Our yearly opening price—this is again happening—is 156.88.
So basically, guys, to sum it up in a simplified manner: if we can’t hold above the yearly opening price at 156.88, then we’re going lower.
If it’s above it, we’re positive on the year. If it’s below it, we’re negative on the year. That’s your trend.
For now, we are above our TCROSS long at 156.26 and 156.88. That’s your line in the sand here.
Now, for our main equity-commodity-based currencies—the AUD/USD, USD/CAD, NZD/USD—very similar trades on all of them.
U.S. Dollar versus Canadian Dollar ($USD/CAD)
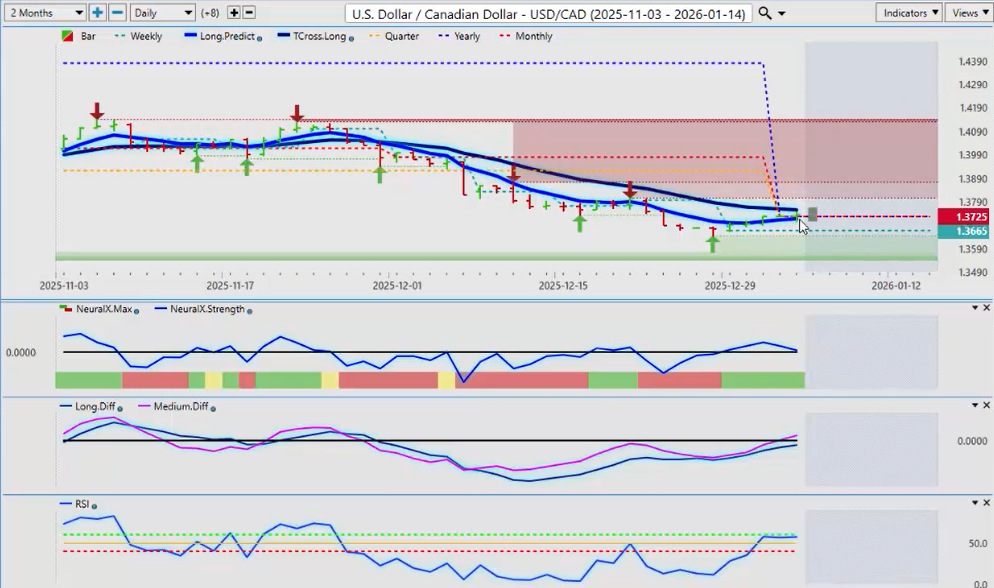
Right now, USD/CAD is trying again. We’ve had a corrective move back up to our TROS long. This is a make-or-break area for this particular pair.
We’ve got our T-cross long at 1.3756, but the yearly opening price here is 1.3725. That is your major support in the month of January, but more specifically in the next week or two.
So keep a close eye on that level right now. We also have the T-cross long sitting at 1.3756—very strong support here.
If you’re a buyer, these are the areas you’re going to focus on. If you’re a seller, then you would sell directly into the T-cross long at 1.3756. But I believe that to be a high-risk trade just yet.
As we move toward February and March, the Canadian Dollar will strengthen with Oil. But if we get a big shot up in oil prices to begin the week, that could give the Canadian dollar a boost.
Australian Dollar versus U.S. Dollar ($AUD/USD)
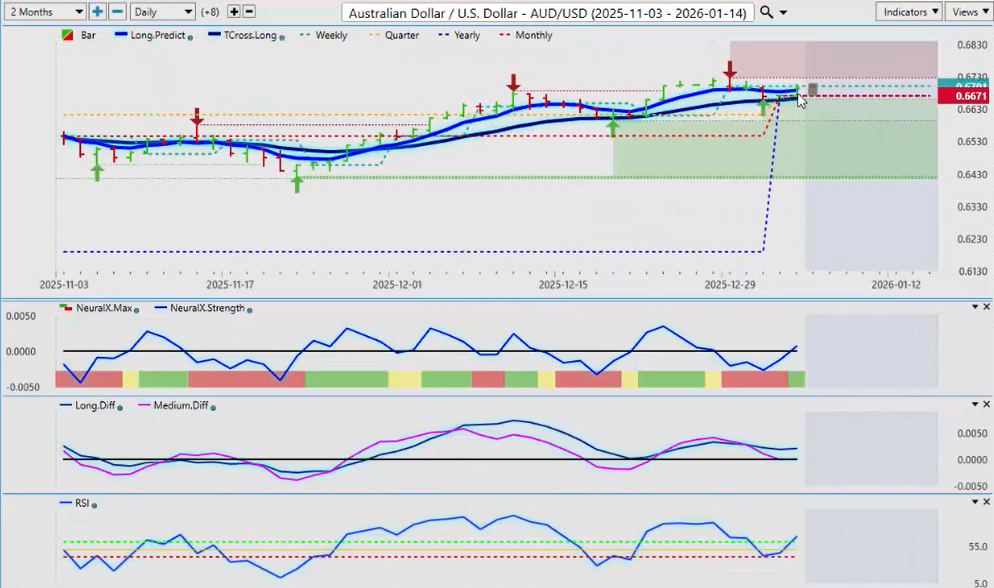
Now, if we look at the AUD/USD, the yearly opening price is 0.6671. That’s the key level. The TROS long is sitting at the exact same level.
If the equity markets tank and we go into a risk-off scenario, the Aussie falls temporarily. I believe we shouldn’t be buying this pair until the week after next.
New Zealand Dollar versus U.S. Dollar ($NZD/USD)
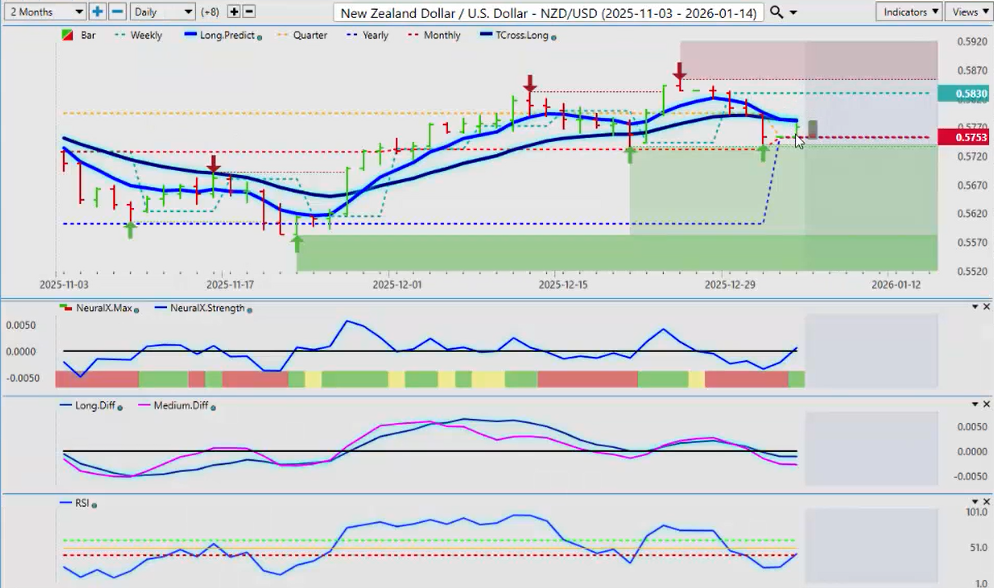
The same thing applies to the NZD/USD. The yearly opening price is 0.5753. We’re closing above that level. The quarterly opening, monthly opening, and yearly opening price are the same number until the end of January.
So again, we have a lot going on next week, but with that will always come opportunity in the markets.
So with that said, this is the Vantage Point AI Market Outlook for the week of January the 5th, 2026.


