


Welcome to the Artificial Intelligence Outlook for Forex trading.
VIDEO TRANSCRIPT
Hello everyone, welcome back. My name is Greg Firman, and this is the Vantage Point AI Market Outlook for the week of January 22nd, 2024. Now, to get started this week, we’ll begin where we usually do with the US Dollar Index.
U.S. Dollar Index
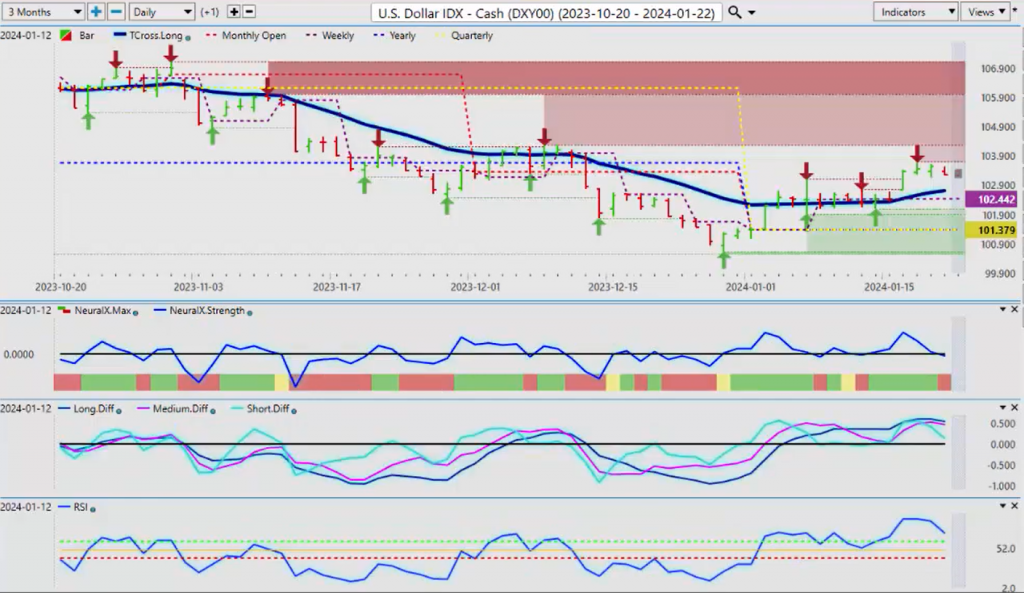
Now, the dollar Index is getting a boost from some of these fed comments. The economic data not overly supportive, but the good news is the Fed is going into blackout this coming week, so there’ll be no more of this, uh, the fed and the FED members in the committee continue to contradict themselves on whether they’re holding, cutting, whatever they’re doing with these rates. But again, we are going into that blackout, so we should see mainly range trading for the week.
Now, our key Vantage Point T cross long on the dollar Index is coming in at 10270. I do anticipate a retracement of these levels to this level based around the Vantage Point indicators. Our predicted neural index, neural index strength, our predicted differences are again they rejected the zero line on the ma diff cross, but I believe they will circle back.
S&P 500 Index
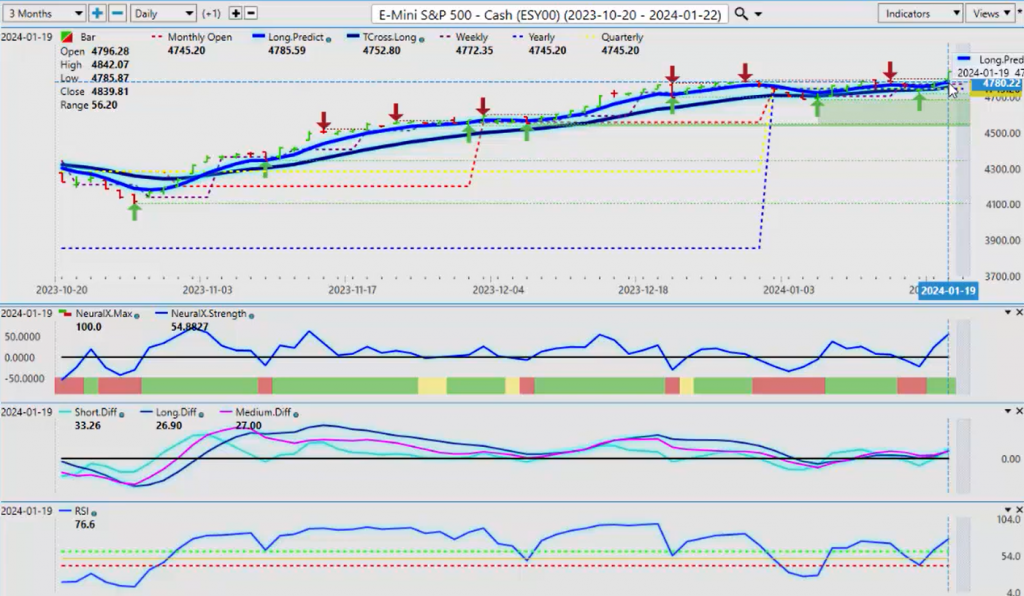
The predicted RSI is starting to fall lower, but what’s very interesting this past week is that the equity markets are the ones that are really pushing higher with the some of the news coming out of the tech sector has obviously helped that, but all-time highs on the S&P 500 yet again. So we are recovering; we’re holding above the yearly opening price on the S&P 500 because what’s very odd with this particular trade setup is that inverse correlation about 195%. The dollar Index and the S&P 500 are inversely correlated, meaning one up, one down. They very, very seldomly go up and down together. So for the start of next week, the indicators do support additional longs on the equity markets and shorts on the dollar based on that in strong intermarket correlation if nothing else.
Now, the key levels that we want to watch is that quarterly and yearly opening price at 4745, our Tross long 4752. So all of our support is sitting down at this level. If we look for a retracement point, that is the level we would watch, but the indicators are supporting additional longs.
Gold
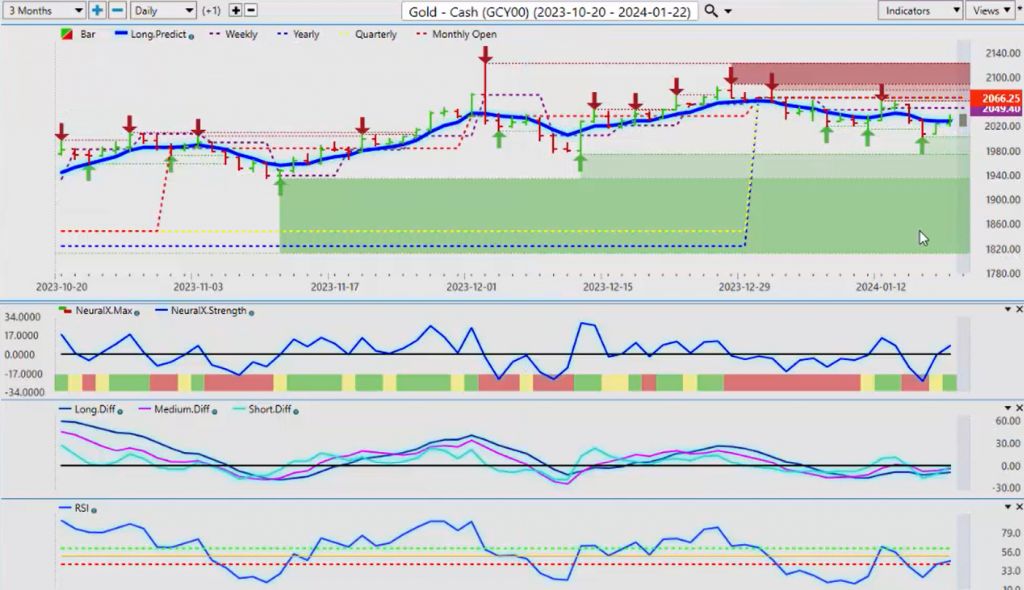
Now with gold contracts, I guess I must have slipped a little bit last week. I’ve got a bit of the covid-brain still going here, uh, but the gold contracts also are inversely correlated to the dollar Index, so meaning Dollar’s going down, if the dollar goes down this coming week, then gold would start to rise higher. I’ve noticed a number of global central banks increasing not decreasing their gold purchases, so that favors gold holdings in gold versus the US dollar. US still, I think the highest reserve holder at about 69% I think of the world. I believe it’s around 69% of the global gold reserves are still in the US. So interesting correlation or inverse correlation, either way, the indicators from Vantage Point are starting to turn positive on gold, but we’ve got to get these predicted differences moving up. The predicted RSI above 50 and ultimately above 60 is what we’re looking for, but we need that dollar strength. I don’t think the market is going to commit to that until we hear what the FED is, the fed’s next plan is on January 30th or the 31st at the next meeting, but with that fed blackout, it should indirectly help gold.
Crude Oil
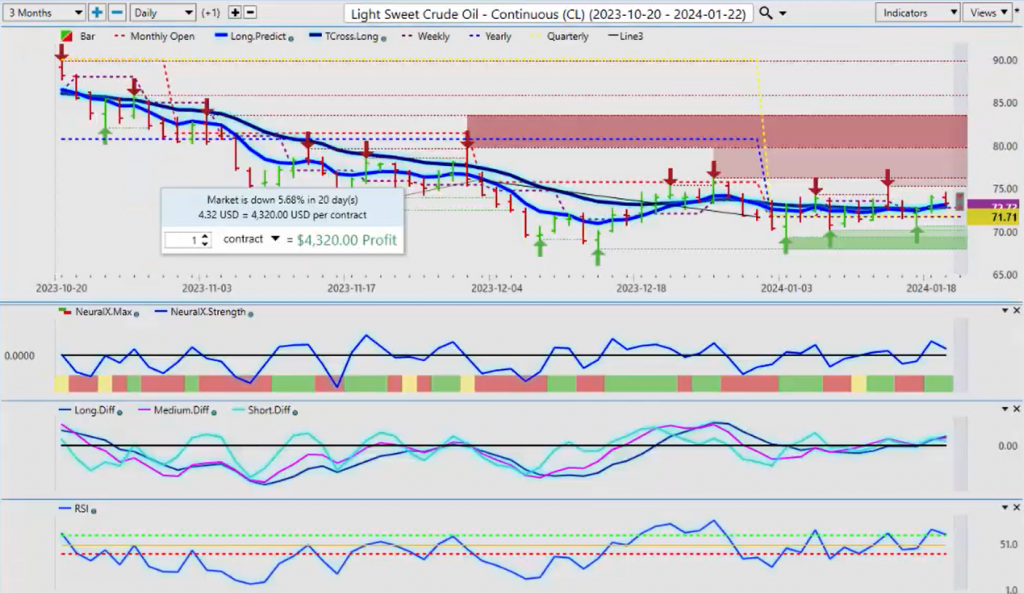
Now with oil prices, as I was talking over the previous week, in most cases, especially in the energy sector in the fourth quarter of 2023, very, very high positive correlation between the dollar and light sweet crude oil, so if the dollar moves lower next week, oil is likely to follow. However, either way, we’re looking for that seasonal pattern in dollar strength starting around the beginning of February, and it usually lasts into mid-March. The dollar doesn’t just go straight up or down; we still have our intraday trading, but the main thing right now we look at is that there are signs of weakness. So the neural index strength indicator, you can see that it’s pointing down. If we can break down below the Vantage Point T cross long at 7283 or more specifically, the long predicted at 7308, that’s where all of our support is, so I would suspect, if nothing else, a retracement down to the yearly opening price just under that 72 level and then be very, very cautious around that area. But watch the dollar Index very closely. If it’s aggressively moving lower, which I don’t think it will be next week, it will likely move lower, but not a big move down, not until we see what this fed is going to do. But if it does, keep an eye. There could be some good shorts, not just on the dollar, but also on our oil contracts. But that is the level 7283. Then we’ve got our yearly opening price down to 7171. A break of that would also mean that we’ve got a pretty significant dollar selloff here if we connect the dots.
Bitcoin
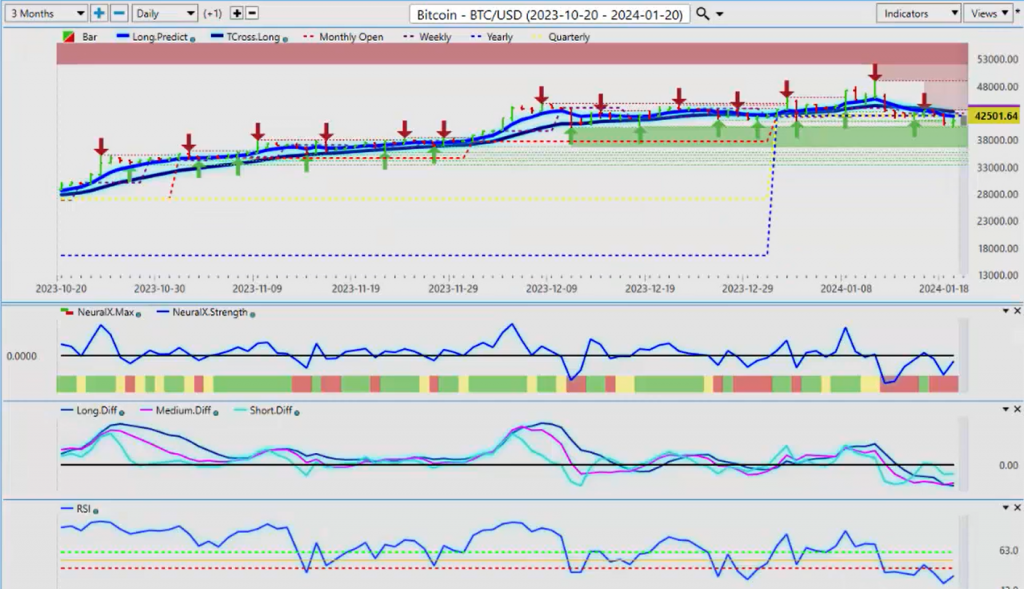
To the two Bitcoin contracts, under a little bit of pressure this week, like all other markets other than the US dollar. If the dollar rises, everything else goes lower. There should be nothing to mince in those words that I just said: dollar up, pretty much everything else down. That’s what we’ve seen a very strong pattern of in 2023. Whether we get the same in 2024 is left to be seen, but for now, Bitcoin finding some support along these verified support lows, these verified zones 40,235. We’re going to look for that area to hold. If it holds, then Bitcoin will remain in its uptrend, but we also have that very important yearly opening price at 42,501. I want to see us stay above this. I do think that Bitcoin will have another great year again. Like I’ve said before on these webinars is when Bitcoin is down 50% or more in one calendar year, the cycle pattern is to rally in the next three years with a minimum of 50 to 100% rally each year. Last year, we were up 100, I think 155% on Bitcoin, so if past patterns remain the same, we would be that strong again this year. So we’ll keep an eye on this. Right now, we can see a very slow Buy Signal forming on our Ma diff cross down here. Predicted RSI is starting to recover, and I like the angle of that neural index strength because we can see the neural index is still red, but the neural index strength is pointing up, and that’s exactly what we’re looking for. We then connect the dots to the verified support low, and we would like to see that level hold and then get back up above the yearly opening price.
Now, as we look at some of our main Forex pairs, most of them recovering on Friday because, again, a lot of chatter from these different fed members, each one of them saying something different.
Euro versus U.S. Dollar
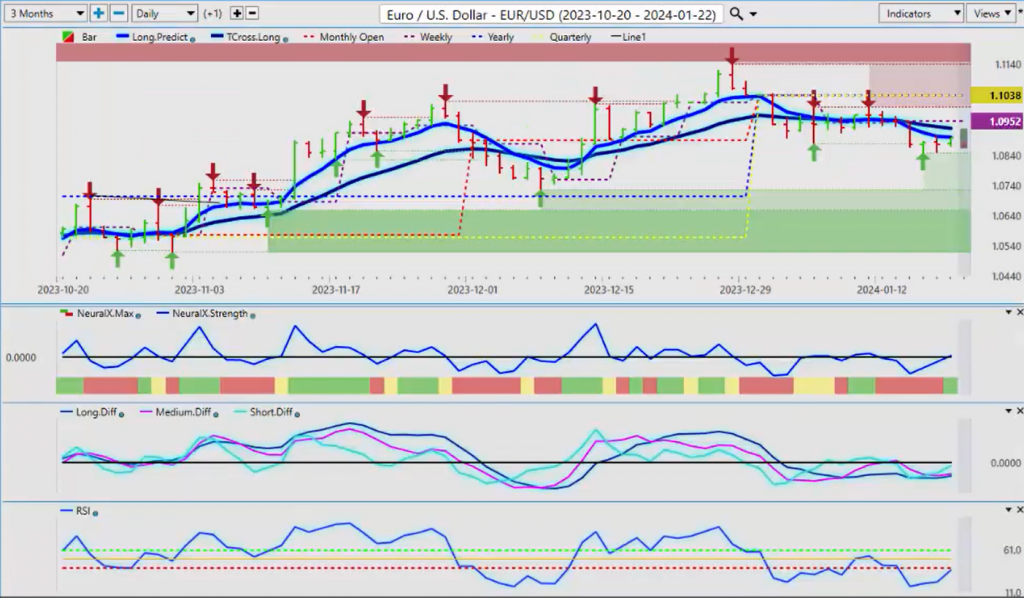
It’s sending the dollar up, it’s sending the dollar down, but again, the FED blackout here is a really good thing next week because at least we don’t have to deal with that. So right now, I would anticipate a recovery in Euro US, but it needs to get moving. We’re falling below that yearly opening price 11038. We do need to retake that guys. That’s a very objective way of looking at what a trend actually is. Below the yearly opening price, it’s technically bearish; above it’s bullish. But in most cases, a trending move doesn’t start toward until midway through the first quarter. So we’ll continue to monitor it, but for now, we again have another Buy Signal on Euro US, the neural index, the neural index strength, the predicted differences of Flatline, and they’re starting to move up. Our predicted RSI is recovering, so we’ll watch this, but we must get above 10899, 10928.
That’s where your resistance is for next week. If we can get above that area and stay above it, then we should be able to target the 11038. But if we can’t reach 10928, then the Euro will remain under selling pressure.
U.S. Dollar versus Swiss Franc
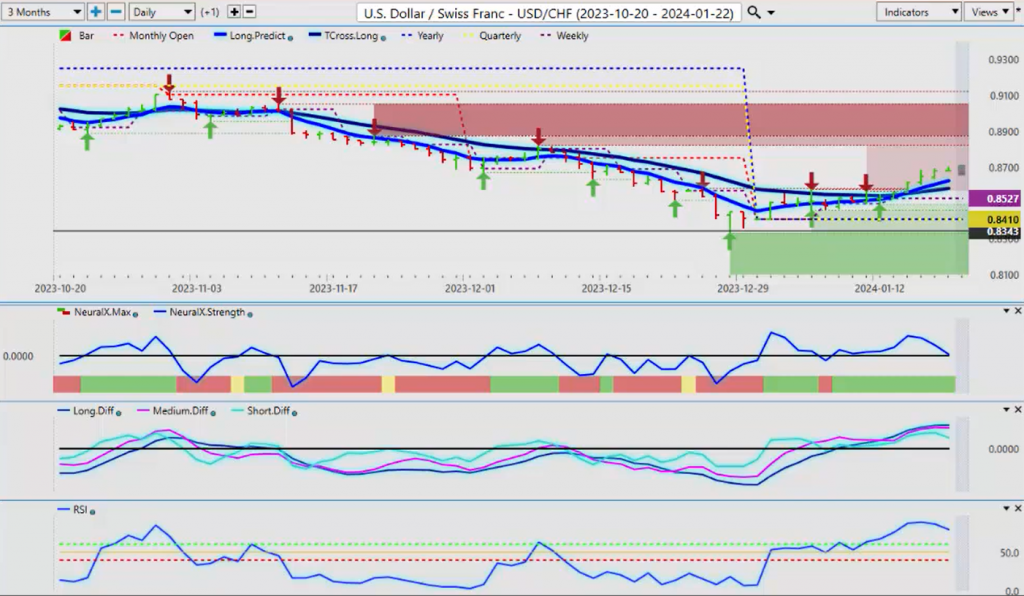
Now, US Swiss Franc has really got a push this week to the upside. I think it surprised a lot of us, actually because predominantly again, the Swiss Franc has done very well against the US dollar despite the fact that it’s still a carry trade. The interest rate differential between the Swiss National Bank and the FOMC still favors the US, but that hasn’t phased this pair over the last few years, last multiple years, actually. So right now, we don’t have a lot of resistance up here. Our next verified resistance high comes in at 8821. I think it will be difficult for it to get to that level, I think. So the indicators right now are starting to roll back down, and that’s what we’re looking for.
Now, in most cases with that US dollar cycle, the dollar is strong in the first week of the new month, up until the week after the nonfarm payroll number. If we look at that scenario, in most cases, the dollar does sell off the week before the end of the month, and I believe it to be Central Bank rebalancing to some degree or they’re just setting the market up, getting them long the dollar, and then they pull the rug right out from underneath or getting them short the dollar, I should say, and then pull the rug right out from underneath them the following week. So the scenario I would look for is a softer dollar this coming week leading up to the non-farm payroll number, and then the dollar goes higher either way in the first week of February. So we could see a limited rise here. The indicators are warning that it’s losing what this one week of momentum. It is starting to lose that.
British Pound versus U.S. Dollar
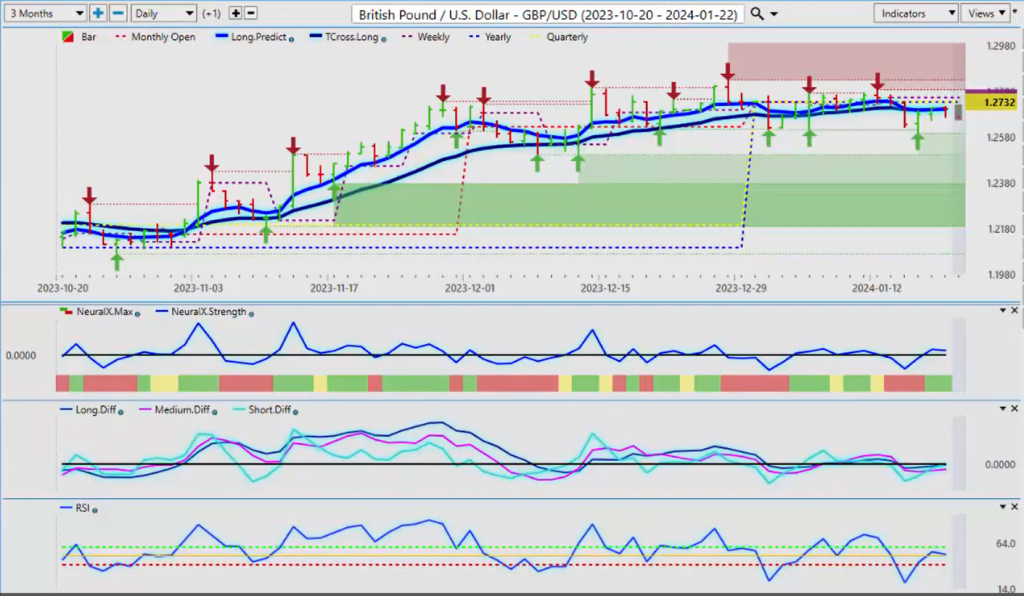
Now, when we look at the pound dollar, the pound dollar was a very interesting one this past week because the Great Britain cross pairs did extremely well. Great Britain Japan, Great Britain Australia, Great Britain New Zealand, the list of them. Euro Great Britain fell lower, which again was Great Britain strength, but Great Britain US struggled. So we’ve retraced some of the losses from the beginning of the week, and we’re around the break-even point, closing around 12702. So again, we need to get moving on this. The indicators are basically sideways here. But the inflation data is still in my view; there is more inflation in the US in Great Britain than the US or Canada personally, but that could be debated based on the data. How is the data accurate? Well, that’s highly questionable, certainly out of the US, that data. Economic data, you’ve got the CPI that’s hot, then the PPI is not, and then the retail sales are hot, then the next one’s not. So it’s a very mixed bag. But the payroll number will solidify that to some degree.
But for now, we do need to get above this yearly opening price at 12732. But I do anticipate range trading next week and the following week with the FED. I don’t think the major players are going to line up until they have some idea what this incredibly confused fed is going to do next. So for now, we know where our T cross long 127 is our line in the sand. And if we can hold above 127, longs are good. But if we can’t, then we’re likely going to come back down and retrace this newly formed verified support low at 12597.
U.S. Dollar versus Japanese Yen

Now, as we look at the dollar yen, the carry trade, all I can do, guys, is warn you. The Bank of Japan is monitoring the FX move. They have told the market they’re monitoring it because again right out of the gate, the carry trade kicks back in again, and we’ve got the dollar yen back up at the 148 level. So this is not going to be making the Bank of Japan very happy. So my only warning I can give you is yes, everything looks bullish, but at any time intervention from the Bank of Japan could happen and could crush this thing lower. The earthquake situation seems to have settled down, so the repatriation there is should be okay there. But my concern that I would convey to you would be careful of this Bank of Japan. They are really watching this, and personally, you know, 25-30 years in the currency markets, I don’t remember ever trading the Yen at these levels. So the Bank of Japan again, they kind of did it to themselves. These Central Bankers often shoot themselves in the foot, but be careful with this one.
So if we get a little softer dollar next week, we could see a retracement back to the TR cross long in the 14561 area. Our long predicted is coming in at 14728. That’s the level you want to watch. If we can hold above that, then we’re not going to get to the TR cross long. But again, longs, while they’re working this year, they’re very, very high risk.
U.S. Dollar versus Canadian Dollar
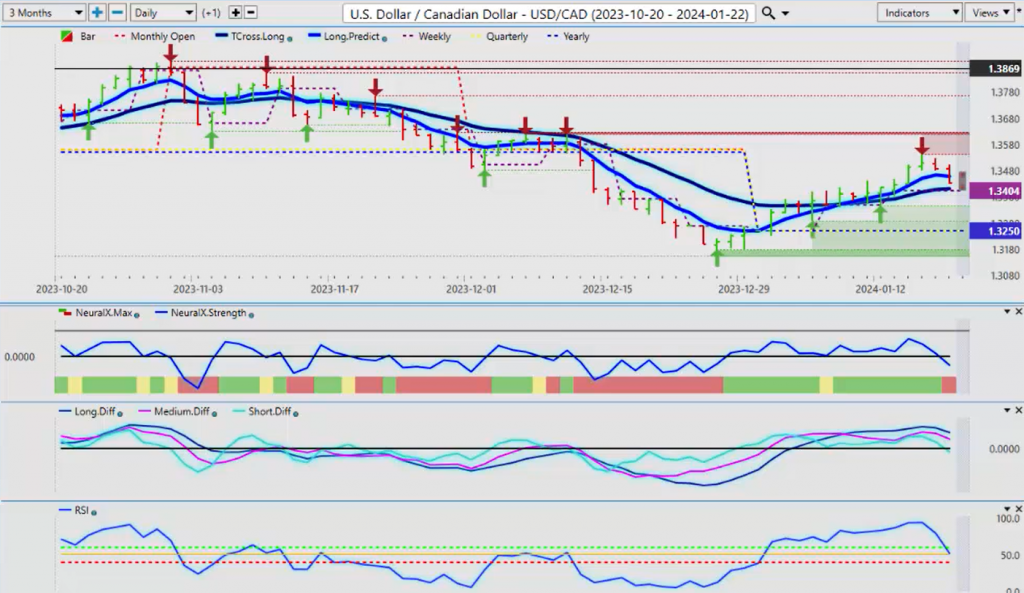
Now, I believe next week we’re going to see all eyes on the US Canada with the Bank of Canada. I am domiciled in Canada. I believe the Bank of Canada is going to paint a much more gloomy picture for the economy. The Canadian economy is not doing well. It hasn’t been doing well for some time. GDP numbers have been down for months in a row, no growth. So there’s no reason for them not to be talking about rate cuts. I believe that that will be very negative for the Canadian dollar. So right now, we have our T cross long that level for next week is coming in at 13412. And again, I would like to see us hold above this particular level, but the yearly opening price, which is very important, is 13250. It would take, um, basically the Bank of Canada saying that they’re going to hike again to get it down here. I don’t believe the Canadian dollar can just ride the way the wave of oil prices. And if the intermarket positive correlation between the dollar and oil contracts remains steadfast, then that’s another negative for the Canadian dollar. So possible falling oil prices and potential cuts coming from the Bank of Canada, both big negatives for the Canadian dollar.
So that’s the fundamental guys. Then we intersect that with the technical levels, and that long T cross long 13412, watch that area very, very closely.
Australian Dollar versus U.S. Dollar
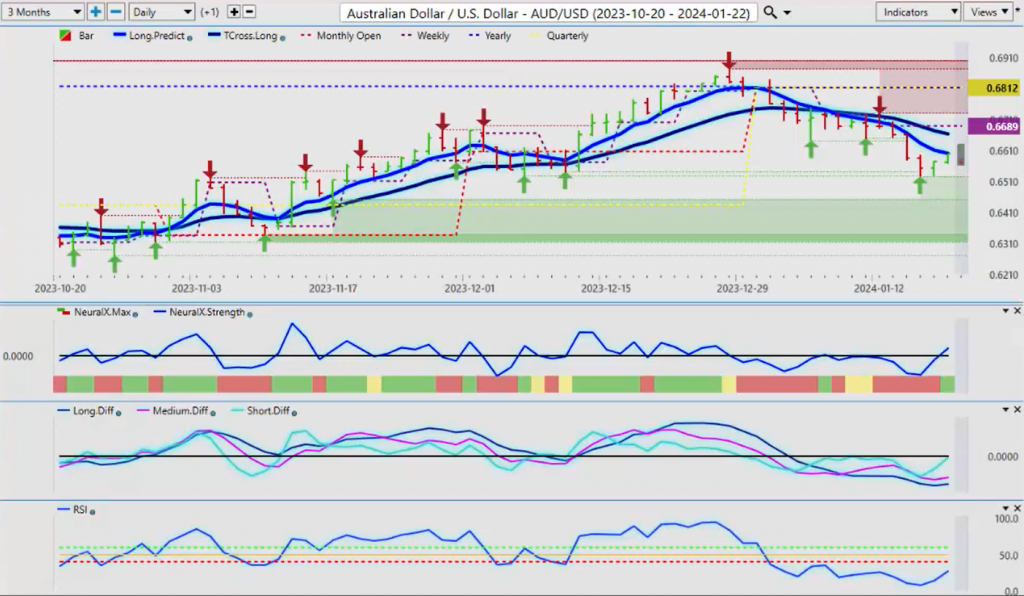
Now, as again, as I’ve said before, I can do Aussie US in New Zealand US, but it is the same trade here, guys. And I believe it’s being driven down here by what’s happening over on this particular pair. Australia New Zealand is made up of Aussie US and New Zealand US. So if this is going higher, then chances are, as I talked about last week, Aussie US. So I bought Aussie US this past week based on these Vantage Point indicators, and then it’s moving along. So we’ve retaken the yearly opening price 10781.
New Zealand Dollar versus U.S. Dollar
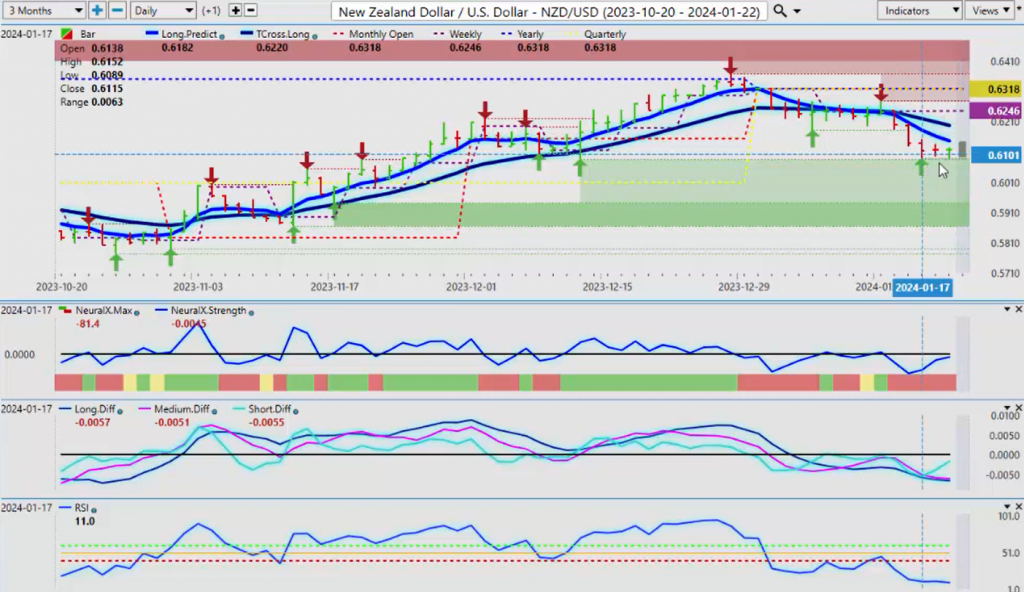
So potentially, guys, there’s a very good-looking long trade coming here. We just need to hold above that very important quarterly and yearly opening, and that’s coming in again 10781. So I believe that this particular cross pair is directly driving these two. So you can see that the Aussie is still struggling. Their predicted difference in that, but it is gaining support from the cross pair. So with that said, this is the Vantage Point AI Market Outlook for the week of January the 22nd, 2024.


