


Welcome to the Artificial Intelligence Outlook for Forex trading.
VIDEO TRANSCRIPT
VANTAGEPOINT AI MARKET OUTLOOK
VantagePoint A.I. Market Outlook for January 26, 2026
Okay, hello everyone, and welcome back.
My name is Greg Firman, and this is the Vantage Point AI Market Outlook for the week of January the 26th, 2026.
U.S. Dollar Bullish Fund ($USDU)
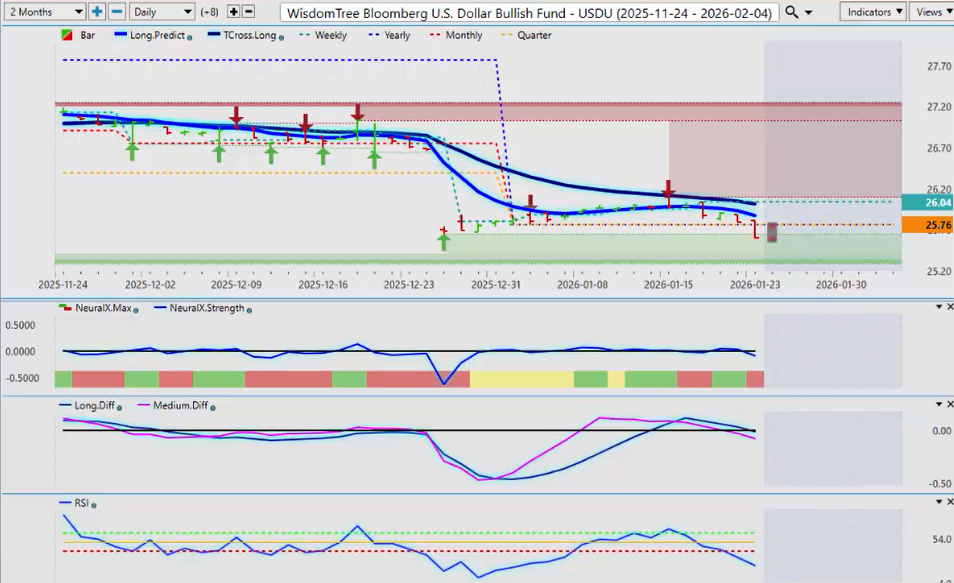
Now, to get started this week, we’ll begin where we always do, the U.S. dollar, uh, the U.S. Dollar Index. Now, in last week’s presentation, I made it very clear, uh, that the dollar is not a go. Uh, the dollar struggles mid-month. And in this particular, uh, cycle down, there was two anomalies that I looked at last week using the VP software. I’ve made the argument that the Dollar Index Fund is becoming antiquated, and it’s producing different signals than the USDU.
So, once again, the UUP or the DXY futures contract was not accurate showing any kind of dollar strength. Whereas the WisdomTree Bloomberg U.S. Dollar Index tracks real need for dollars, buying and selling of them. And you can see we came up to the T cross long. We’ve hit that, failed, and again that failure with the MA diff cross and being at mid-month, that pointed towards a very significant, uh, move lower in the U.S. dollar was coming.
Now again, in most cases, the dollar does see buying at the beginning of the new month. So we probably have a little bit more dollar weakness, but we’ve got to be careful. But again, this is following a repetitive cycle, cycle-based on seasonalities, both yearly and monthly, in the month of January, how the dollar does.
But the importance of looking at this particular ETF, and again I’ve talked about this with the Global DAX, the Global X ETF, surprisingly, it was giving more accurate signals than the actual futures contract. Taking that from the ETF side and then applying it to futures, much like what we’ve done here with the Dollar Index, we can see how it’s very, very accurate.
So right now, I don’t have any signs of any real pending dollar strength, but I would not ignore the required dollar buying which usually occurs, or at the very end of the month into the first week of the new month.
GOLD versus U.S. Dollar ($XAU/USD)
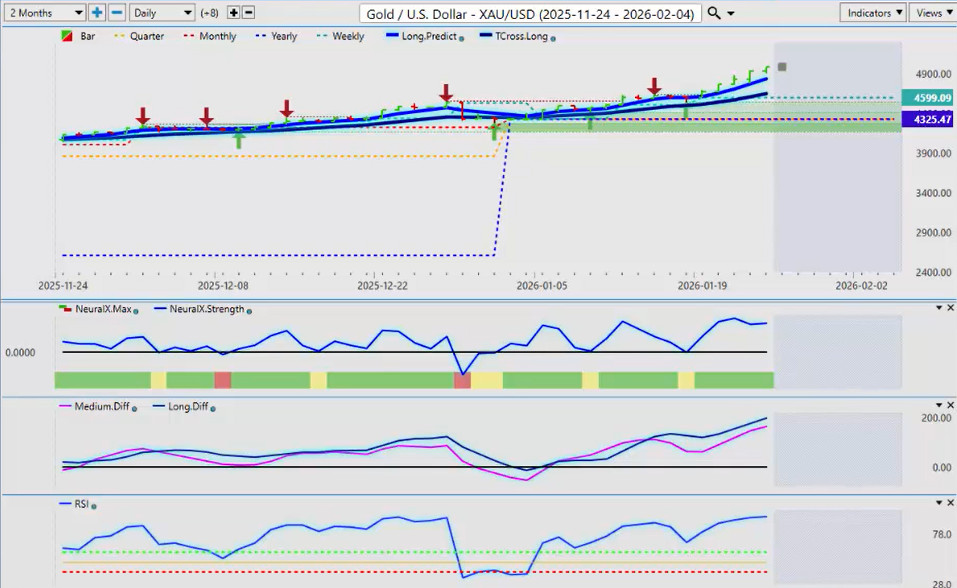
Now, uh, again, a lot of headlines this week, uh, but again we’ve had nothing but headlines, guys, over the last 10 years, 7 years, 9 years, 5 years, and that’s how we track this data. So, gold continues to advance on the dollar weakness. But again, uh, I think a big psychological level. I can’t believe after 20 years, 25 years, I’ve been hearing this. We’re here, guys, Gold 5000.
Uh, so you can see we closed just a hair, uh, under that. But, uh, when we do that comparative analysis with the Dollar Index, we want to make sure we’re looking at that yearly opening price, 2576. So we’ve closed, uh, at 2560, a hair under that, right? Uh, so it’s not a super, even though the dollar has taken an absolute beating in the last week, a week and a half, uh, still can’t be ruled out.
So you could have, not saying you will, just in my respectful opinion only, that 5,000 mark is a psychological level for a lot of traders. So we could see some profit taking up here. And just keep in mind the normal cycle of the U.S. dollar that occurs about 10 of the 12 months per year. Strong at the beginning of the month, weak in the mid part of the month. It just keeps repeating itself.
And those past price patterns are impairment to our success that we’re paying attention to them. Uh, because again, it’s not something that lags, it’s something that reoccurs.
So with gold, it would normally come under a little bit of selling pressure at the end of the month. So, and with that $5,000 barrier, uh, or long-term target, again, unless we get a new wave of buying coming in, which is entirely possible, we could see a little bit of a pullback.
So the, uh, long predicted and the T cross long, T cross long, 4654, 4837, those are your two retracement points, your mean reversion points for retracement. That’s where you would consider entering, re-entering longs.
S&P 500 INDEX ANALYSIS
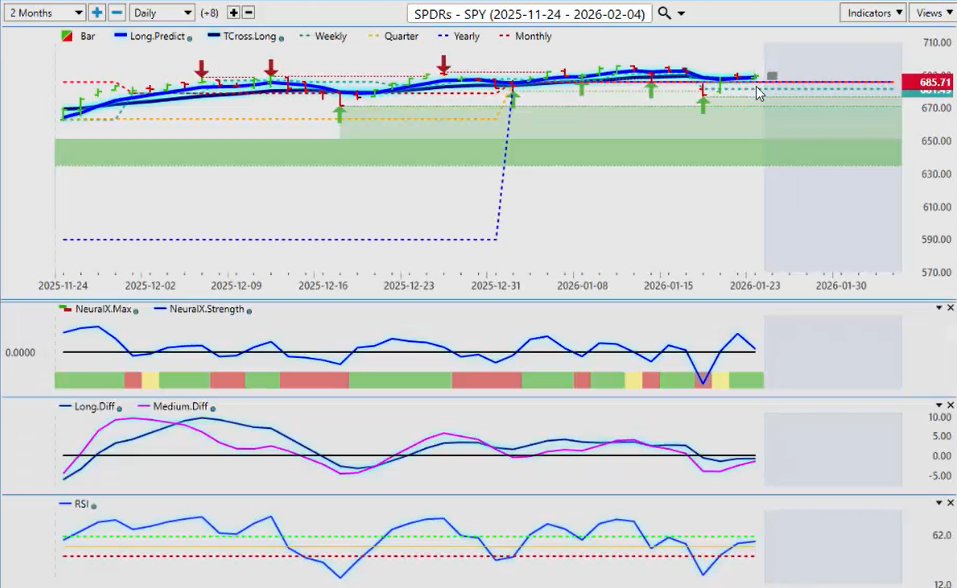
The S&P 500 Index going into next week, they’re hanging in there, uh, despite the strength in gold. Uh, so again, the yearly opening price here, 68,571. Uh, we’re closing out the week at 689. So we’re still on the bull side of this, uh, of this particular market.
The indicators in VP, they’re actually starting to show a little bit of upside momentum coming here. The only one that concerns me, you can see much like what I’ve shown you with the Dollar Index versus the USDU, the DAX versus the Global X, uh, I take the same analogy with the neural index and the neural index strength.
Now, this is actually pointing down, uh, but the neural index is green. So I’m watching the zero line very closely on this one next week to make sure I’m staying above that. Uh, but as long as we can remain above that yearly opening price, we should be okay to remain long on the equities.
Bitcoin
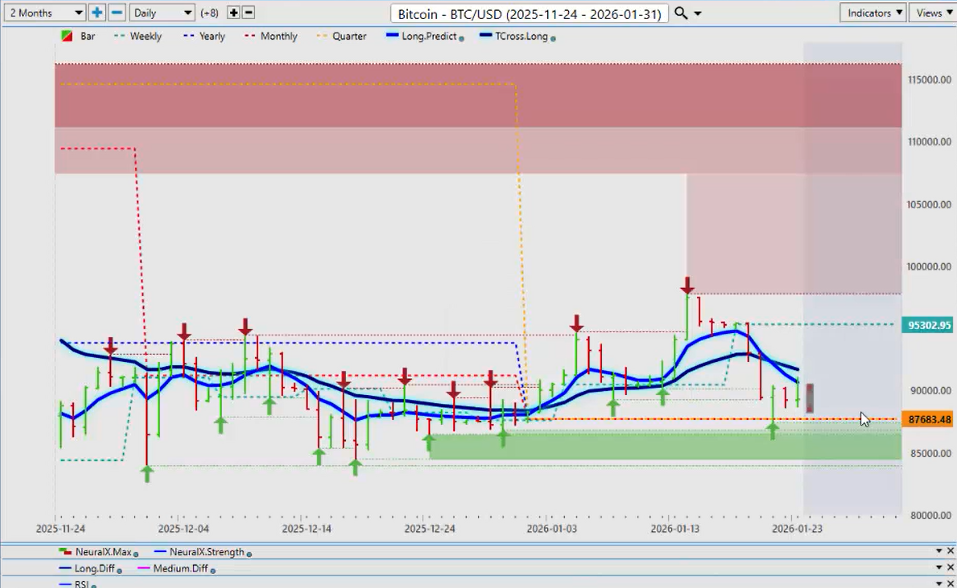
Now, speaking of that all-important yearly opening price, once again, uh, with that yearly opening price, 87,683, that was under pressure this week. And again, uh, this is a good example of this type of year, at this time of year, excuse me, why you want to be watching that level very, very closely outside of standard technical indicators.
Because this is a line in the sand. If it’s above it, it’s bullish. If it’s below it, it’s bearish. So, we bring in our other core indicators here, and I’m looking for that pink line to turn back up, cross the blue line, to see this accelerate.
Once again, you’ve got a neural index that’s red, but you have a neural index strength that’s actually internally, inside that neural index, is rising. I would agree with that neural index strength. And as long as we’re above the yearly opening price at 87,683, longs are still reasonable. But I would also want to get above the T cross long at 91,659 as soon as possible.
U.S. OIL ($USO)
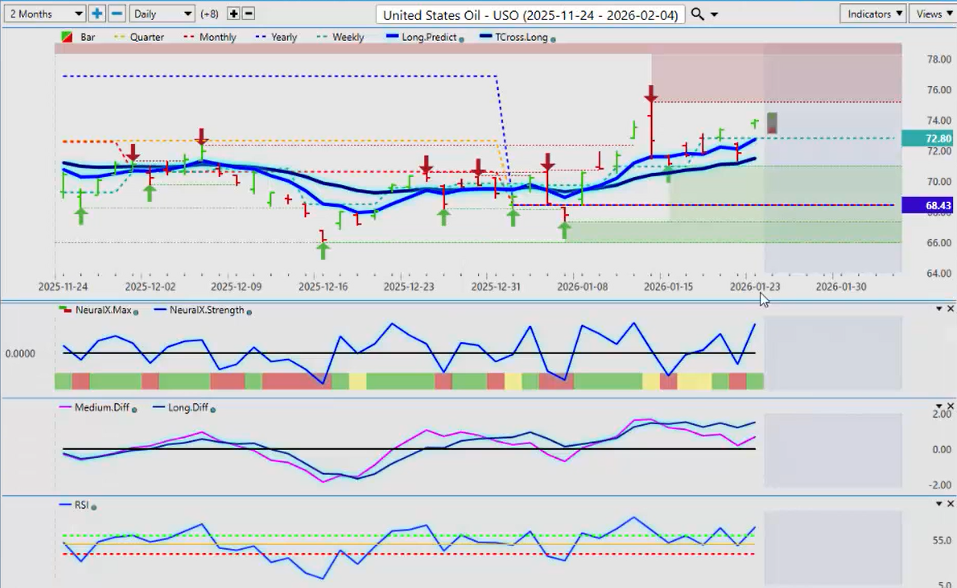
Now, with oil going into next week, oil, I had talked about it last week. I’ve talked about this for a few weeks. The very second gold, or excuse me, uh, or actually yes, it was Goldman Sachs that put out a price target of 2026 of $30 a barrel.
And in the Vantage Point live training room, uh, we basically were saying we should be long immediately. It doesn’t matter what the price is. Uh, just like when a lot of these, uh, big websites and that, and I saw them the other week saying that dollar to the moon. And no, guys, very often this information is released to mislead you.
So when I look at this and what Goldman Sachs was saying, yeah, no, I don’t think so. The VP software does not agree with that. So we’ve had a good push here, and I think we, uh, continue to advance our mean retrace, mean retracement area, again, 72.72 and 71.48.
VIX VOLATILITY INDEX ($VIXY)
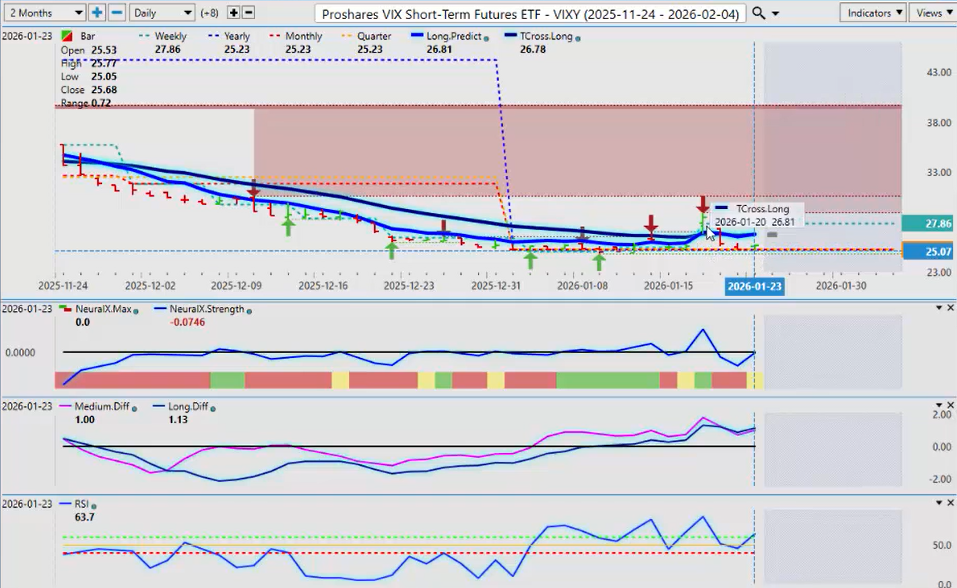
The VIX, uh, again, the VIX is at a make-or-break level for next week, guys. And what I mean by that is we’ve pushed a little bit higher, but we’ve immediately come back, like a moth to a flame, to that all-important calendar yearly opening price that is 25.23.
I believe we can break, possibly break down below that, uh, within the next week or so. Uh, but as when we do that, would see probably the next push up in the global equity markets.
GLOBAL EQUITY MARKETS AND DAX
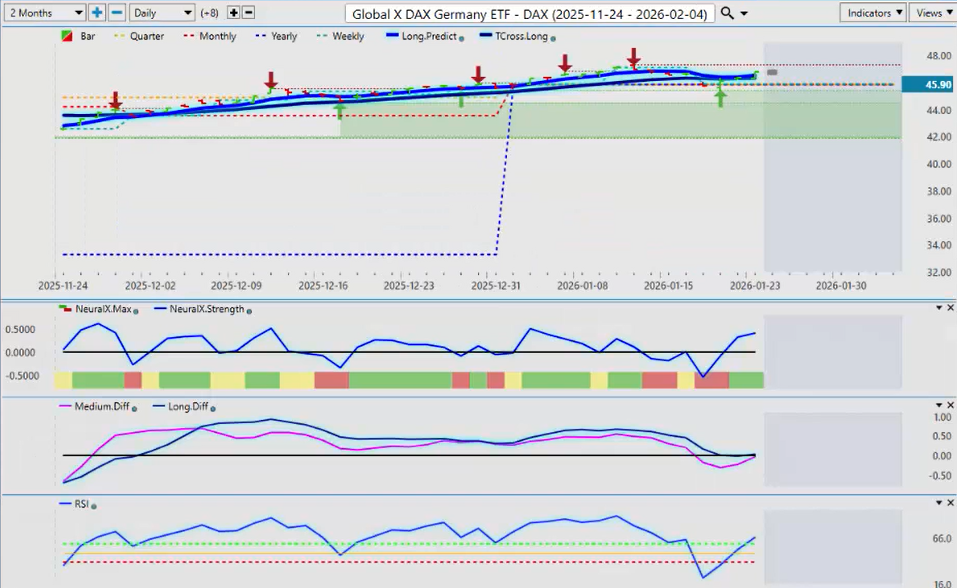
So based on the global equity markets, not just the U.S., for my good friends in Germany, we also make sure want to make sure we’re looking at the Global XDAX. Now, the correlation I’ve seen here, my friends, is a pretty high correlation.
The two that I’ve also been targeting is the DAX, but also the Russell, the both of these two. And I find that they’re highly correlated right now. So, the DAX looks real good for next week. Uh, nothing’s a guarantee, but we’ve come down just like the S&P and the NASDAQ, and pushed a little bit below the yearly opening price, but very quickly recovered, and now we’re pushing back up.
So once again, if we can hold and stay, whether you’re trading the ETF or futures, guys, just like again, like the Dollar Index versus the USDU, there’s more than one way to skin a cat here. Let’s not bicker over which one’s better. Let’s look at them both and see which one is producing the better signal.
I believe the Global X DAX ETF is producing a slightly more accurate signal. So this is saying up. So if you’re trading futures, you’re using this to say, okay, it’s a go for futures.
Predicted differences are rising. Neural index strength looks good, but that predicted RSI is showing momentum here for a bigger push up. So keep an eye on that. I think there is something there.
Euro versus U.S. Dollar ($EUR/USD)
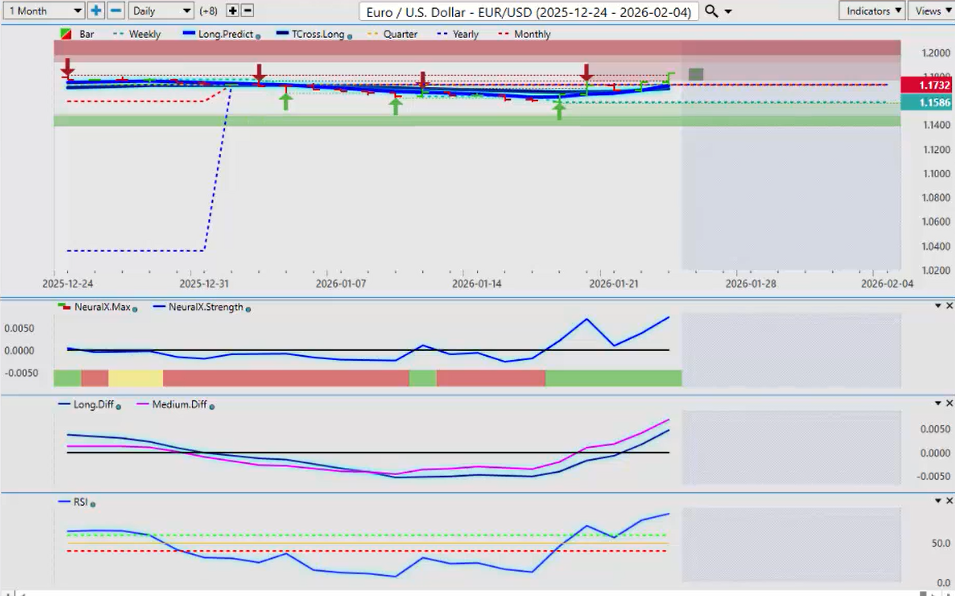
Now again, to go into a few of the forex pairs for next week, the euro. Uh, the U.S. dollar getting absolutely pummeled against the euro. But what I will say is that, uh, again, nothing goes straight up, nothing goes straight down.
Uh, is this a trending move, just not a monthly move? That’s where we have to decipher this. Now, so the yearly opening price here is 1.1732. We’ve closed out the week at about 1.1829, I believe.
So this is your line in the sand, guys, 1.1732. As long as you’re above that, longs are still in play. We don’t want to complicate things past that.
That’s how you define a trend on a year-over-year basis or year-to-date basis. And say, “Okay.” People will say, “Oh, this, the euro, it’s corrective. It’s super, super bearish, still dollar strong.” No, that’s not true, guys. There’s nothing factual in that statement.
When you turn positive on the year and stay positive on the year, that’s when something is a correction to the downside, not a new trend. This is, right now, this is a new trend.
So again, the whole concept here is that the former resistance would now turn support. It’s a cliche, I know, but it’s also factual in this particular case. So watch that level very closely. The indicators on VP are still clearly bullish.
US Dollar versus Swiss Franc
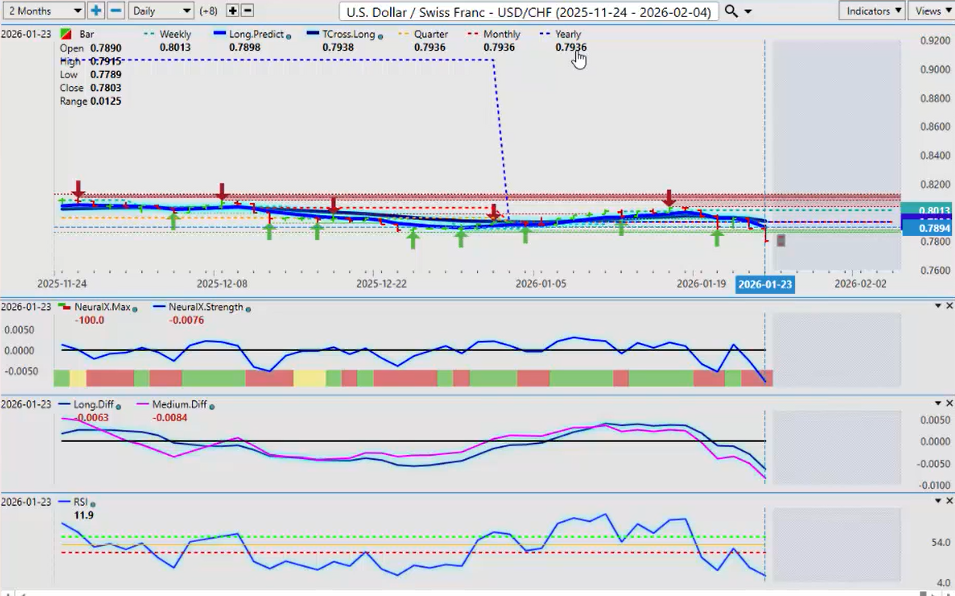
The U.S. dollar / Swiss franc. Also, the dollar taking a beating against this one. Horrible beating. And that’s fine. Everybody takes a beating once in a while.
But again, uh, the Swiss franc can weaken very quickly if those equity markets turn higher. So again, you’ll watch that 0.7936 area. Your sellers will target that area for a retracement. Buyers, you will look for a break of 0.7936.
Very easy trade, actually. If you believe that this is going higher, you put a buy stop above 0.7936. Easy peasy, guys. Don’t complicate it past that.
British Pound versus U.S. Dollar ($GBP/USD)
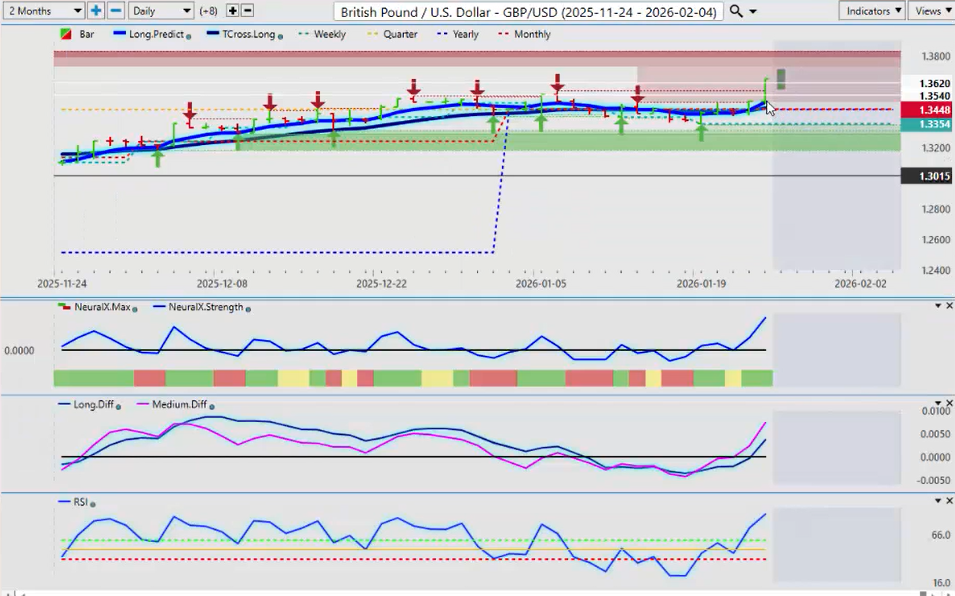
Pound / dollar. Again, this is all very similar here, but you can really see the dollar lost ground against the British pound. It too has now turned to a new trend.
We are officially in a downtrend on the dollar for the year and in an uptrend on all the other G7 currencies. So the pound, your critical level there, your T cross long, 1.3456 and 1.3448.
All your retracement areas are right there, guys. And the only one that’s slightly different is 1.3496. Myself, I think I would be holding off towards back towards at least the T cross long.
U.S. Dollar versus Japanese Yen ($USD/JPY)
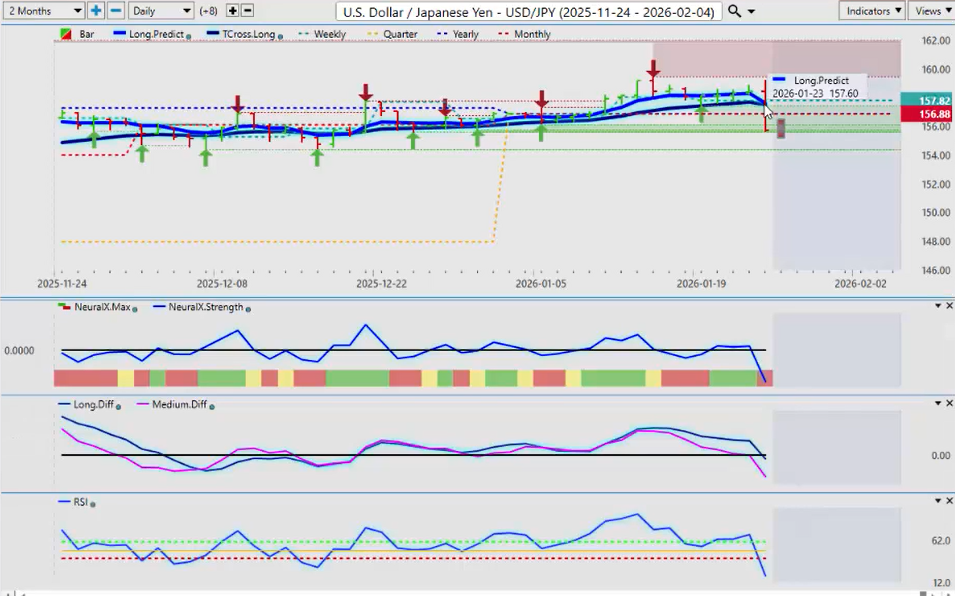
Now, when we look at the dollar / yen, uh, the dollar / yen, uh, I would argue the dollar didn’t do well against the yen either, but it didn’t actually do horrible.
Uh, a lot of these losses are piling up going into the weekend. That looks more like profit taking. So for now, uh, again, the interest rate differential between the Bank of Japan and the Fed, heavily on the carry trade, favors the U.S. dollar.
We’ve got the Fed coming up next week. If there’s a change in interest rate, which is unlikely, we could see some dollar buying kick back in as early as Tuesday, Wednesday next week. So keep an eye on this one.
But again, identify where your line in the sand is, guys, and that is the yearly opening, 156.88, right? Our T cross long, 157.52. These are upside targets we need to stay below.
US Dollar versus Canadian Dollar ($USD/CAD)
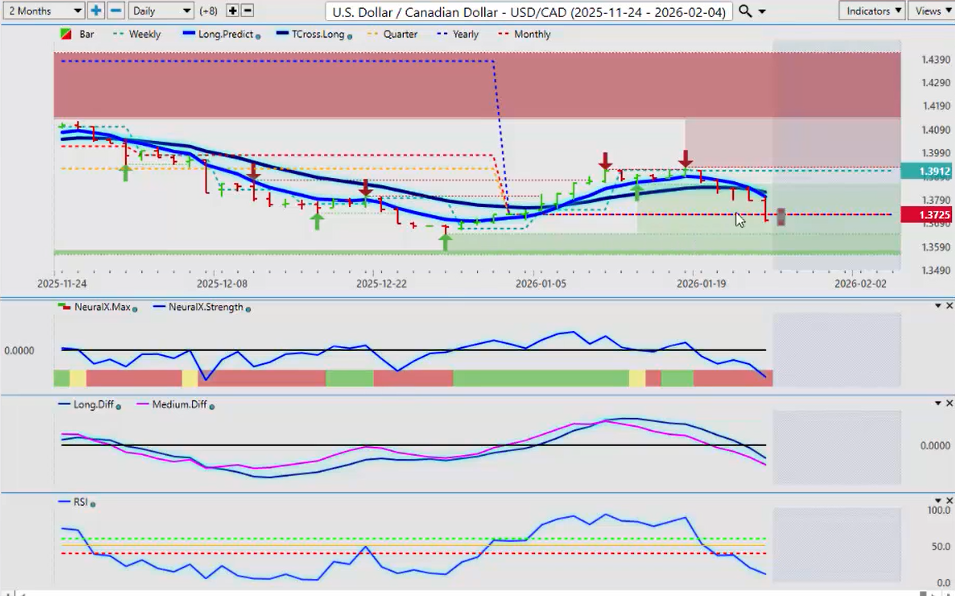
Now, the Canadian dollar, not my favorite currency, that’s for sure. But even the dollar lost significant ground against this one, too.
But this is where it’s going to get interesting. The yearly opening price is 1.3725. Tensions between Prime Minister Carney and Trump, uh, it’s escalating again. And again, this would technically favor the U.S. dollar, but for now, I’m not going to make that call.
The whole purpose of these videos, which is for educational purposes, is to pass along information, useful information that you can use to benefit your trading. So the yearly opening price is the area you want to keep a very close eye on, guys.
Uh, if we stay below that, then this pair goes into a downtrend. If we get back up above it, then this was nothing more than corrective. And we are very close, closing the week at 1.3701.
So again, we’ll have a pretty good direction on U.S. / Canada by Tuesday of next week.
Australian Dollar versus U.S. Dollar ($AUD/USD)
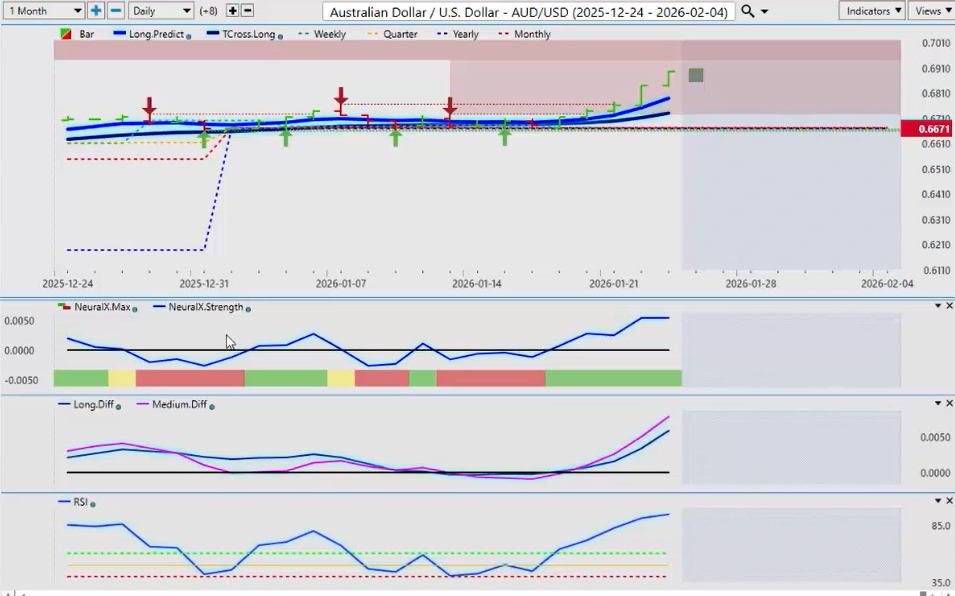
Now, the Aussie, the Australian dollar, is the one currency that I’ve really been promoting for an extended period of time here. I believe it to be grossly undervalued against the U.S. dollar, very much like the Kiwi.
But this shows everybody the power of truly identifying a trend using that current yearly opening price. There are too many retracements in this area to even count.
And then finally, we got exactly what we knew was coming, dollar weakness, and the Aussie jumped on it. So I believe we still have a considerable amount of upside left on this particular pair.
But nothing goes straight up. So your retracement points, guys, or a potential entry, starts at 0.6789, goes to 0.6731, and all stops below 0.6671.
And again, longs remain heavily biased. My Spidey sense, whatever you want to call it, tells me that after that retracement, this pair goes up February, March, too. They’re usually good months for the Aussie, but a good move. Just be careful of your retracement next week.
New Zealand Dollar versus U.S. Dollar ($NZD/USD)
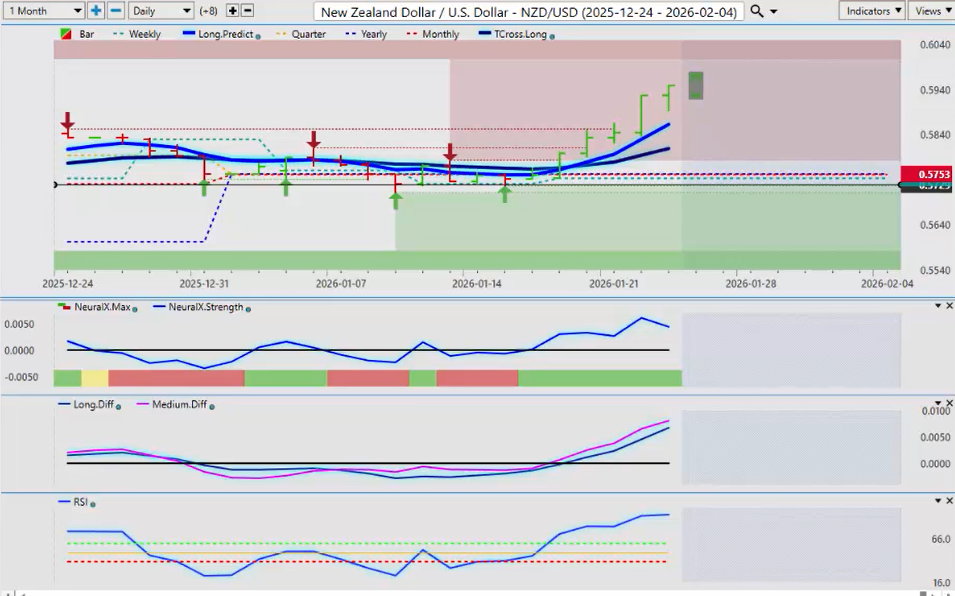
I would argue the same for the Kiwi, but I was very impressed with the Kiwi’s performance. Another currency that I think was picked on in 2025 because of interest rate cuts.
And again, that yearly opening price, you can see these retracements. The market, the bulls and the bears, easiest way for me to say it, are fighting it out at these levels.
We don’t care who wins, guys, because once one side is going to throw in the towel, and you can see that last week they really threw in the towel. This is, and I’m questioning whether this is just a standard monthly move or we’re into a much bigger upside trend.
And that’s what I’m looking for. That’s what I’m betting on with the Aussie, and I think the Kiwi is a very good bet also.
So, uh, that’s it, uh, for next week. And always remember, guys, this is an outlook, not a recap of something that’s already happened. We need to know our levels going into next week, and with that, we’ll definitely benefit our trading.
So with that said, this is the Vantage Point AI Market Outlook for the week of January the 26, 2026.


