Welcome to the Artificial Intelligence Outlook for Forex trading.
VIDEO TRANSCRIPT
Hello everyone and welcome back. My name is Greg Firman and this is the Vantagepoint AI Market Outlook for the week of June the 21st, 2021. Now, to get started this week we’re going to begin with that very important US dollar. Now, no shortage of volatility as was suggested in last week’s weekly outlook, that the Fed will push the dollar either up or down depending on what his current position is. He’s softening on tapering. They’re talking about rate hikes sooner rather than later, a complete flip-flop which sent the markets into a tailspin, quite frankly, gold crashing, the S&P 500 moving lower, the dollar moving up, but all we need to do is understand, again, the indicators.
U.S. Dollar Index
When we look at the verified zones, we can see that the dollar’s been running in this channel going back into the end of April. That channel is now broken or at least it appears to be. Now, I will forewarn everybody. I don’t think next week’s going to be any less volatile because the Feds at it again, testifying, I believe, before Congress next week. If the equity markets, more specifically the S&P 500, if they continue to plummet, the Fed will jump in and save them and prop them back up.
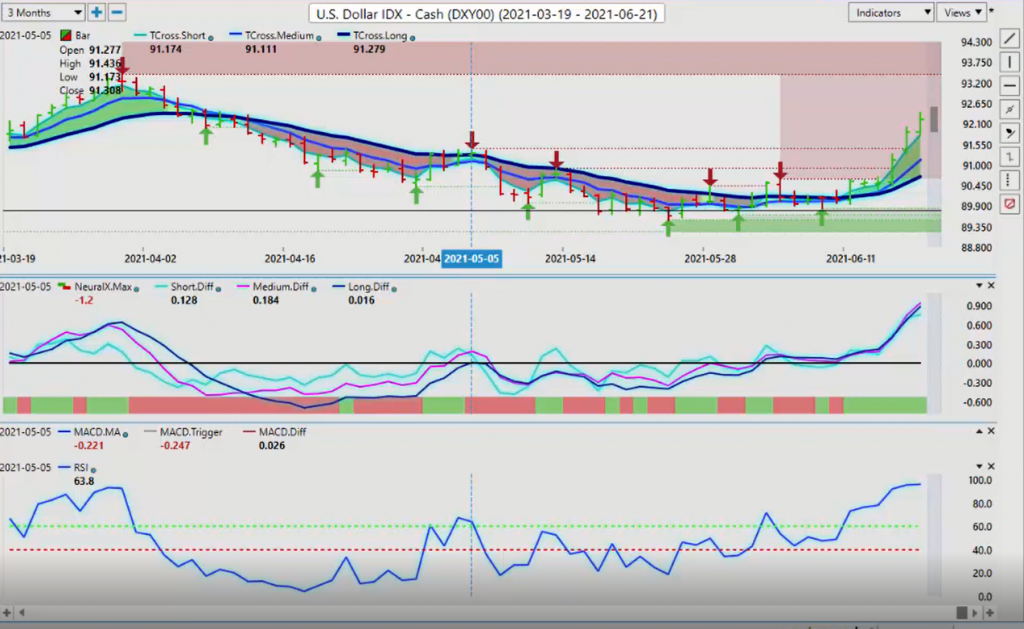
For now, the top part of this range that’s broken in the verified zone is 9143. The dollar needs to remain outside of this channel if it’s going to continue to advance because, as you can see, the dollar never really moved until after the Fed on Wednesday, on this bar, it could have gone either way. Even with my own direct client group and in the Vantagepoint Live training room, I gave the scenarios of how to play this, what would go up and what would go down if the Fed became hawkish.
We would see gold crash. We would see the dollar go higher. We would ultimately see the majority of the currencies lose ground against the dollar if the Fed changed his position, which he has. Now we’ll see what he has to say before Congress in his testimony and if he will remain with that hawkish stance. Again, looking at that channel is very, very important here.
Then, applying the Vantagepoint predicted moving average, our T-cross long is 9069. Now, once again, this level down here that I’ve discussed over and over and over again, over the many months, actually since January the 4th, is the yearly opening price. The dollar has been closing above the yearly opening price 98% of the time this year so it doesn’t surprise me the dollar’s bounced off of here but we are still within the overall range.
If we’re looking at an upside target, we would be monitoring a target. If we can stay outside of this particular channel, then we would target the 9340 area on the dollar but we would watch these indicators very closely; the predicted differences, the predicted RSI grossly overbought but, once again, overbought and oversold conditions are really meaningless in most markets.
If the algorithmic programs are going to continue to buy this, then nothing’s going to stop them. Right now I’m pretty confident they’ve got their eyes on the 9340 area but we must, again I will emphasize this, we must stay outside of this channel at 9143. Now if we click on our F8 in our Vantagepoint software, we can see at the top of that channel we also have the T-cross long at 9136. This makes this a very powerful support zone so keep your eye on the prize here. If that level holds, then we will have a natural correction on gold, on equities, on the equity-based currencies.
Once that correction’s done, if the dollar really is going into a new trend then we will stay above this particular level.
Gold
Now, with the dollar taking a big hit you can see that gold was sitting on the breakout point, also going into the Fed at or about this verified low here on the verified zone, that was coming in at about 1861 or on the future side about 1855. Again, you can see nothing really happened. The only catalyst that sent gold lower, the dollar higher, and the Euro US lower was the Fed, so what the Fed given the Fed can take away, and could take it away as early as next week.
Just be mindful of that because we have a very strong verified support low at 1759. We would have to close below this. Now, I expect volatility in gold to really pick up at the end of the month with those paper contracts being adjusted, some of them being canceled out of Europe, et cetera. Remember that, that gold is not necessarily done here, guys. We would … In my respectful opinion, not only do we have to break through these zones, we would have to get below the 1678 mark, this bottom end of this verified zone, because when we look at this over a six month period we can assess that this is very, very heavy support down here also.
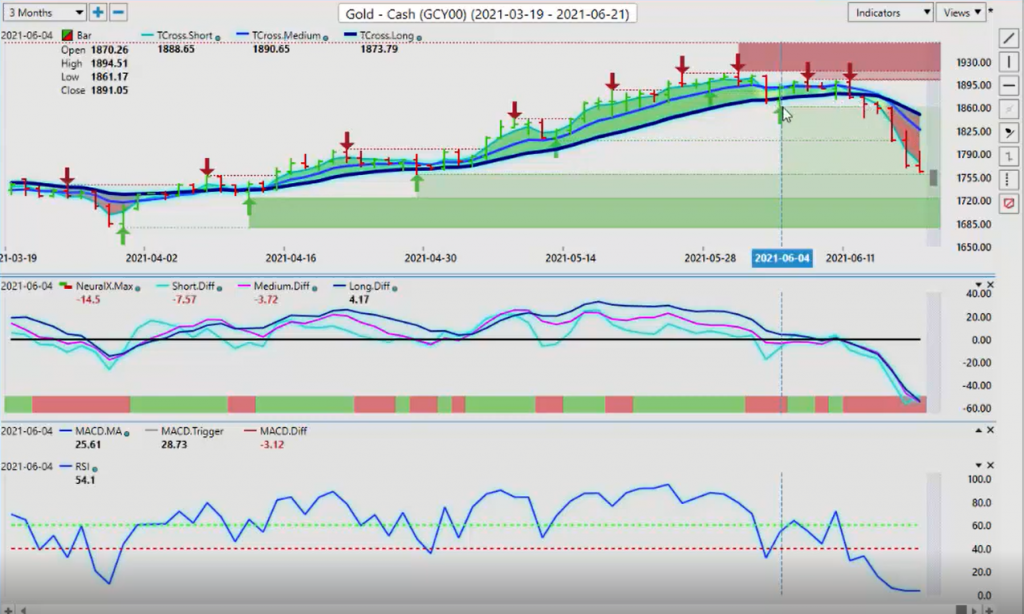
The immediate numbers that we need to watch for next week, on the downside for a corrective move back up, are 1759 and, of course, 1723, a lot of very, very big support here. Now, again, we’ve come back up, we’ve made a lower high. Now, you’ll also remember I’ve discussed this one at length also. The level that I put into these charts, 1904, the yearly opening price, once again one of the more powerful non- indicators that warned us that, “Look, we’re really struggling to get above this,” but I would still stand by the fact that this entire move was Fed induced.
If the Fed just held his ground and said no interest hikes till 2024, we’re not ending tapering, then gold would easily have been above 1904, guys. Again, it’s the Fed swinging the market in both directions but we’ve moved a considerable distance from the T-cross long at 1849 so I’m still looking for a potential retracement. You can’t get much more oversold than 3.4 on the RSI but, again, that doesn’t mean it can’t go lower here, guys, but it certainly is going to have market participants really thinking do they really want to sell down at this particular level?
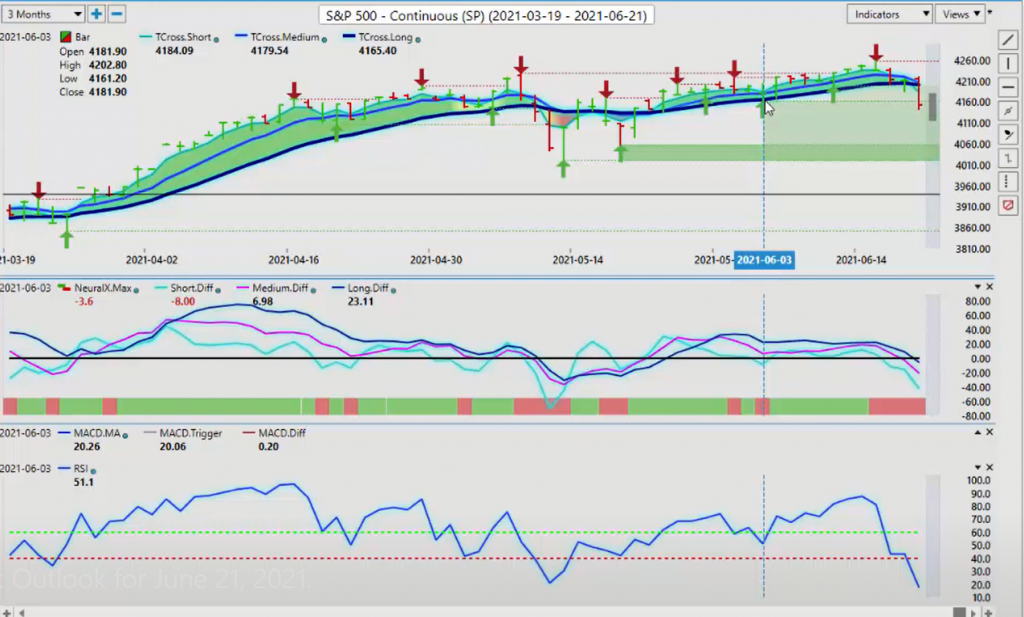
This verified support at 1759, that’s the level we want to keep our eye on. Right now, we do not have a buy signal in the Vantagepoint software on gold at this particular time other than the warning of the verified support zones down here that they are very heavy support down to 1723. Now, when we look at the S&P 500, once again the S&P 500 succumbed to the Fed on Friday. It tried to hold its ground desperately but it also took out a very strong support, low at 4161.
Now again, in my respectful opinion only, I believe that if the equity markets come under heavy selling pressure the Fed is going to change his tune a bit and he’s going to try and throw water on this thing, not fire, so be cautious of that. I believe that the equities are still in a strong uptrend, they just need a little bit of a corrective move lower. If the US economy does take off and fires on all cylinder, that’s a good thing for stocks here, not bad. It’s just a question of what will happen with the US dollar.
S&P 500 Index
Remember, you still got deficit spending going on in the US, you’ve got massive debt building up here. The printing presses are going to be going so if I was a betting man, which I am, which one has a better chance of a longer-term continuing the trend, I would argue it would probably be the S&P 500 as these companies, again, start ramping up for a strong fourth quarter. We’ll continue to monitor this but right now, again, we can see where that support is at 4161 and we will look for that to hold.
If we lose that, then we’re likely coming down into the 4057 area. This is this verified support but, as you can see, I’ve also got the yearly opening price drawn in here, it’s at about 3755, I believe. The S&P, unlike gold and maybe the Euro in some of these ones, the S&P has been in a strong uptrend the better part of the year here, guys so, once again, our resistance level, also the T-cross long, 4200.
One of the ways that I’ve discussed this in the Vantagepoint Live training room is straddling the VP levels, putting either a sell at 4195 and then having a buy limit order ready to go at, say, 4208, 4209. If you pick up the cell, it goes wrong, then you stop it out and you immediately pick up the long on the other side of the 4200 mark. I do this all the time with currencies, with commodities, but it works just as well in the equity market, so as long as you know your levels and where they are.
My concern with that strategy on the long side is that these predicted differences are moving below the zero line. Our neural index is down and our RSI has broken the 40 level. It’s suggesting that we’ve got momentum but, again, the Fed can change all of that, in a heartbeat he can change that. When we’re talking about the S&P 500 we are indirectly also talking about oil. Oil, the key level there for this week for us to watch is 6932, if we can hold above this. The predicted differences are a warning, but this neural index has been green this entire time. It has just recently turned to red.
Once again, another way of using the Vantagepoint software next week, many, many different ways to use this program, from the predicted differences, to the neural index, to the moving average crossovers, the pivot areas of the moving average crossover, or the moving averages by themselves. In this particular case, we can have a cell limit order ready to go just below the 69 mark, say around 689 hort, but here’s what you need to understand, guys, that for that to happen we need stocks to collapse.
You can just measure the global stock market by the S&P 500, that’s at least the way I do it and, again, that’s only me. You can use whichever one you want, but that’s what I use because it’s not crazy like the Dow Jones or the Nikkei where it’s moving 300 points a day. It’s a good barometer to gauge how the overall stocks are doing. Again, if we put our sell orders below there, but you can also buy too off the 6932 area if we anticipate the S&P 500 will recover.
Bitcoin
Now, as we look at Bitcoin, Bitcoin another wild week up and down, trying to get that buy signal, getting all tangled up in these verified zones. We have a new verified high that’s formed at 4129 but, remember, there’s two yearly opening prices; the Coinbase one at just under the 29,000 mark and the futures side at 33,555. Those are two levels but, again, I would be looking for Bitcoin to recover.
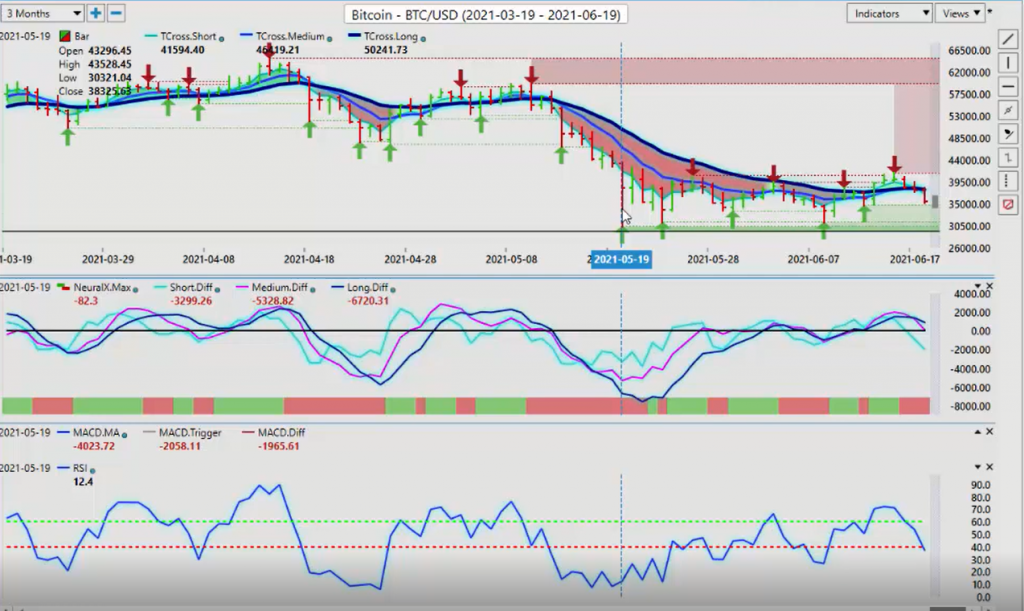
My concern here with the immediate dollar strength, we’ve got a medium term crossing the longterm predicted difference, we’re failing at the T-cross long, exactly on that level on Friday, our neural index is down and our RSI is telling us that we have momentum building to the downside.
On another push of dollar strength, up until about mid-week or until we hear from the Fed, then we could see Bitcoin coming back down into its previous low, around the 30,000 mark. Again, in my respectful opinion only, we must breach that Coinbase yearly opening price at 28,885. As long as we’re above that, Bitcoin remains a long trade. Now, as we move into our Forex pairs, the Euro US, once again, as we can see, the Euro was clinging to these verified zones and the only thing that sent this thing down was falling gold prices and the Fed.
Euro versus U.S. Dollar
This is not indicative of wave formations or overbought, oversold, any of that kind of stuff, guys, it’s the Fed, so and that’s why I’m warning everybody that he’s talking again next week and that could send Euro US back up in a heartbeat. I don’t know if it will or not, we’ve taken out these zones, but the same channel that I just discussed on the dollar index, this same channel on Euro US has been broken right here.
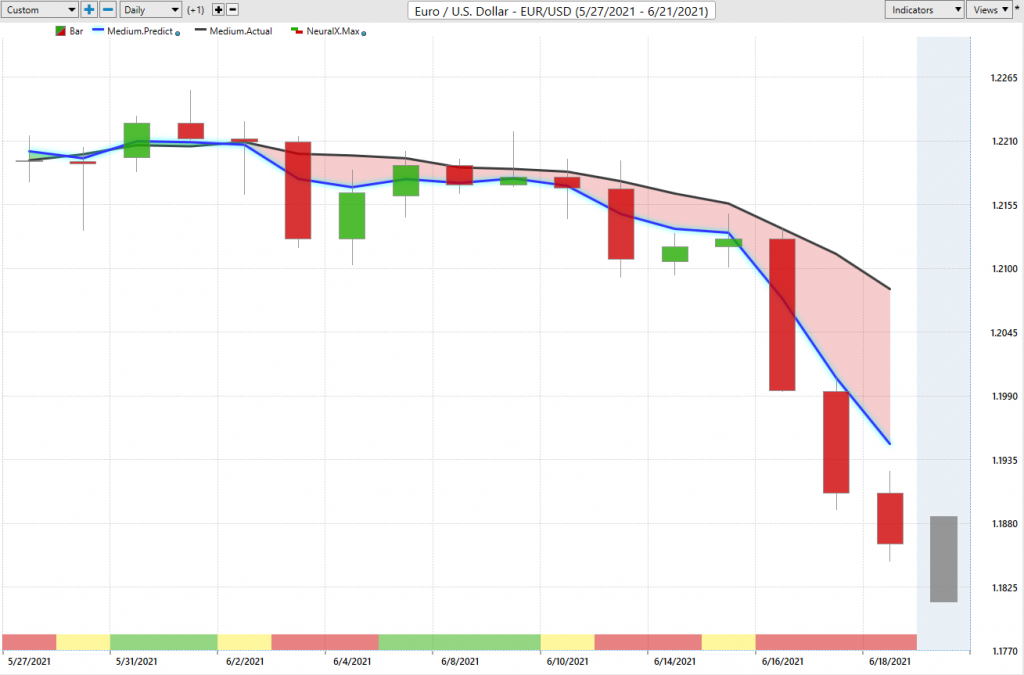
This verified zone on this particular low is a very big one and that low is coming in at … The original low is around the 119, essentially around this level here, around 11942, which we’ve pushed down. Much like the dollar index needs to stay above that channel break, we also need to see the Euro staying below this channel break, so the dollar index holding above 9143, the Euro US holding below 11942. 11942 is a key resistance point for us to start the week and appoint a point of interest, that if we believe that the dollar is going to strengthen then that’s the area we would target again for shorts.
When we click on our F8 in our software, we bring up that lone predicted moving average and we can see that it’s starting to move towards that lower end of that range. Now, that long predicted, 11992, so the level between 11992 and 11994 is where we would look to target shorts if gold remains under pressure, if the dollar index remains above 9143.
The key thing here, guys, is that we want to see a trade ahead of time. We don’t want to react to things that happened on Wednesday and Thursday after the Fed, we already want to have a game plan in place. Outlining these levels, you will know what to watch for and understand that this channel is a very important one. If the Euro slips back up inside this, then we go back into range trading, but right now the indicators are suggesting we are going lower.
U.S. Dollar versus Swiss Franc
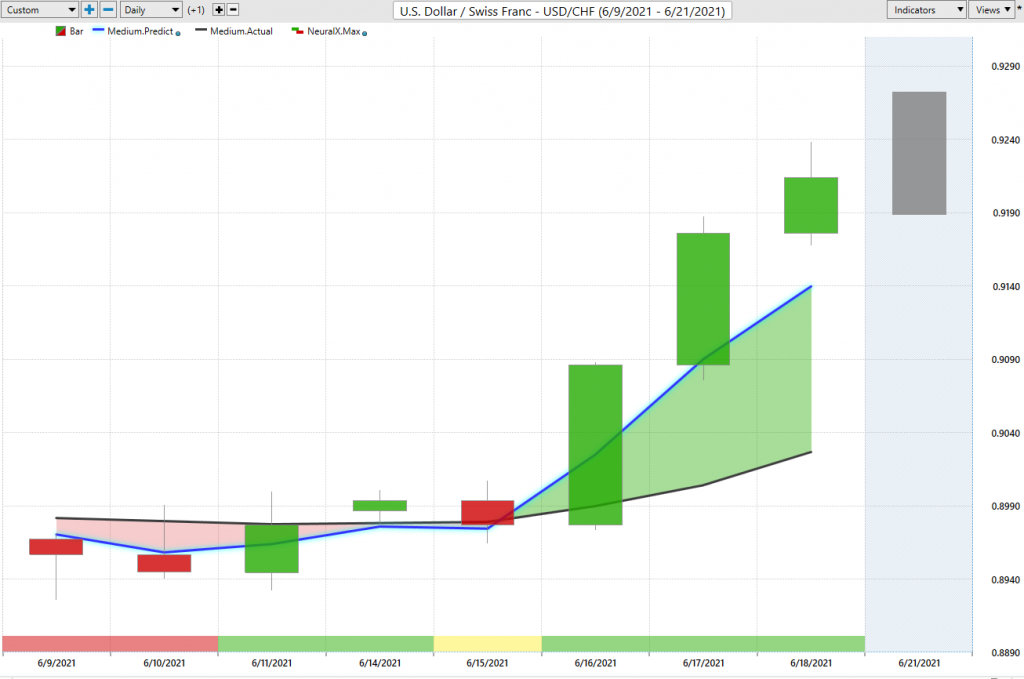
Now, with the broad part of the presentation this week, of course, is dollar strength so we can see, again, this channel on US Swiss Franc is broken. The high of that particular channel, 9181, so we’re looking for the US Swiss Franc to stay above 9181 but, more specifically, holding above 9039, the T- cross long.
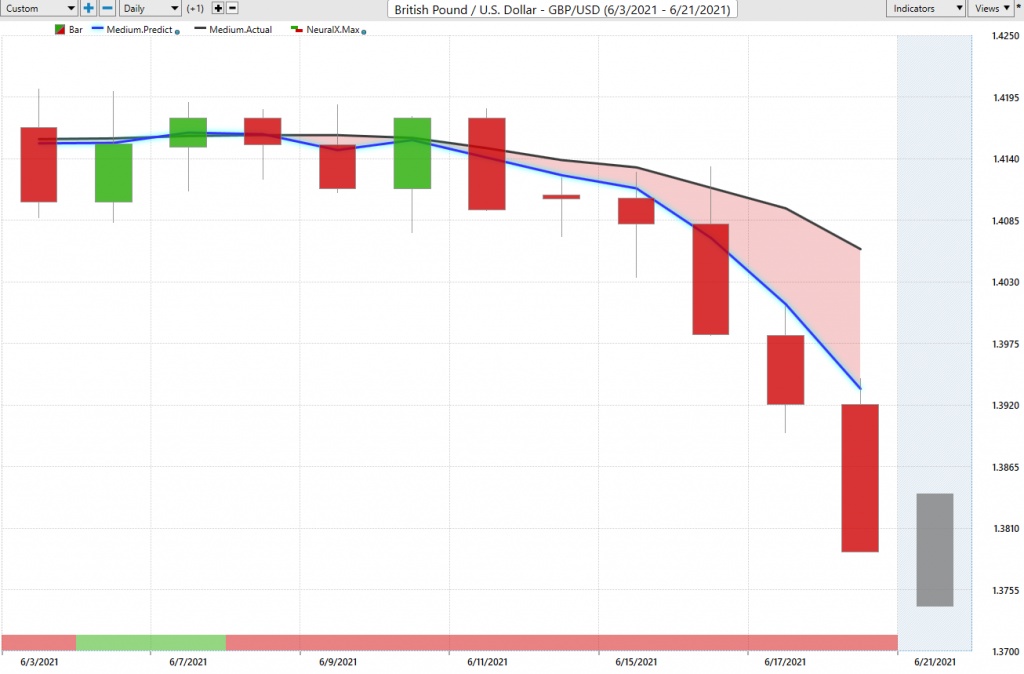
British Pound versus U.S. Dollar
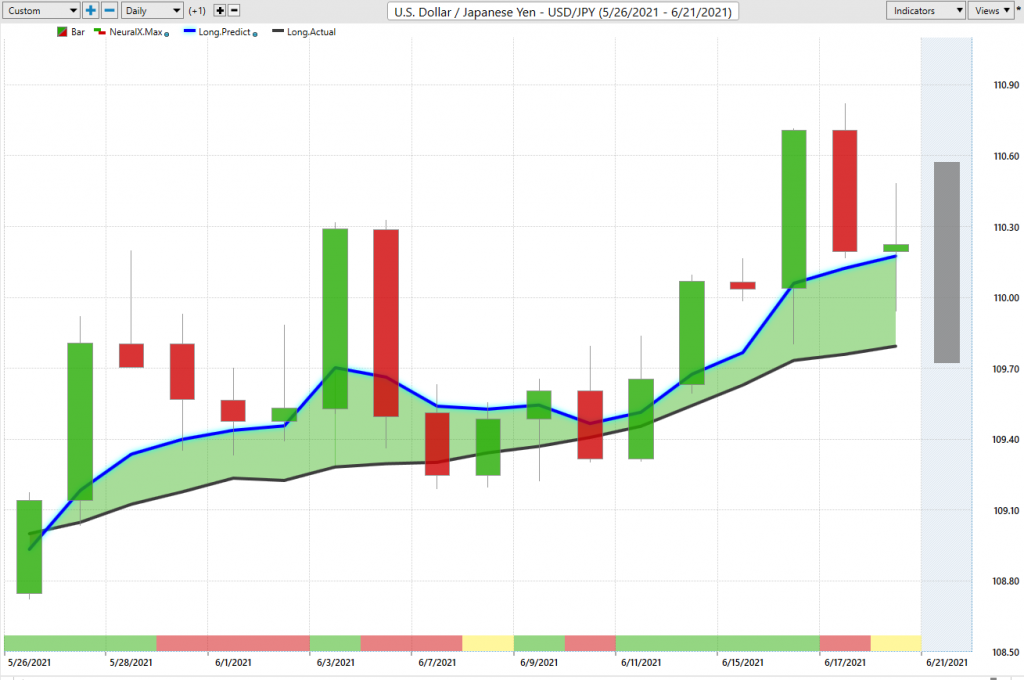
U.S. Dollar versus Japanese Yen
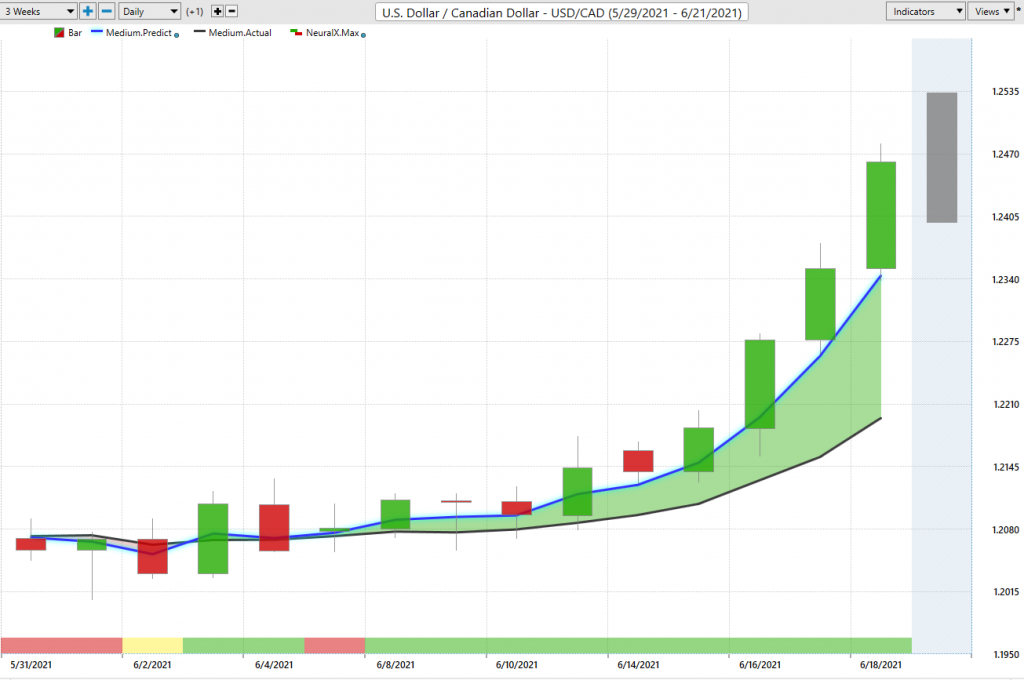
U.S. Dollar versus Canadian Dollar
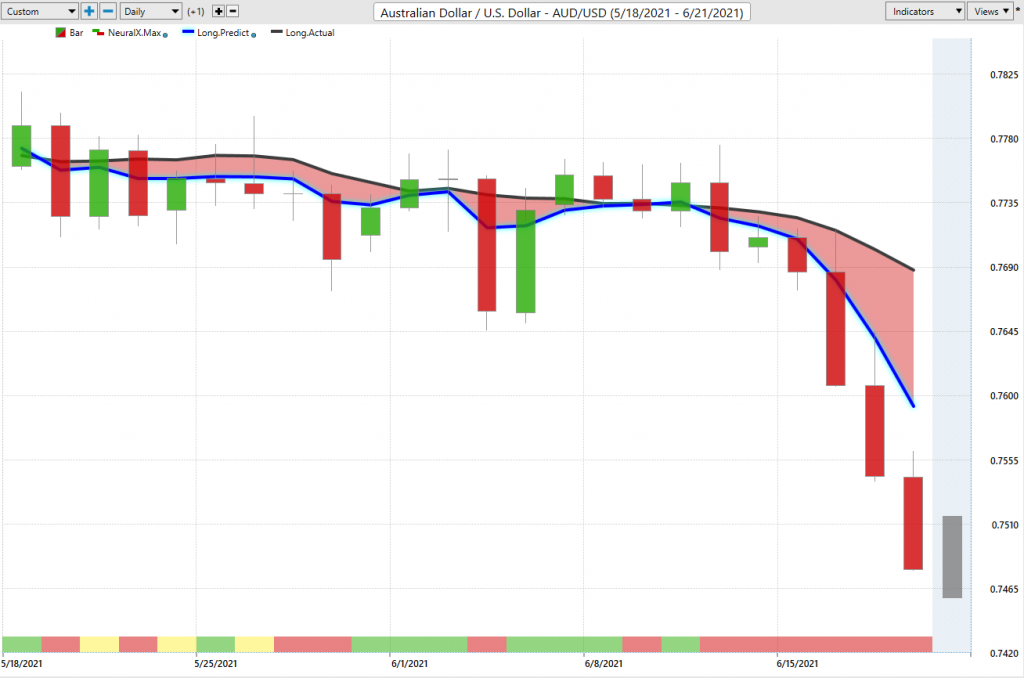
Australian Dollar versus U.S. Dollar
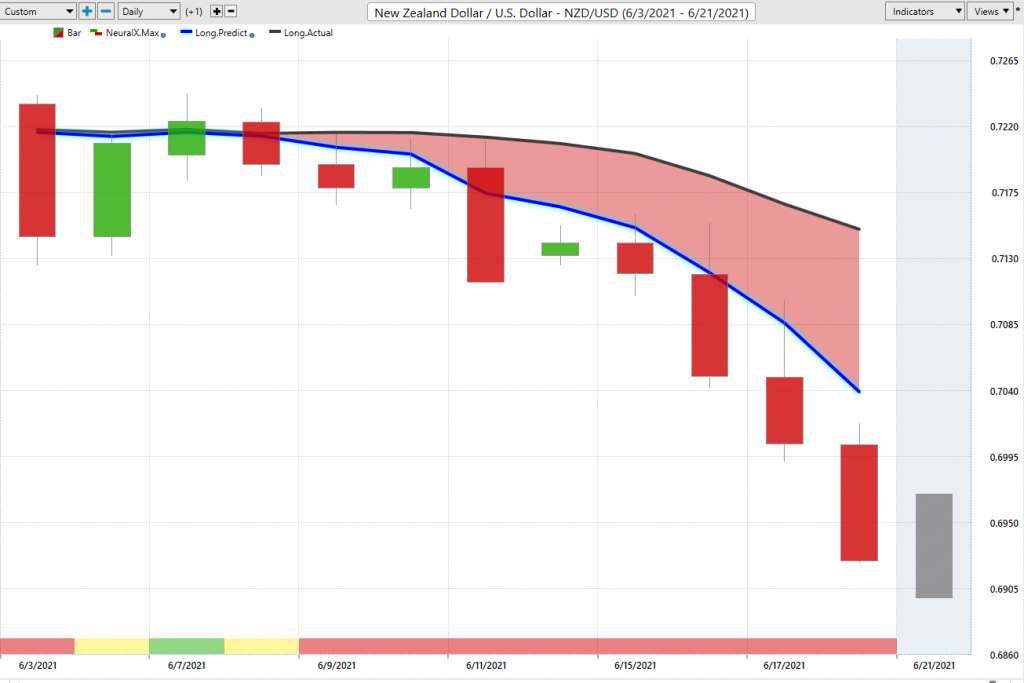
New Zealand Dollar versus U.S. Dollar