Welcome to the Artificial Intelligence Outlook for Forex trading.
VIDEO TRANSCRIPT
Okay. Hello everyone, and welcome back. My name is Greg Firman, and this is the Vantage Point AI Market Outlook for the week of March 11th, 2024. Now, to get started this week, we’re going to go back to our main intermarket correlations here, so we have some idea what’s going on with these markets after a data-fueled week. We had Fed testimony, so let’s look at the actual performance of the S&P 500.
S&P 500 Index
U.S. Dollar Index
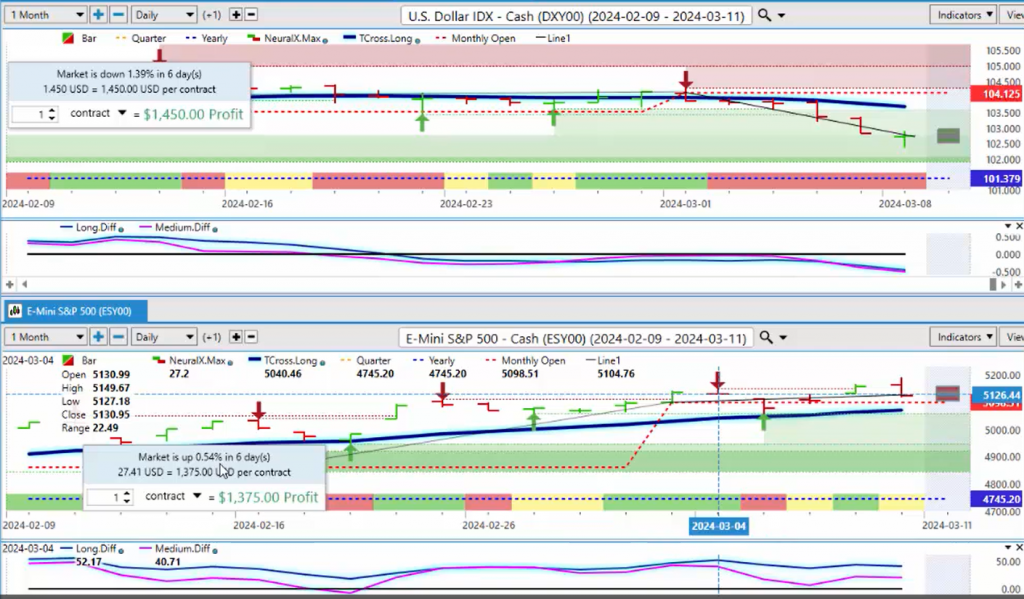
We are most certainly not up 1.15% on the week; we are basically flat. We’re barely up anything on the week. As you can see, there’s our opening on Monday and our close on Friday. But for the month, we are up a mere 0.54%. So, we’re also going to work in the VIX here to see if there’s anything going on with the markets that are telling us the equities may not be as strong as what they appear to be.
So, what I’ve done is a comparative analysis to the dollar index. The dollar is down slightly, as we can see, 1.39%, but the dollar is firmly still above its current yearly opening price. Now, if we go back a random 5 days or a random 30 days, we’re not seeing the true performance. The true performance model, because we’re looking to see at the beginning of the month, the end of the month, what buyers and sellers are doing, the main fund. So, as we can see, the dollar is struggling here on a very weak payroll number. It was not good at all; unemployment rate going higher, U6 going higher, things moving in the wrong way. But I firmly believe that that number was leaked, and they knew this, and that caused a spike in gold last week, which we’ll talk about in a minute. But the main thing we want to understand is the true performance of the S&P 500 for the month of March with a proper anchor point. We can see that we’re basically up virtually almost flat on the week and on the month, a mere 5.4%.
DAX versus S&P 500 Index
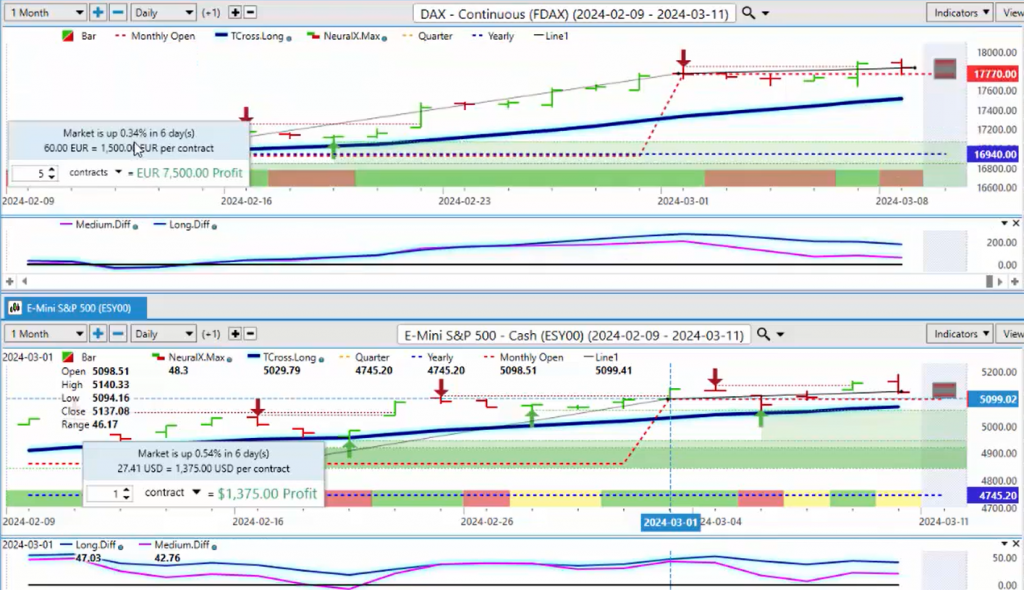
So, when we look at the global equity markets, we can see that the DAX, basically the same thing. On the month, it’s only up a mere 0.34%. On the week, it’s did slightly better as we come back for five days right here. Then the DAX is up slightly on the week, but not much. Now, the key thing we’re looking for here is to remain above our yearly opening price and more specifically, our T-cross long that’s coming in at 177,516. But again, the DAX, like the S&P 500, is actually struggling here in the month of March. It’s nowhere; neither one of these two are nearly as strong as what you would think, despite that US dollar moving lower.
Treasury Bonds
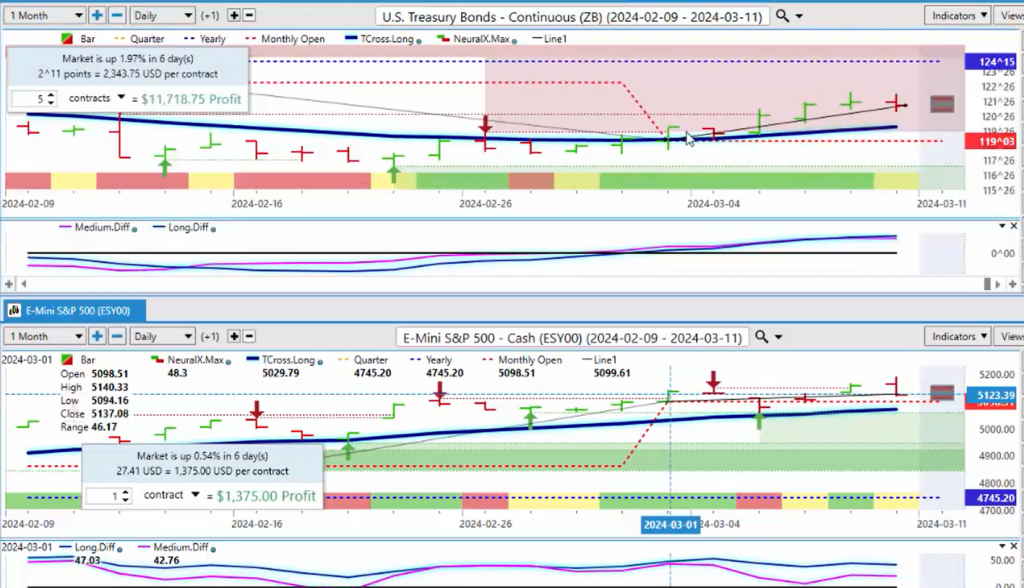
Now, when we look at the treasury bonds, we can see the treasury bonds firmly responding to that dollar weakness, up 1.97% in the month of March using an accurate anchor point to gauge the performance. If we go back a random 30 days from the 7th or 8th of March, then we’re bringing all; we’re doing is creating lag in our performance, our true performance model, and what we’re further doing is causing confusion as to what the markets, what are these markets really doing? Are they bullish or bearish? So, the treasury bonds immediately responding to that dollar weakness.
CAC 40
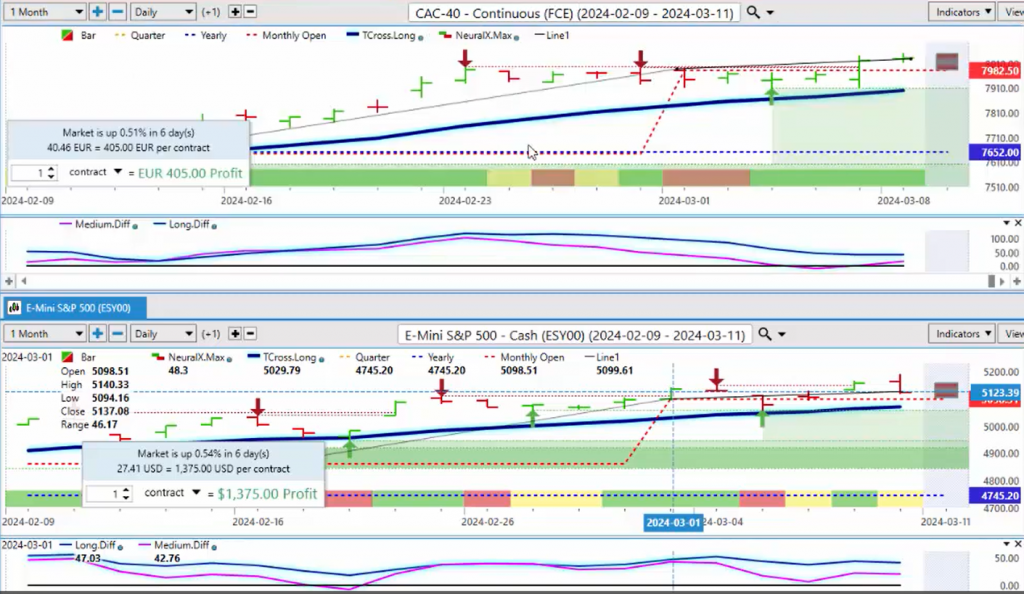
Now, when we look at some of the additional European markets, the CAC 40, again, it’s up a mere 0.15%, which essentially mirrors the S&P 500 for our March performance because again, I don’t want to drag whatever was going on in January and February. The last thing we want to do is drag that into March because again, it creates lag and it creates distortion in price in my respectful opinion. But again, the CAC 40 firmly above its yearly opening price. I would argue that this may be a little bit toppy; our T-cross long here coming in at again 7901. We need to hold above that in order to remain long.
FTSE 100
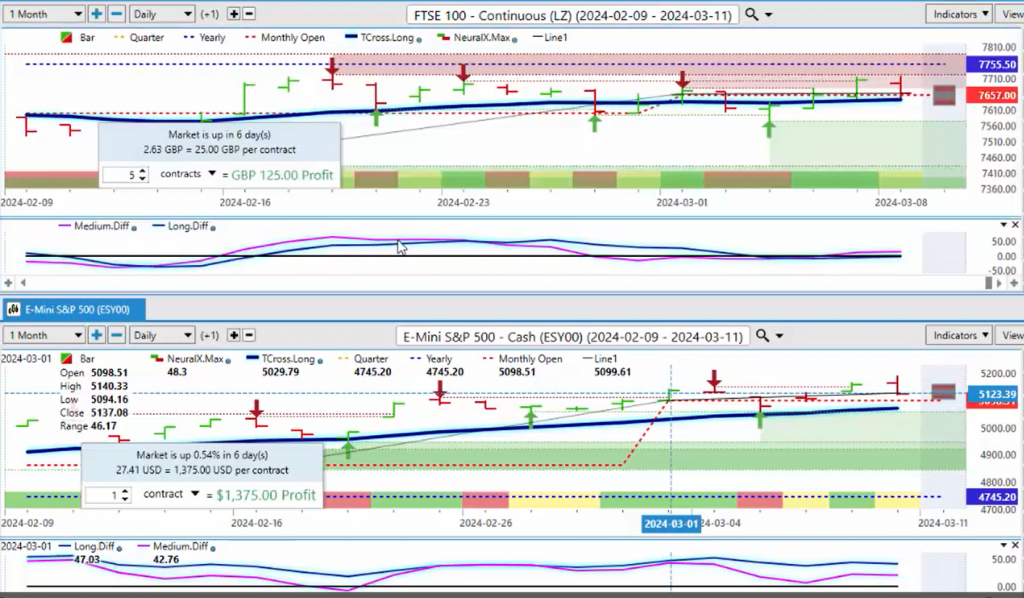
Now, when we look at the FTSE 100, we can see that the FTSE again, not anywhere near as strong as what the CAC 40 and the DAX, the CAC 40 and the DAX are; we can see our yearly opening price on our FTSE here is coming in at about 7755. So, again, we’re below the yearly opening price, the current yearly opening price, and we’ve been below that the entire calendar year, showing that the FTSE, out of the global indices, is one of the weaker ones. But there is one that’s even weaker, which I’ll show in a moment. But we’re holding above our T-cross long, 7642, for the global index traders; this one here looks like it’s getting ready to break down, and I would argue that this is largely based around that strength, which I’ll show in a moment, around the British pound. So, if the pound continues to extend, it’s likely to put additional pressure on the FTSE.
Dow Jones Euro Stoxx 50
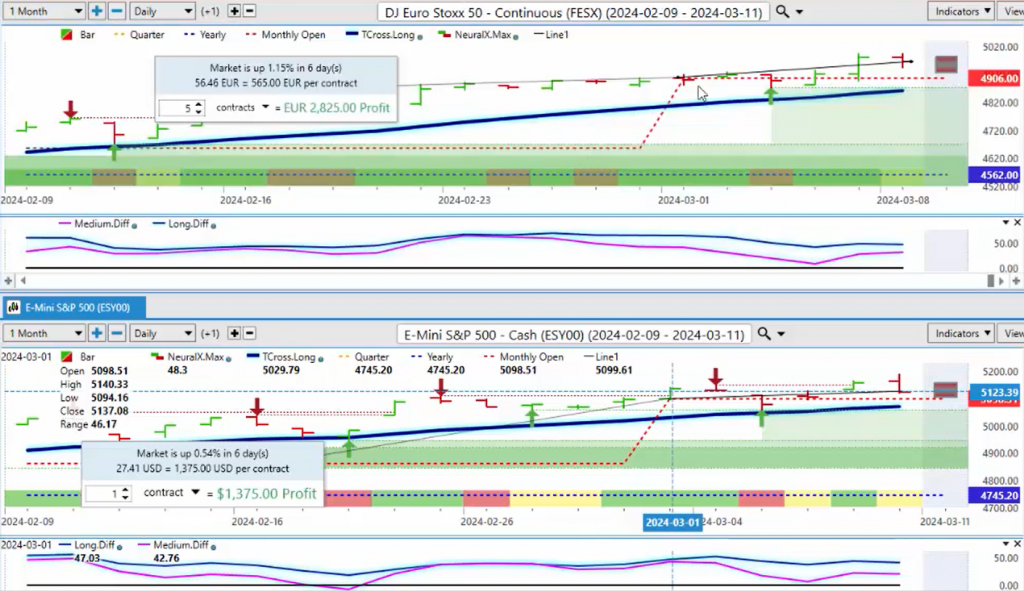
Now, when we look at the Dow Jones Euro Stoxx 50, again, firmly above its yearly opening price, its monthly, and our T-cross long, we’ve got 1.15%. So, the Dow Jones Euro Stoxx 50 outperforming the DAX, outperforming the CAC 40 and the S&P 500. And this is what we look for here is to see where the strength is on the global markets.
Nikkei 225
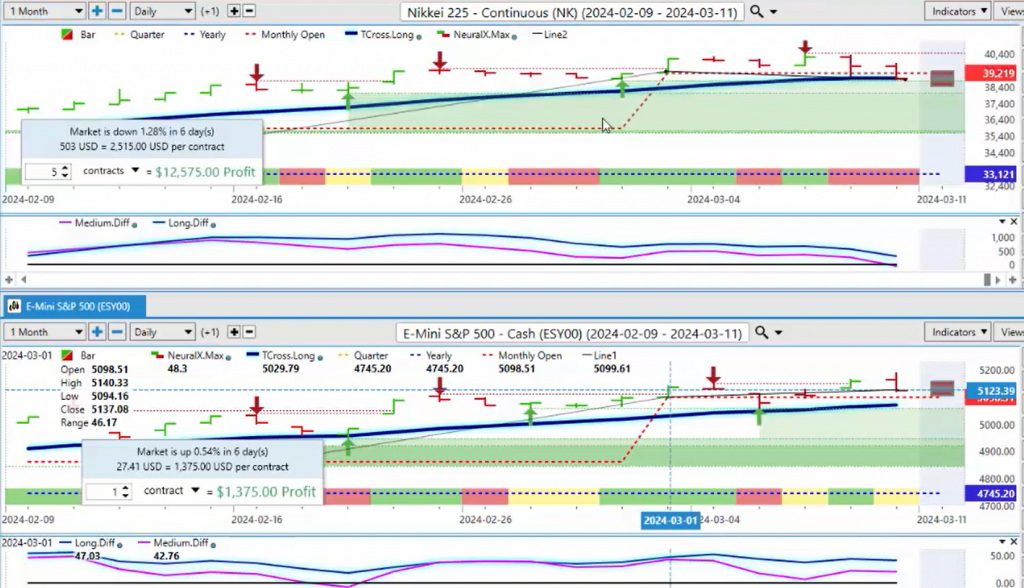
Now again, when I’m looking through these, the Nikkei 225 is actually down 1.28%. This is coming directly in my respectful opinion from the carry trade starting to come unwound. If the market believes the FED is going to cut sooner and more, then they’re starting to get out of that long dollar Yen trade, which is strengthening; it’s causing weakness in the Nikkei, the stronger yen, the weaker Nikkei. Very similar in the US, the stronger dollar, the weaker the S&P and the indexes. But right now, there’s a rationale based around in market correlations why this is happening.
Now, the Nikkei is basically stopped two days in a row right on our T-cross long at 38917. We need to hold above this, and we need that yen weakening, which we may get next week. So, there could be a buying opportunity here on the Nikkei, but I also believe the Bank of Japan could intervene at any time.
Dow Jones Industrial Average
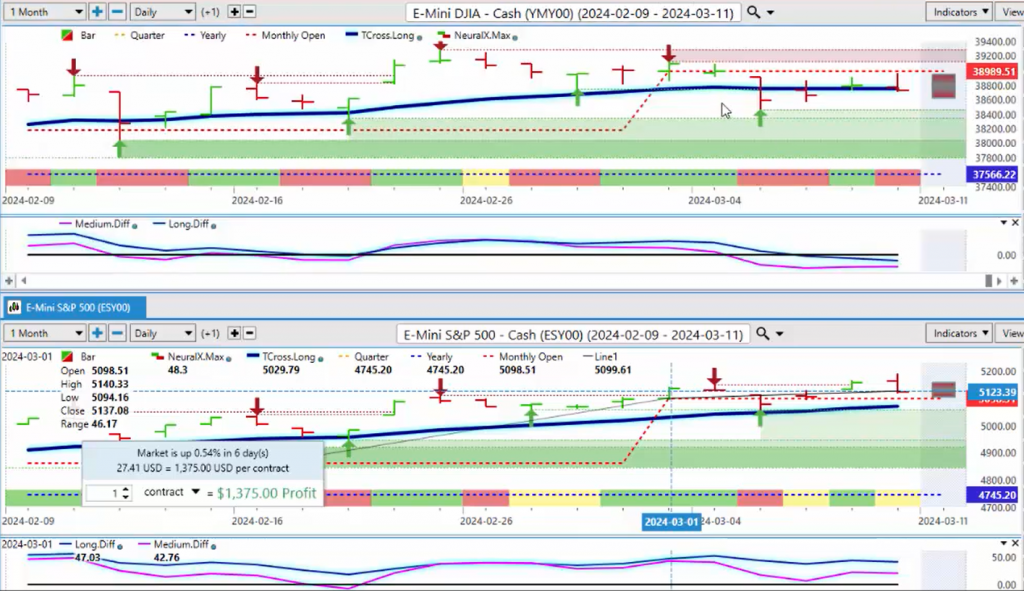
Now, when we look at the Dow Jones, you can see the Dow Jones here. I’ll just bring that up on the month so we can get an, again, an accurate view of what the real performance is in March. And we can’t get that if we drag that something that’s gone on back in, you know, January or February. So, the Dow is actually down 76%. So, the global equities in general all of a sudden don’t look that great anymore, do they? And this is one of the things we have to take into consideration here. But again, we’re holding above our Vantage Point T-cross long that’s coming in at 38,745, and we’re firmly above our yearly opening price.
Russell 2000
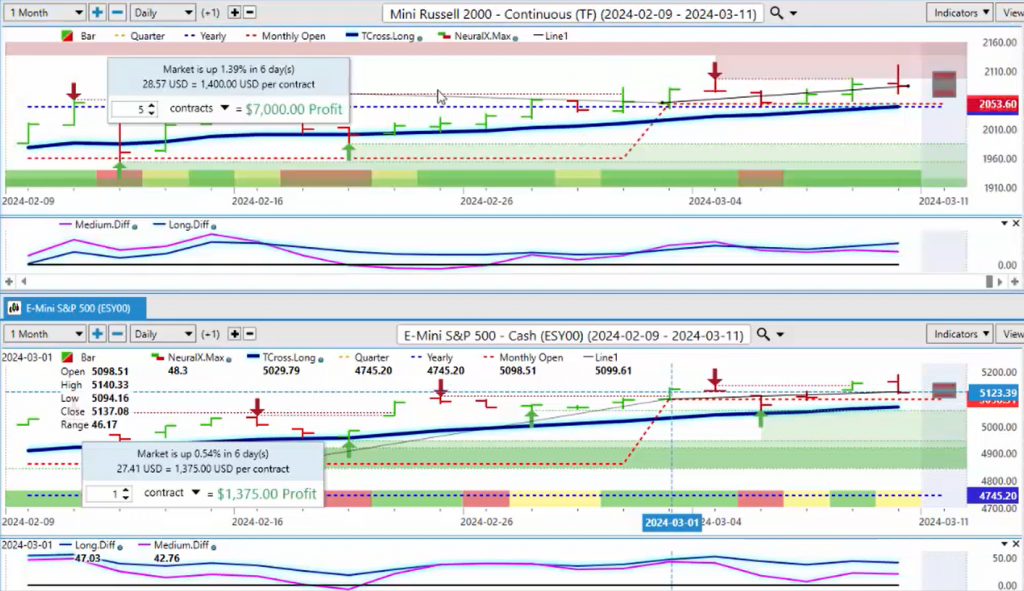
Now, the Russell and the NASDAQ, when we look at these, the Russell is actually performing quite well for the week, 1.39%. So, we’re firmly now on the Russell above our yearly opening price at 2048. We’re above our T-cross long at 2049. So, the Russell looks to be performing a little bit better than the Dow and the S&P 500. But we also want to do a comparative to the NASDAQ contracts. The NASDAQ, again, the market’s a little confused by this, but the NASDAQ is actually down 0.2% on the month. Again, this is factual performance, not a rolling performance model that is causing, I believe, is causing confusion as to what the real performance is. So, right now, we’re still above the yearly opening; we’re still above T-cross long. But the NASDAQ 2 is struggling a little bit up here, but I believe we should be able to hold, and the NASDAQ is one of the better indexes to be involved in.
Volatility Index ($VIX)
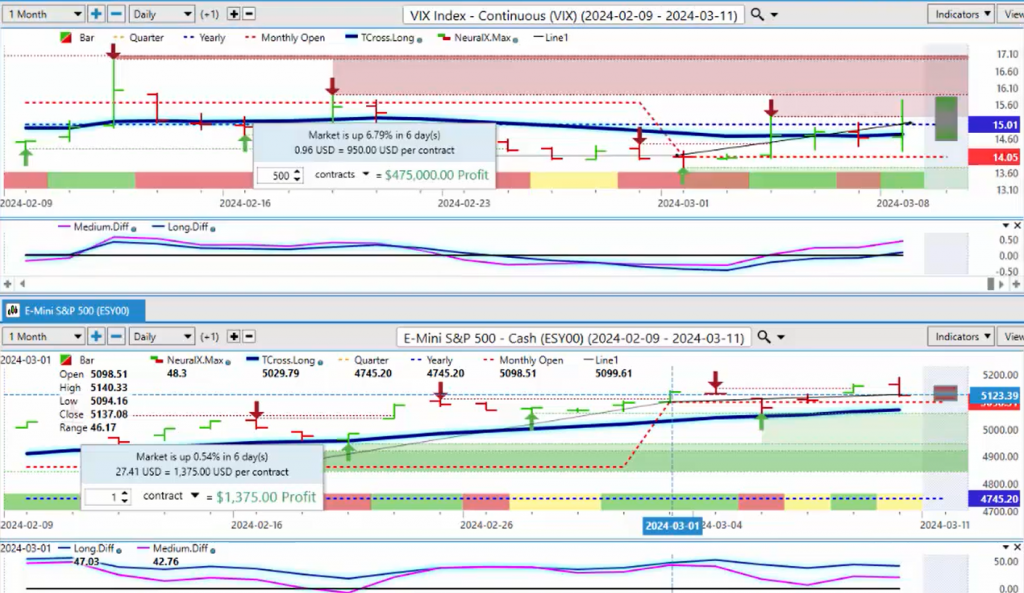
Now, when we do all of the looking at the global indexes, we do need to look at the VIX to see if it’s validated anything that we’ve just discussed here. And when we look at the VIX, we can see the VIX index in the month of March is actually up 6.79%. So, and we’re challenging the current yearly opening price on that VIX. So again, if we break above 1501 and stay above that, that is going to put pressure, in my respectful opinion, on the global equity markets. But again, if I move this anchor point to just say okay, 5 days or the last 30 days, then this would look completely different. It could actually make it look like it’s having a positive when in actual fact it’s not. So again, we’ve moved above our T-cross long; the we’ve closed at 1508; the yearly opening price is 1501. This is the first time we’ve closed above that yearly opening price in quite some time here, guys. You know, we’d have to go back into January and February to find that. But the main thing is we want to make sure we’re looking at that in actual fact. We did challenge it here back on March the 5th. So now we’re back up here again, and you can see how the market is using the current monthly opening price, not 30 days ago, guys. It has no relevance to anything. The current monthly opening price, the market is clearly buying the VIX off of that level, 1405. So for next week, first of all, we want to make sure we’re staying above 1405. But I think the bigger area that we need to keep an eye on is 151 because that would tell us that stocks are about ready to, if nothing else, start to move towards a corrective move lower across the global indexes, not just the US markets. And that’s what I think most miss.
Bitcoin
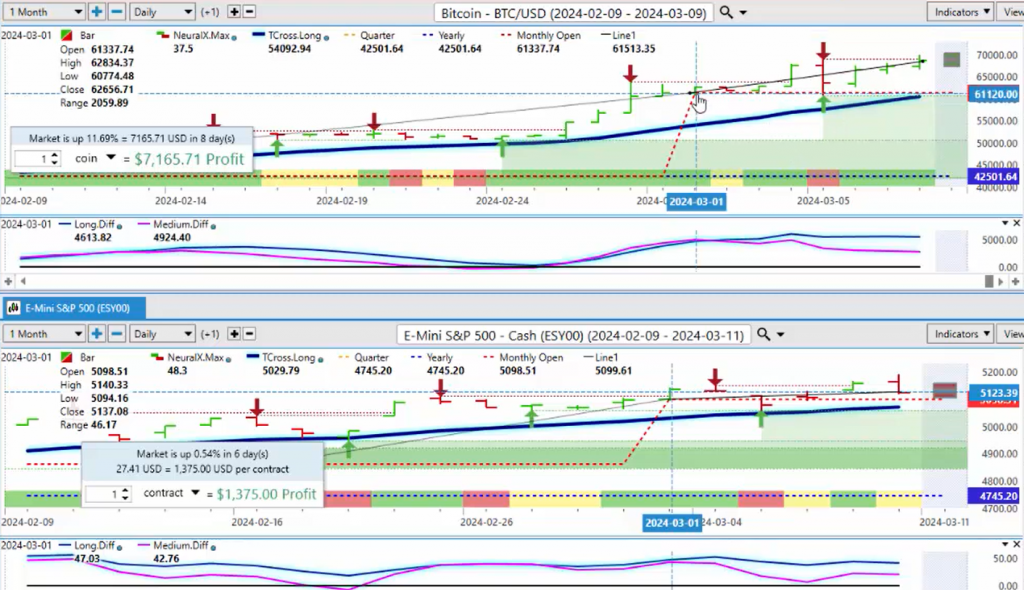
Now, when we do the also comparative analysis between the S&P 500 and Bitcoin once again here, guys, Bitcoin could is becoming its own asset class where it’s not as correlated to the equities what it was. It’s not as inversely correlated to Gold. But the performance on bitcoin just in the month of March currently is 11.69%. I believe it’s up over 50 80% on the year also. But the main thing is Bitcoin has been a strong buy going all the way back into October, and the S&P 500 strength and weakness is having very little effect on it. And once again this past week and we worked on this in the Vantage Point live training room using the T-cross long with the current monthly opening price. That monthly opening price is 61,337 was an another excellent buying opportunity on Tuesday of this past week because it’s not a coincidence that it stopped exactly on that number and moved higher. But the Vantage Point indicators, the yearly opening price, the T-cross long, the indicators still said we’re not turning; we’re not going into a trend reversal here. The minimum requirement we would need for a trend reversal is breaking down below the current T-cross long at 60,496 and breaking down below the current monthly opening price at 61,337. But again, if you move the goalpost by going with a random 30 days or a random 5 days of a rolling performance model, you wouldn’t see this and you would miss this opportunity which we did live in the VP live training room because again it’s a very important number. You can see that in the first 3 days of the month, the market Bitcoin just stayed right on that monthly opening and then ultimately broke higher, took a retracement lower back to its starting point and accelerated higher again. So leverage these levels, but if that T-cross long moves above the monthly opening price, I think we’re looking at 880,000 on bitcoin. So also keep this in mind.
Magna International ($MGA)
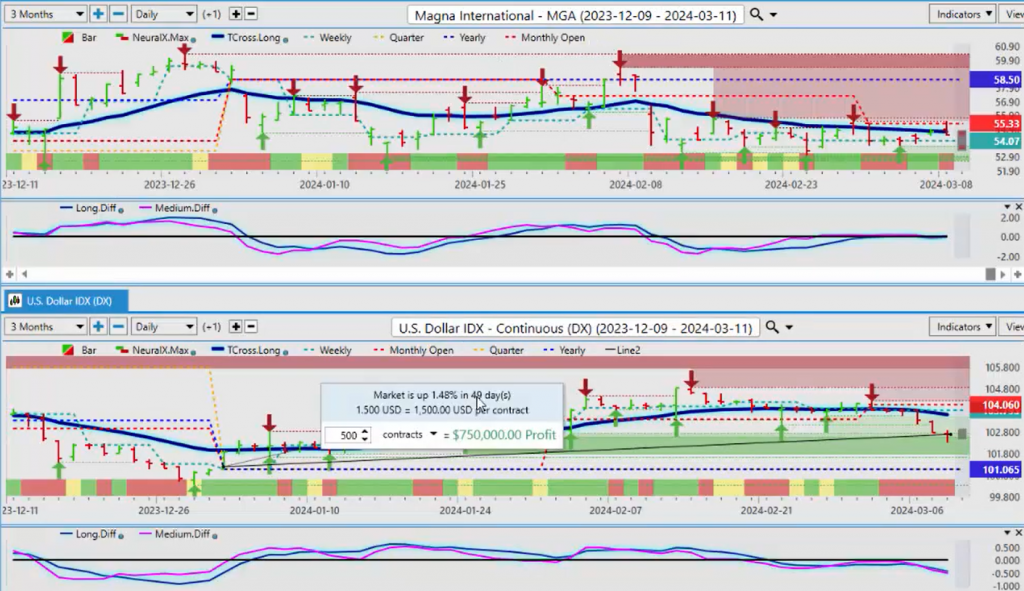
So now that we’ve had a complete look at all of these markets together, let’s now bring in a quick review of our main Forex pairs and see how the dollar is faring against them. Now, in this scenario, I’ll move over to a different portfolio where I can bring in my main US dollar correlations to our Forex pairs. Now, the MGA stock, this is a very interesting stock, and the only reason I look at it is because it has a 92.34% inverse correlation to the dollar. So, if the dollar is really as weak as what they’re trying to tell us, then this stock would be moving higher. And as you can see, it’s not. It’s struggling against the Vantage Point T-cross long, and it’s been negative on the entire month. This tells me it’s the dollar maybe is not as weak as what they’re telling me. So again, I look at our T-cross long, which is 103.55; we are below that, but that doesn’t mean the trend on the dollar has completely reversed because again, we’re up 1.48% on the dollar per year. The dollar has never been negative on the year. So, the term bullish bearish we have to take that with a bit of a grain of salt and bring in an accurate measurement point because quite frankly, I’m not overly concerned with what went on in 2021, 2022, 2023. I’m concerned on what’s happening in 2024 because that’s the current trading. So right now, the dollar remains positive on the year by 1.48%. That’s a factual statement because I did not look at random dates.
So Magna has not turned positive. So when we do our comparative analysis here, we want to look at things like gold.
Gold
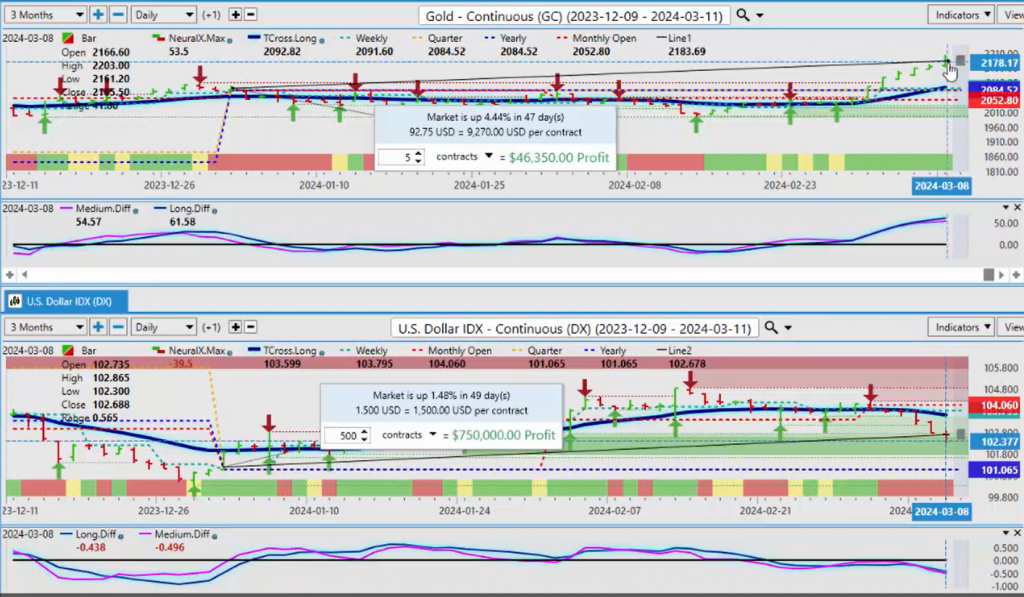
So gold, and again, I think there is a little bit of confusion as to what the real performance on gold here is. Gold has been negative to clarify the entire calendar year until just about a week ago. And even now, it’s only up 4.4%. So I believe there’s going to be significant headwinds up here around the 2200 mark, 2190, but we shall see. Right now, it remains bullish but maybe a little bit overextended. And just maybe that payroll number was leaked on Friday, the previous Friday, because we have seen this in years past. There was the incident at one of the government offices where one of the fund managers called in and said, ‘Oh, can you give me that payroll number from the previous month?’ And the secretary accidentally gave him the number for the current month, two days before it came out. That was only about five years ago. So I suspect maybe something’s a little bit off here. Our predicted differences on gold, they’re starting to separate, they’re showing potentially a little bit of weakness. But gold usually does fare very well between the end of March and mid-May. So it’s perfectly normal for gold to go up. Maybe this is just a little early. So we’ll see how this plays out. But this is not as wrong as what it appears to be. Again, I would be looking for that pink line, the predicted difference, to still be going higher. But gold again only broke above its current yearly opening price just a matter of seven or eight trading sessions ago. So all of the gains that gold has made are basically in the last week and a half, guys. Yes, we could look at it from down here and measurement down here, but it was still negative on the year.
So, our key support here, the T-cross long, is 2053, and our yearly at around 2084. I believe it’s a little lower than that. I’m going to say 2066, but in our software, 2084. We need to hold above that level.
Euro versus U.S. Dollar
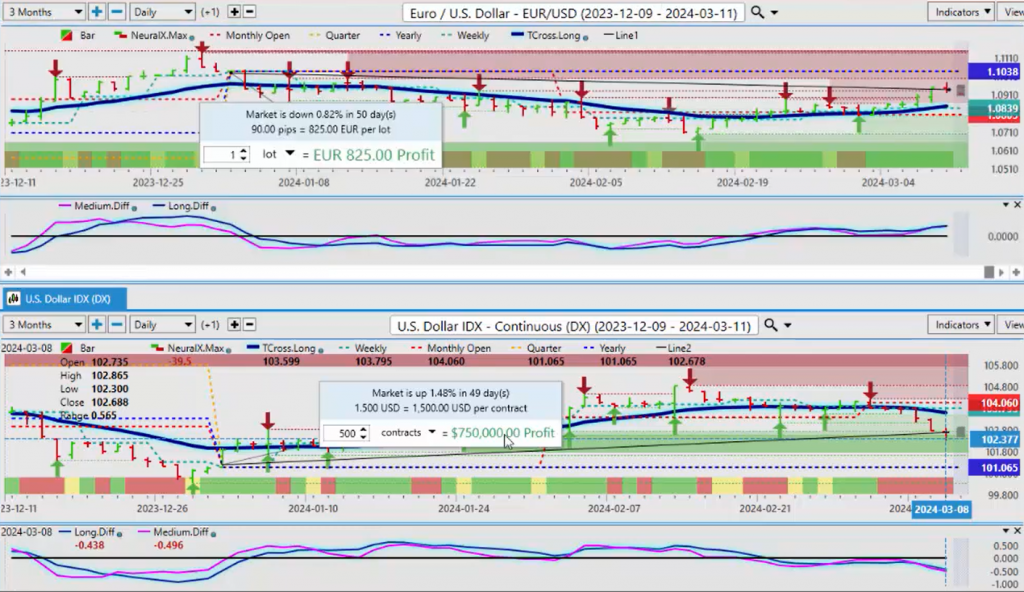
Now, when we look at our main Forex pairs, I’ll start with the main one, Euro. So there again, this is a very good retracement here, but I will point out the Euro is currently still down .82% on the year. It has never been positive in 2024. And that’s where using proper anchor points and performance measurement points comes into play because we can say, ‘Wait a minute, you’re saying the Euro is super bullish and it’s been a really good long trade in 2024.’ That’s one of the analysts said, and that’s actually not factual. It’s actually never made money against the US dollar in 2024 and still hasn’t. We would have to clear the yearly opening price at 1.1038. Now, we look pretty good; we’re coming off our T-cross long. But there’s, I would imagine, there is going to be an epic battle at 1.1038. So my job here is just to make you aware of two things: number one, the Euro has never been positive against the US dollar in 2024; selling on rallies has been the preferred strategy. Number two, I’m not convinced the dollar is completely down and out yet, and I believe the central banks may strike back next week and say, ‘No, we’re still higher for longer.’ So again, we’ll monitor this. Our T-cross long is coming in at 1.0849. That’s our major support level. But our major resistance right now is going to be right up here at 1.1038. Be very cautious around that particular level.
U.S. Dollar versus Swiss Franc
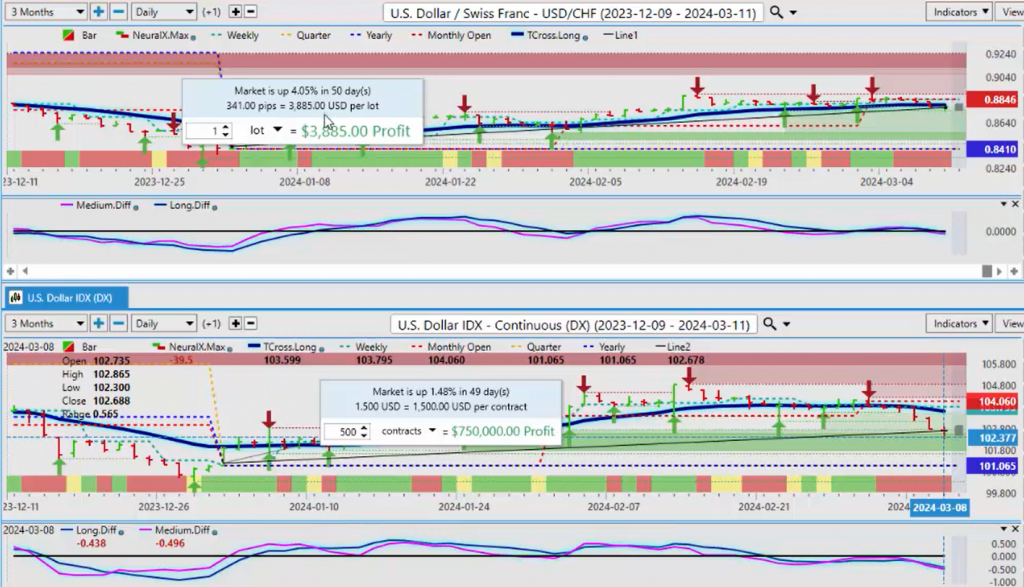
When we look at the US Swiss franc, again, the Swiss franc has been unable to make any gains against the US dollar, significant gains. Currently, it’s down 4.05%. I believe the Swiss franc will start making significant gains against the dollar as we get past the latter part of March. So, I believe we are going to start our corrective move lower. We’re below our monthly opening price, 0.8846. We’re now below our T-cross long here at 0.8796. But I think the dollar has just a little bit of life left in it because, as I’ve talked about in previous sessions, that dollar seasonal pattern is strong between mid-February and mid-March. So maybe a little bit more, but these indicators are suggesting we are going lower. And if we’re currently up, if we’re 4% guys off our yearly opening price, then that means we’ve got 4% of downside with short trades here. That’s a very attractive short even with the interest rate differential.
British Pound versus U.S. Dollar
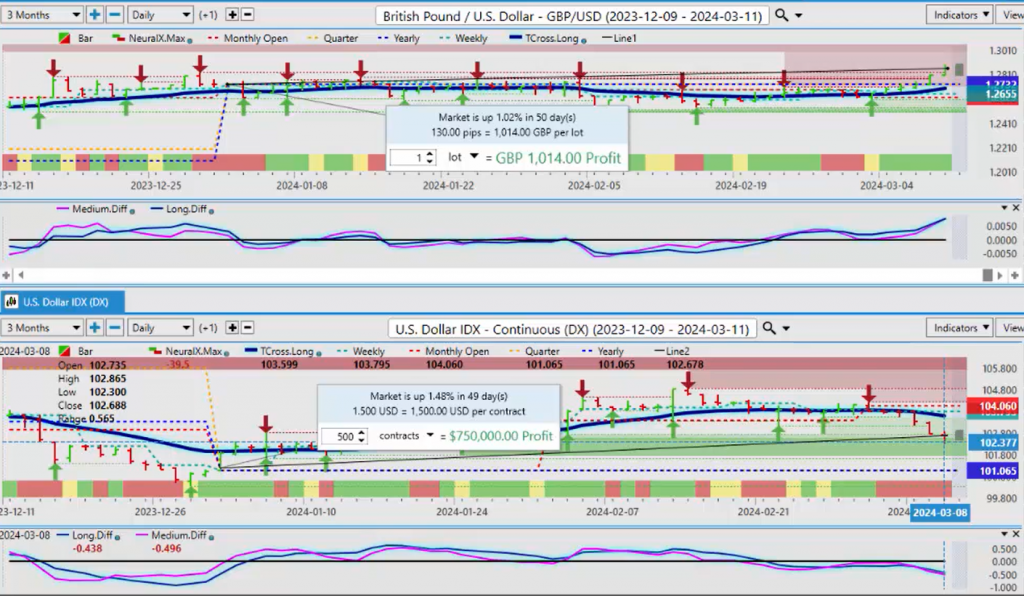
Now, when we look at the British pound, the British pound currently, from a factual standpoint in 2024, is the only currency that is up against the dollar because it’s positive on the year. You can’t say something is bullish when it’s negative on the year or it’s never made any money on the year, not that the British pound hasn’t tried, but you can see there’s been multiple failures at the current yearly opening price. So we’ve managed to clear this; we’re closing up around 1.2859. But this is a… the British pound has made strong gains. If you go back to what I discussed about the FTSE 100, that explains why the FTSE is one of the indexes that’s below its yearly opening because they’re not going into the FTSE; they’re going into the British pound. So the British pound, pretty easy to figure out. Our supports are T-cross long 1.2697, and more specifically, 1.2732. As long as we’re above this area, the British pound can extend higher. But we need to hold above that level. But again, pointing it out, that is the only currency that is actually making gains against the dollar based around that current yearly opening.
U.S. Dollar versus Japanese Yen
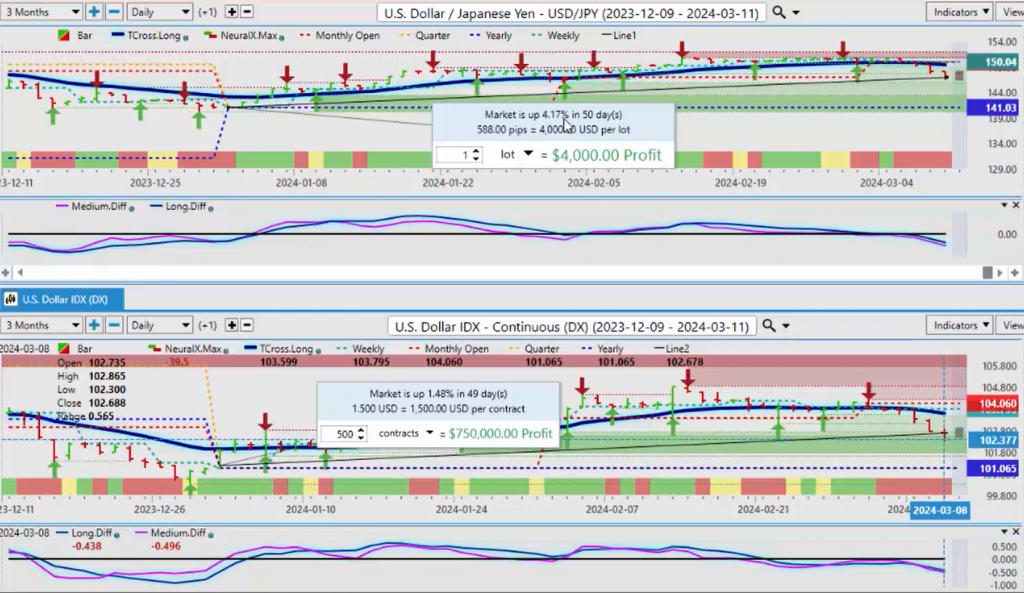
The dollar-yen remains… the dollar remains strong at 104.17. We can see a direct intermarket correlation here, guys, between the Swiss franc and the Japanese yen. If one falls, so does the other. So right now, the dollar is starting to… we’re starting with the first crack in the dam here is the British pound moving above its yearly opening price. We know we’re getting dollar weakness this year, guys. It’s just a timing issue. And it looks like we’re starting to extend lower here. Now, that monthly 149.98, our T-cross long, 149.44. As long as we’re holding below those two areas, then we’re likely going to start trying to make a run towards this 141 area. But I will point out again, the dollar is still positive against the yen.
U.S. Dollar versus Canadian Dollar
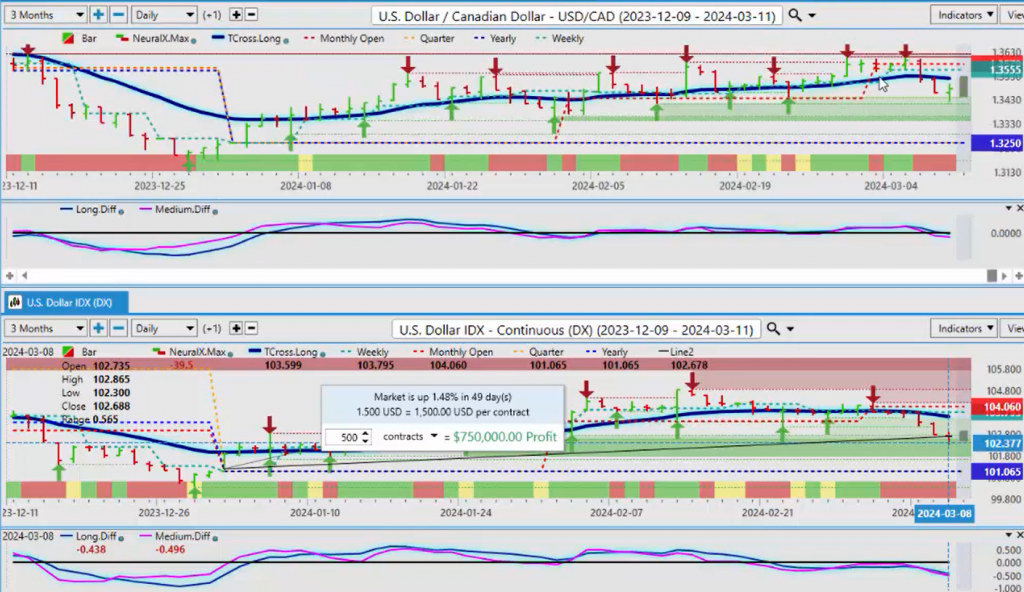
When we look at the US-Canadian pair, again, I think we forget that the Canadian dollar has not made any gains against the US dollar, despite this choppiness, the up and down, up and down, five days, 30-day rolling performance. Keep it simple, guys. When we look at this right now, the dollar is still doing well. If we measure it from the start of the year off the yearly opening price to where we are on Friday, once again, we can see the performance of the US dollar directly. And that performance is still up 1.65% against the Canadian dollar. Our T-cross long, 1.3519. That is our key level, along with our monthly opening at 1.3579. These areas here provide you with specific selling opportunities or if you’re a buyer, we need to get above these levels in order for this to extend, which I think will be difficult at this particular time.
But the main thing is, to this point in the presentation, we’ve only seen one currency that’s actually made… is positive on the year if you bought it against the US dollar, and that is the British pound.
Australian Dollar versus U.S. Dollar
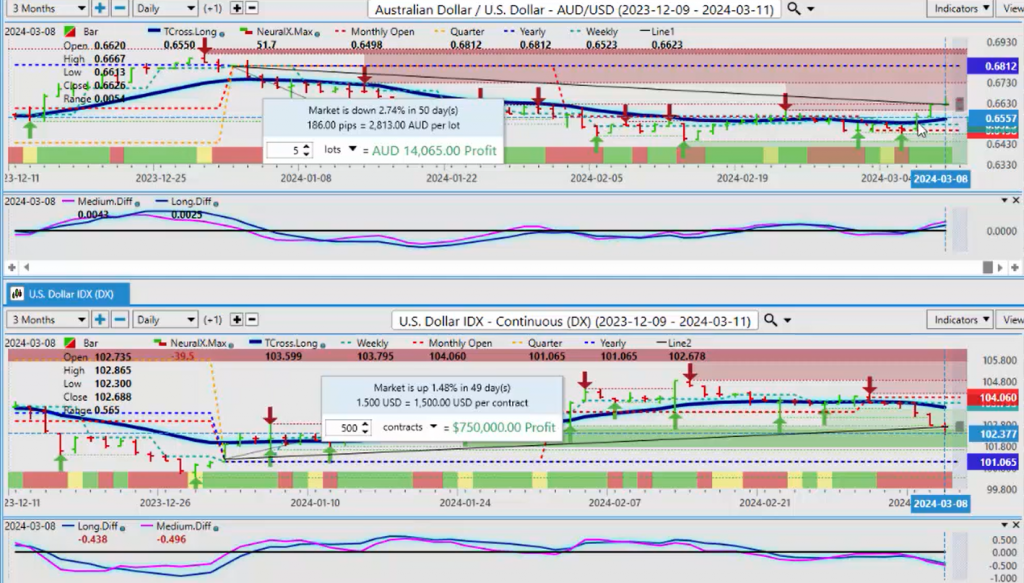
If we look at the Kiwi and the Aussie, we see something very similar here. We’re down 2.74%. Yes, the Aussie is coming off strong off its monthly opening price, and yes, we have crossed over our T-cross long. So we use those levels below there for buying opportunities in anticipation of dollar weakness. But again, I need to point this out: the Aussie has not made… has not been able to make any positive gains against the dollar above that yearly opening price, which makes the Aussie one of the weakest currencies in 2024, along with all of the other ones I’ve mentioned.
New Zealand Dollar versus U.S. Dollar
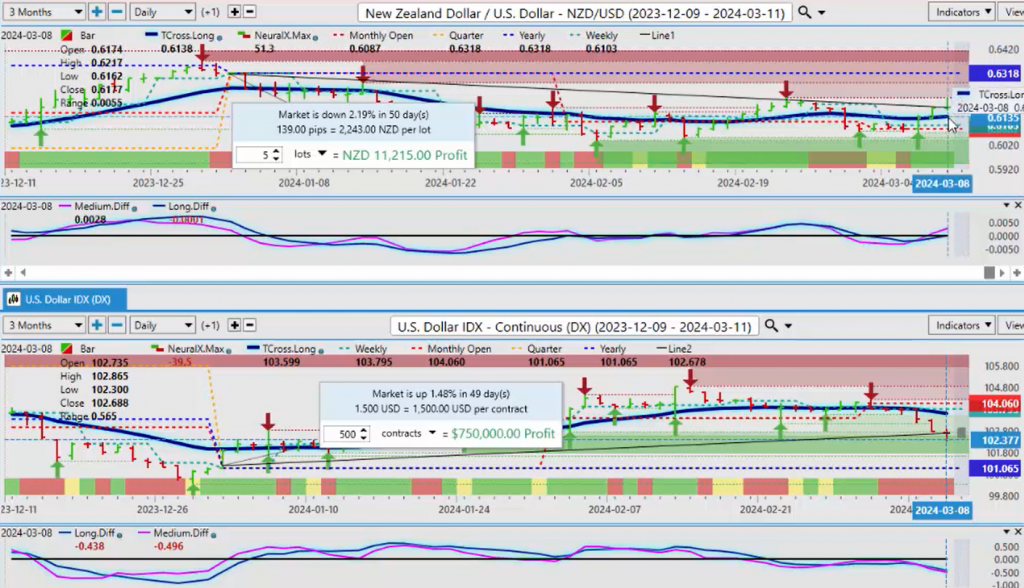
When we look at the Kiwi, we see the same thing. It’s down 2.19% from the… this in the… in the… in the… 2024 calendar trading year. It’s very important that we understand that so we can gauge where we’re at. The yearly opening here, 0.6318, and yes, we’ve closed above our T-cross long. And if we connect the dots between this and the seasonal pattern of dollar strength ending by mid-March, then there is opportunity throughout these markets, throughout all of these particular markets because, again, nothing goes straight up and nothing goes straight down. And with that, we’ll always have opportunity. So, with that said, this is the Vantage Point AI Market Outlook for the week of March the 11th, 2024.