


Welcome to the Artificial Intelligence Outlook for Forex trading.
VIDEO TRANSCRIPT
Hello everyone, and welcome back. My name is Greg Firman, and this is the Vantage Point AI Market Outlook for the week of March 25th, 2024. Now, to get started this week, we’ll begin with the equity markets.
S&P 500 Index
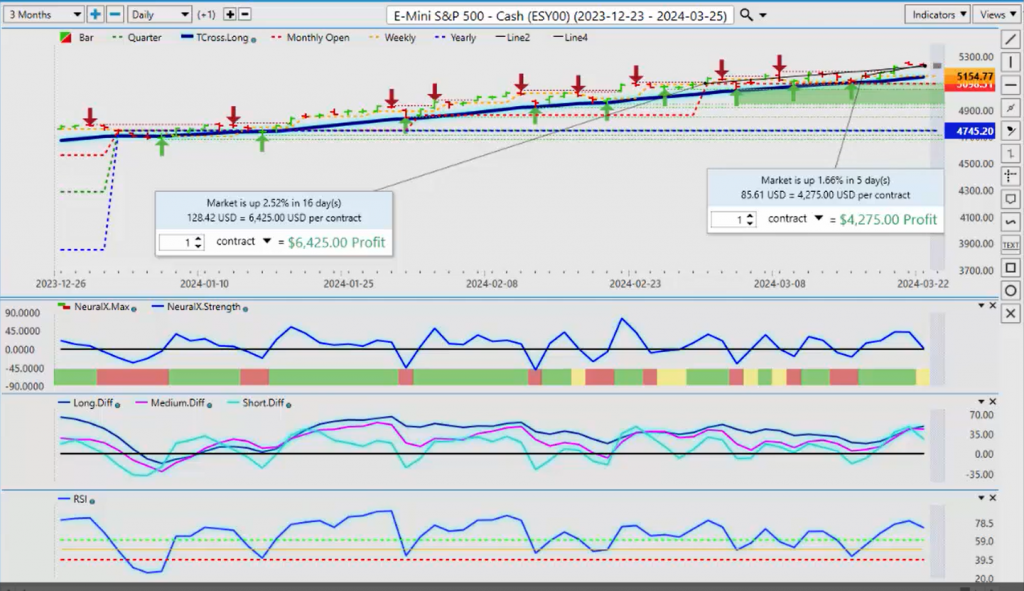
We’ll look at both the S&P 500 and the DAX 30 on the European side. Very, very similar moves here. What we can see for the last five trading days: we’re only up a mere 1.66% and a mere 2.5% on the month of March as we go into a period of known dollar strength at the beginning of the month. Now, the indicators here in Vantage Point are starting to turn over. We have a medium-term crossover diff cross, which means the move to the upside is weakening. Now, it doesn’t necessarily mean it’s completely reversing, but it does point to some weakness coming in the stock market. That’s something we want to look at. So, our T Cross Long 5148—that is the area we are likely going to test. If we look at our long predicted on Vantage Point, that number is coming in at 5205, so we have a lot of support down around this particular area. The indicators are neural index strength, and the neural index are turning down, as the predicted Predicted RSI, but the MA Diff Cross is the one we want to keep our eye on. That basically is saying the medium-term trend is weakening against the longer-term trend.
DAX 30
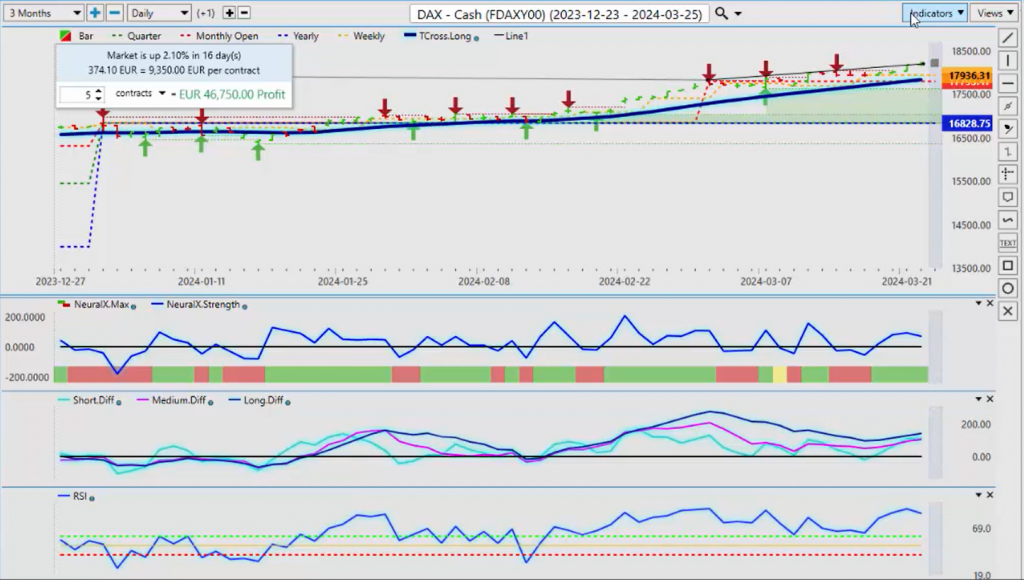
When we do a comparative to the DAX 30, we see something very similar. Now, the DAX—it’s up, uh, again, it’s not having a bad month at all. Uh, again, we’re up at about 2.1%, so basically the same as the S&P 500. Both indexes looking a little bit toppy up here, a little bit of a corrective move, but looking at those, uh, those, uh, moving average difference crosses, this one, the DAX, is actually showing a little more strength than the S&P 500.
Volatility Index ($VIX)
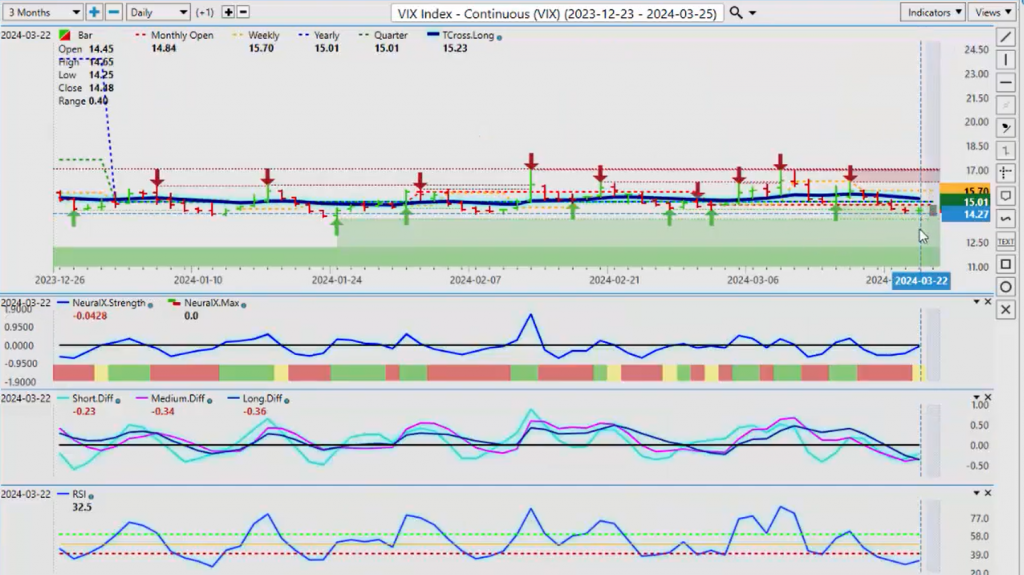
So, to look further into that, we look at the VIX. Now, the VIX here has a clear buy signal forming. If that pink line crosses over this blue line to the upside, that is a warning sign. The VIX is going higher, meaning volatility is coming in, and the probability is stocks are going to pull back a little bit. So, always look—we never want to look at any one market in isolation.
We want to look how other markets will drive the core market that we’re trading. Very, very important. So, while things may look great in Rosie on the S&P and the DAX, the VIX still warns us that there’s a period of high volatility.
U.S. Dollar Index ($DXY)
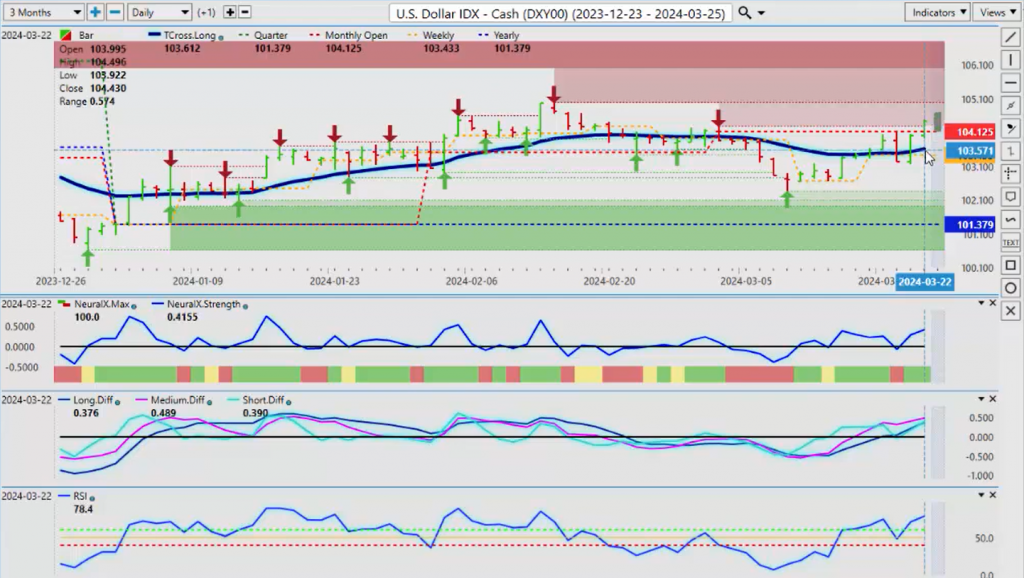
So, when we do that comparative to the Dollar Index, now the dollar has struggled this entire month. Once again, very, very important that we’re using proper anchor points. We don’t want to use just a random one-month performance or a random 5 days. We want to anchor this down to the start of the month and the start of the calendar year. Now, as I talked about last week, mainly the dollar starts to lose ground by the end of March, be mid-April, early April. So, I’m still looking for some weakness, but in my respectful opinion, there was, uh, there wasn’t anything dovish in that statement from the FED on Wednesday. The stock market reacted by going higher, as did gold, as did Bitcoin, but the very next day, they had all exited those trades because when you look closer at that fed statement, well, that’s not as dovish as one might think. You’re looking at the end of the year, 4.6% on the interest rate. The Fed was talking about five cuts; now, he’s talking about three. So, again, uh, and some of that data is coming in a little bit hotter. I would argue some of that data is very manipulated, uh, or distorted at this particular time. And let’s not forget that this week in March was the infamous COVID lockdowns, the emergency rate cuts, all of those things. So, March will be a very volatile month in these coming years. Uh, but again, when we look at this, the Dollar has cleared its monthly opening price, 104.12. That immediately has pushed Gold back down, and you can see how a false signal could be formed in those equity markets because, again, when that fed statement comes out, it’s thin illiquid markets on a Wednesday afternoon. By the time the Thursday markets had opened, everything had reversed because they have to rethink some of those comments from the FED, which, again, in my opinion, were more on the hawkish side than dovish. So, the Dollar has reacted; rates move up. Again, the monthly opening price here, 104.12, we need to stay above that, and we need to stay above our Vantage Point T Cross Long at 103.61. That will be our support for this coming week, but the indicators remain bullish. And I will further point out here on the Predicted RSI, you can see that we hit the 50 level here, and we did not break down below 40. There was never any real downside momentum this past in the Dollar, just corrective moves, position adjustments ahead of the FED.
It’s a common event that normally happens, but for now, the Dollar does remain bullish, but I will warn everybody that in most cases, the Dollar is running out of steam. Shortly after the dollar rally at the beginning of April, that’s probably it for a little while anyway.
Gold
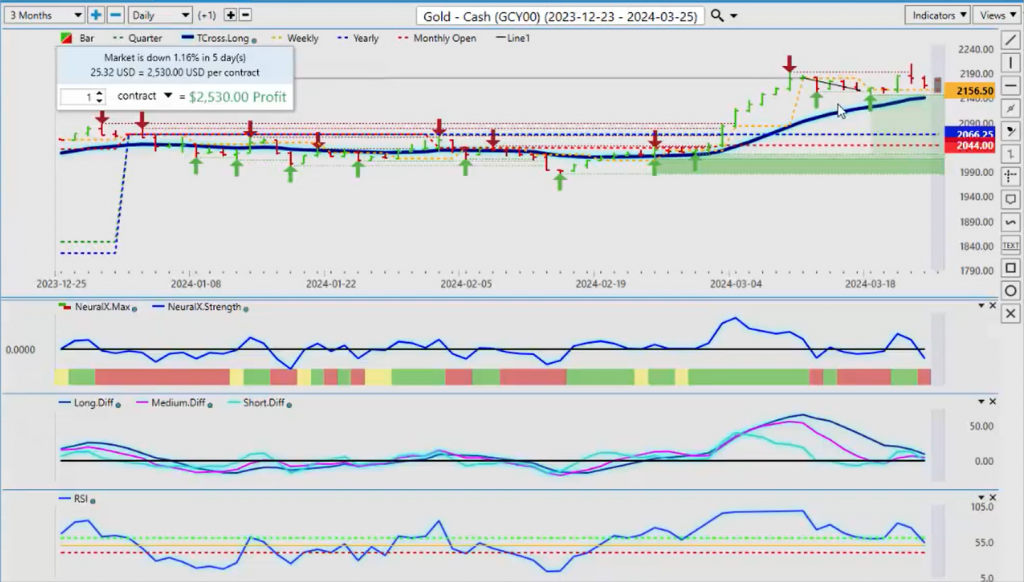
Now, when we look at Gold prices here, once again, you can see that false breakout to the upside that tended to catch a few traders. Now, Gold’s not necessarily done, but in my respectful opinion, it’s going to struggle up here. These indicators are all pointing down to start the week, and we’ve hit all-time highs, but I will further point out we have a verified resistance high at 2193 that was formed at the beginning of the month, and we only very briefly went above that. So, we’ll watch our T Cross Long very closely, 2140. If we click on F8 on our software, you can see that we’re losing that long predicted level here; that’s 2170. So again, it does look imminent that Gold is going to move lower on further Dollar strength next week.
Bitcoin
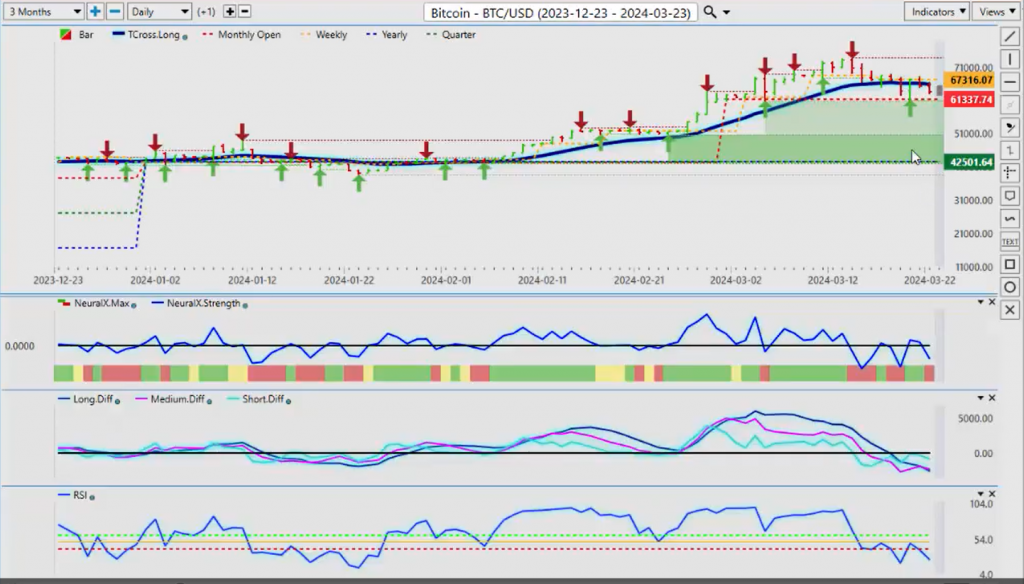
Now, when we do a comparative to Bitcoin, Bitcoin holding it up very, very well. We’ve come down, hit our monthly opening price, and once again here, guys, to evidence why we should be using proper anchor points. If I said to you, “Well, the one-month performance is XYZ,” well, where are we measuring that from? 30 days from today over to here? No, we always measure from the beginning of the month, so we know what the true performance is, and we can use that monthly anchor point as exactly that, an anchor point. You can see that Bitcoin came down, hit that monthly opening price—that’s basically invisible support that most never see—then, as you can see, coming off of this, we had a nice little rally off of that bottom where we shot up within 24 hours. Using that current monthly opening price, we had a 10%, almost an 11%, rally in a matter of hours, but the average person may not even see this because they’re looking at that lagging, rolling performance model. Moving our anchor points around, guys, will not, in most cases, benefit us. So again, we’ll watch this monthly opening price. If we lose that particular level, then yes, we could see further downside, but ultimately, my view is Bitcoin goes higher this year, once we get done with a corrective move, and that’s all it is, guys.
42501, the yearly opening price, Bitcoin has barely been below that level for more than a few days at a time, and we’ve had a huge rally. So again, buying on a pullback remains the preferred strategy.
Light Sweet Crude ($CL)
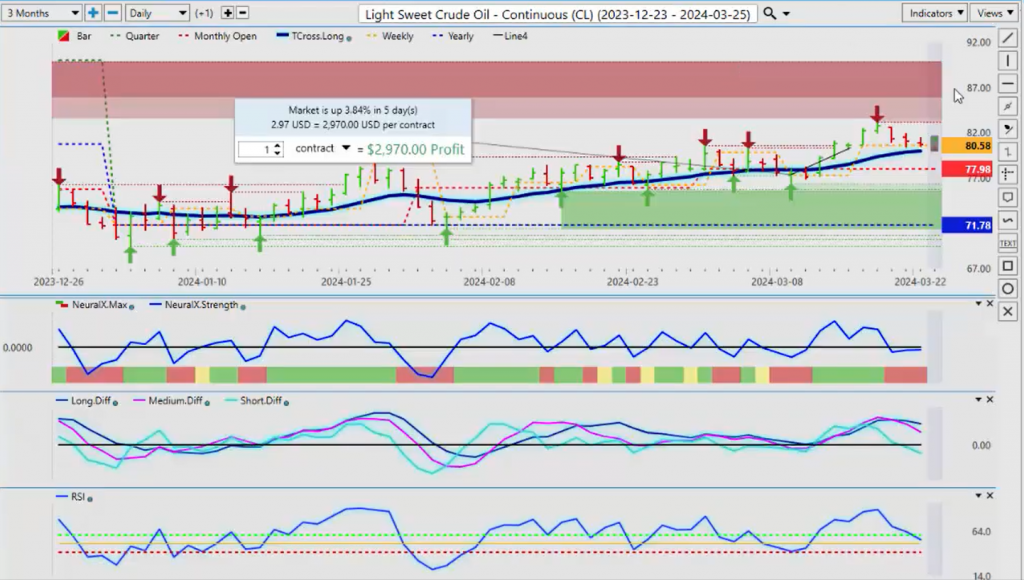
When we look at Light Sweet Crude Oil going into next week, once again here, you can see that oil is beginning to struggle. Now, we’re stalling out on our T Cross Long 992. That’s the key level we want to watch, with the current monthly opening price, 77.98. My view is that if the Dollar continues to advance, Oil could hold its ground here, but the indicators are definitely bearish. You can see we’ve got an MA Diff Cross that occurred back here on Wednesday. That immediately triggered us to warn us that Oil is going to move lower, but the uptrend in Oil has not changed here.
This is where people get confused with rolling performance, moving around performance models. They’re already saying that oil is bearish. Well, no. 77.98, 71.78 were firmly positive on the month, and we’re positive on the year. The indicators are mixed here, but we don’t, we’re not showing a lot of downward momentum at this particular time, and it’s very, very important to point that out. What is, when do we get short on this? Or are we looking to buy in a dip? In my respectful opinion, oil is going to rally either way come late April and into May, June, and July. So, any pullback should be used as a buying opportunity, providing we’re holding above 71.78, the yearly opening price.
Euro versus U.S. Dollar
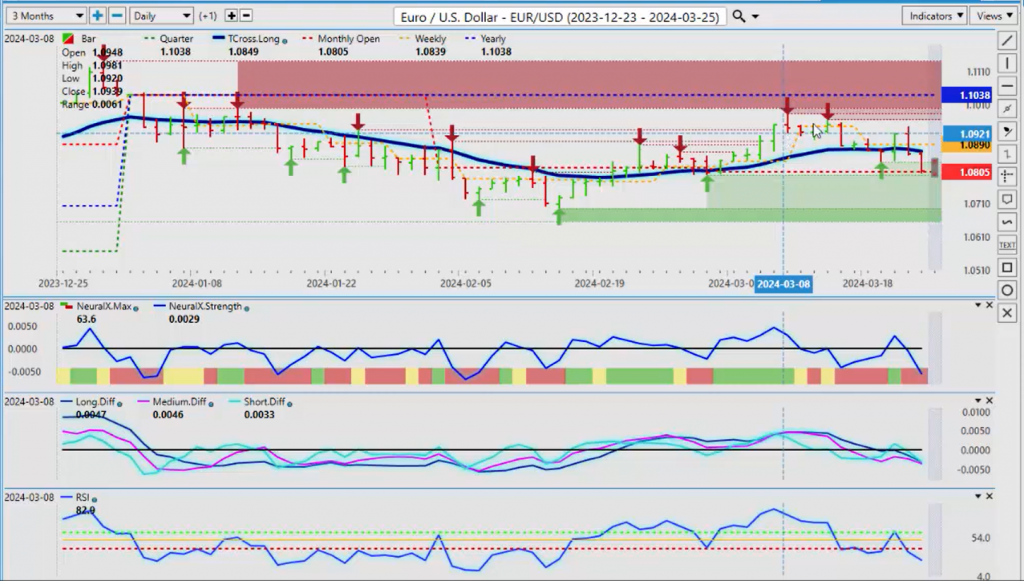
Now, when we look at some of our Forex pairs going into next week, the dollar again remains king. You can see that we’ve approached the current yearly opening price, 110.38. The euro will officially turn bullish when we turn positive on the year. It doesn’t, there, it’s an indisputable fact that if you bought the euro-US on January 1, you have consistently been down money. So again, we want to see this thing turn positive. Now, one thing I can say is we’re stalling on the current monthly opening price, 108.05. This is an area we’re going to watch for all of next week because, again, this is an outlook, not a recap of something that’s already happened. So, 108.05 is our key level that we need to hold above. If we’re still below this level by mid to late day Tuesday, then chances are the euro is going to start working its way towards our lower verified support zone, coming in around the 107 area. That right now, that move appears imminent. However, we must break down below the current monthly opening price at 108.05. But, knowing that we’re likely going to see some dollar strength right at the beginning of April, be careful of that Monday-Tuesday reversal. If we see a big move up on Monday, chances are it’s a fake price, and we go down on Tuesday.
U.S. Dollar versus Swiss Franc
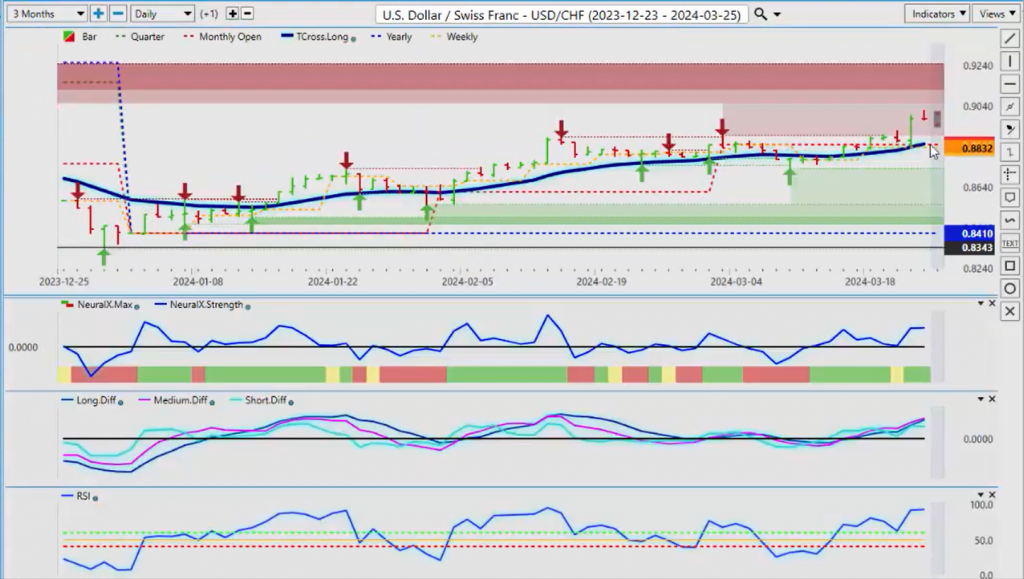
Now, the Swiss franc, once again, the central banks continue to confuse all of us—traders, analysts, economists alike. They decided to cut rates, first central bank to do it this week, and that came really out of nowhere. Here, so obviously, that is causing some short-term weakness in the Swiss franc, but in most cases, they buy the rumor and sell the fact. So, if that’s the case, then we should see the Swiss franc recoup some of those losses. But, as long as the Fed remains hawkish, then the Swiss franc could remain under pressure. But, the structural bias of this market, yearly opening price, 84.10, our monthly opening price, 88.46, and again, the quarter, 84.10. So, we’re going to see in our T-cross long at 88.52, so I expect we’re going to see some kind of retracement back to this particular level, but it may not be in this coming week. It may be a week or two out as the market digests what the Fed’s next move is and where’s the Central, the Swiss National Bank going with their interest rates, because that will have a large bearing on which way things go.
But this pair is highly correlated to the dollar index. If it advances, then this pair will also.
British Pound versus U.S. Dollar
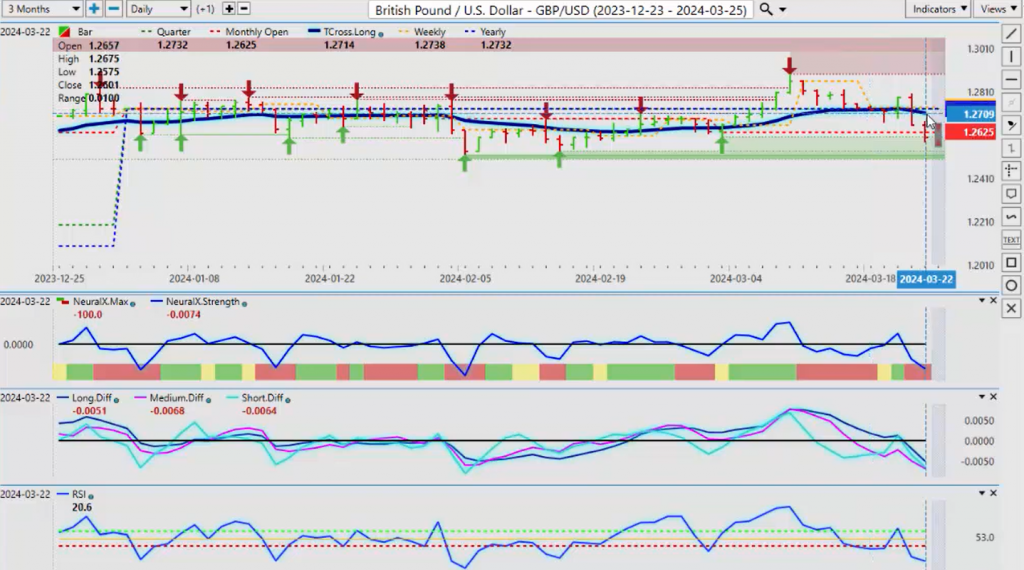
Now, the British pound-US dollar, once again, trying desperately to hold up against its current yearly opening price. We retraced back to it here, and then we’ve given up on Friday once the market actually realized that, well, wait a minute, that Fed wasn’t actually dovish; he was a little more hawkish. And again, that’s a raging debate right now. But I know what he said in December, and I know what he said on Wednesday, and those two statements actually don’t match. Again, the main one that caught my attention is where he’s going to be at year-end with three cuts is still 4.6%. So, the dollar’s not necessarily done, even though we most of us assumed that it was, that we were going to get into five or six rate cuts, economy was going to slow. So, he’s saying something else now. So, we’ll see. But the indicators remain bearish on this pair, but we are also going to be coming into a very strong verified support low around this 125.19 level. Watch that area for potentially picking up longs because right now, I would respectfully submit we’re just trading in a channel. That high coming in at about 129 and that low coming in just around the one, just above the 125 mark. Indicators are bearish, but watch for a potential long trade down at that particular area.
U.S. Dollar versus Japanese Yen
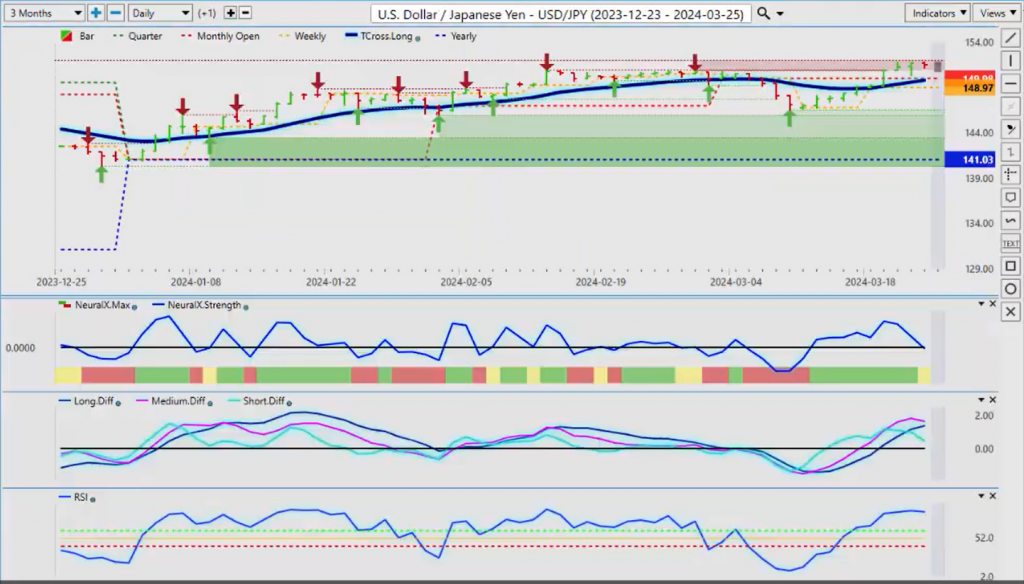
Now, when we look at the dollar yen, when we talk about these central banks continually shooting themselves in the foot, here now they’ve moved away, they’ve hiked, and the market didn’t like it, and they’re punishing the Bank of Japan and the Japanese yen currency. So, the yen carry trade well appears to be back on. But I would respectfully also submit that we have some very significant resistance up here that we want to be careful of. So, that resistance is coming in just a hair under the 152 area. I believe the Bank of Japan, as I’ve talked about almost every week on here, is going to pull another stunt of some kind. I think this one is again they’re shooting themselves in the foot, but be careful of this pair, or anything that’s got the Japan in it—Euro Japan, CAD Japan, all these pairs. Be very, very cautious because, quite frankly, I don’t think the Bank of Japan knows what they’re doing. And the next, my next guess on this is they’re going to try verbal intervention again because again, it’s rapidly approaching this 152 level, and that’s where they were intervening before. They managed to take it back down, but not far enough, and this was a period here. I would also respectfully submit that this was a period that we discussed in these outlooks, a known period of dollar weakness, and it fell.
But the rest of the year, the dollar-yen was climbing, so this could be repeating last year’s move, as you can see. So again, I’ll be watching this one very closely, but I don’t think the Bank of Japan is going to allow this to rise much further. So, be careful Sunday night with pairs like this.
U.S. Dollar versus Canadian Dollar
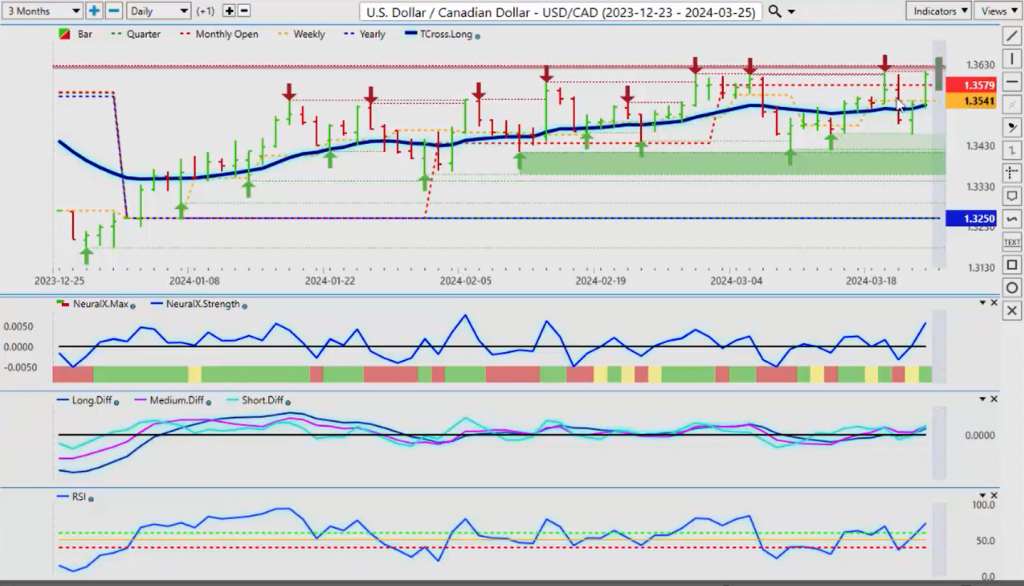
The US-Canadian pair, once again, the Canadian—the data coming out of Canada, the inflation is softening. I think the Bank of Canada will be the next bank to cut rates, so it’s keeping the pressure on that Canadian dollar. Non-confidence vote here, trying desperately to get rid of Trudeau; they didn’t, but either way, there’s an election next year, and I don’t see any really big recovery in the Canadian dollar until after that election, and these carbon taxes dealt with once and for all.
But very significant resistance up at these particular highs. When we come back and we look from a year ago, we can really see the resistance in the Vantage Point software, 1.3619—a lot of resistance building into that. So if we break 1.3619, that could open the door to a move higher towards 1.38, until we get into that period of known seasonal in oil contracts, which we’re about a month away from. That always tends to help the Canadian dollar, but the most recent higher prices in oil have not helped the Canadian dollar. Strong stock market has not helped the Canadian dollar. It does speak volumes to the political environment in Canada, that the global investors are staying away from Canada because of all this turmoil and these taxes, and it’s not business-friendly. So, there are a lot of things going on there right now that are not in anybody’s control here in Canada, other than the administration, but that is going to change, probably, either way, in 2025. So for now, we’ll get through 2024. Watch this level very, very closely because, as you can see, the next zone would be all the way up at about 1.3765, and that appears imminent. Looking right now, looking at these Vantage Point indicators that are starting to turn bullish on this pair, we’ve got a break of the predicted RSI; predicted differences have reversed; they’re going higher. We’re firmly above our T-cross long, and that key level is 1.3529. So, we’re looking to hold above 1.3529, which I think we’ll retrace to, potentially, on Monday. Then, we’re looking for a potential break of 1.3615, because again, this is an outlook, guys, not a recap of something that’s already happened. We want tradable strategies before we start trading, not after.
Australian Dollar versus U.S. Dollar
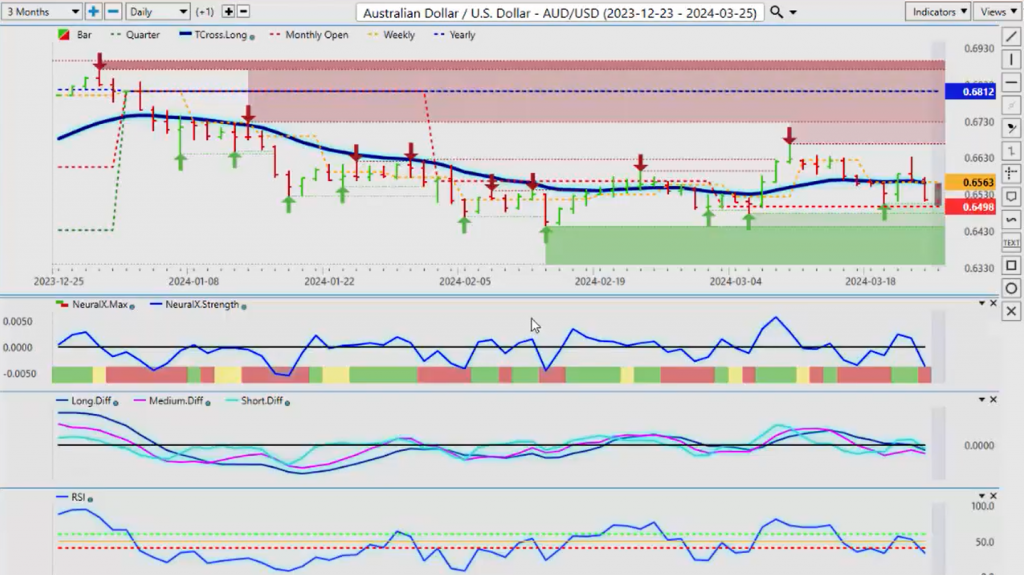
Right now, when we look at the Aussie-US pair, the Aussie and the Kiwi both have been under significant pressure since last year. We had a mild recovery on the Aussie, but as I had discussed last week, and the week before, 0.6812, the Aussie is one of the weakest currencies in the market. Now, we are holding above the current monthly opening price, $0.6498, but these indicators are saying further downside. But I would respectfully submit, again, right around this 0.65 mark is where we want to keep an eye out here, and then we either way think that this support low at 0.6443 is going to hold. So, counter-trend longs can’t be ruled out, but I would likely wait until Wednesday or Thursday of this week before attempting that.
New Zealand Dollar versus U.S. Dollar
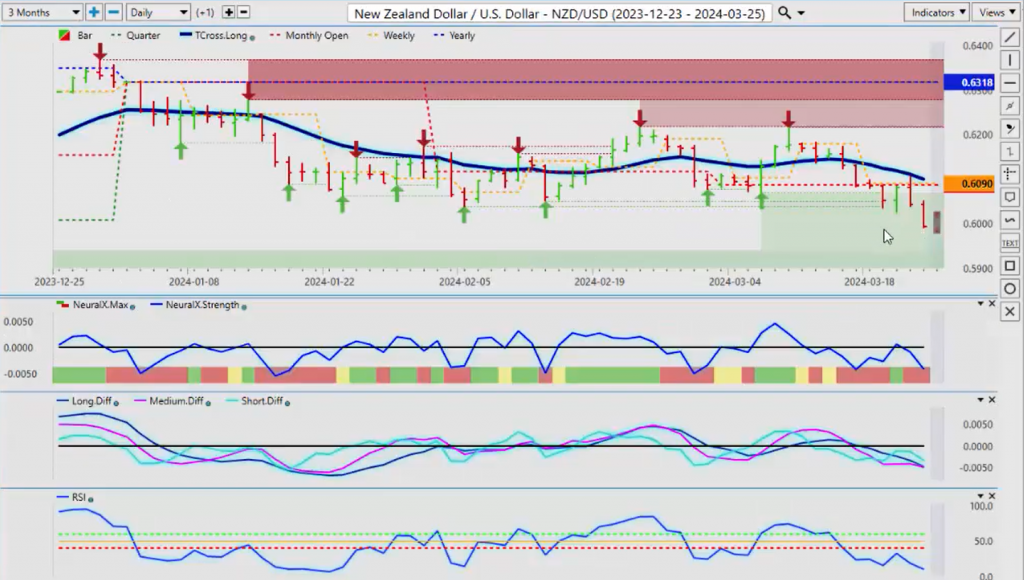
And the same thing would apply to the Kiwi, but the Kiwi doesn’t have any real verified supports down here. If I come back, I would have to come back more than a few years to get when the Kiwi has been this low. So as I can see right now, we’ve broken these levels right now. I can’t rule out the possibility of moving down into this particular low around the 0.5941, but I think it would take more of a catalyst to get us down here because again, that low, and we’ve got an additional low over here. Again, it’s going to be well, never say never, because as you can see, we made a high on this in 2023, then we made a lower high later on in 2023, and now this is where we’re at. So if we’re going to reverse, then I would probably be looking at somewhere down in this 0.5890 mark here, 0.5870 area, but I don’t think we’re going to be able to get all the way down here to the November low.
So we will have a busy week next week, again with the economic data, and I believe the Fed is speaking again next Friday, and that is sure to cause additional volatility. So, with that said, this is the Vantage Point AI Market Outlook for the week of March the 25th, 2024.


