


Welcome to the Artificial Intelligence Outlook for Forex trading.
VIDEO TRANSCRIPT
Okay, hello everyone. Welcome back. My name is Greg Firman, and this is the Vantage Point AI Market Outlook for the week of March the 4th, 2024. Now, to get started this week, we’ll get back to our regular presentations here.
U.S. Dollar Index
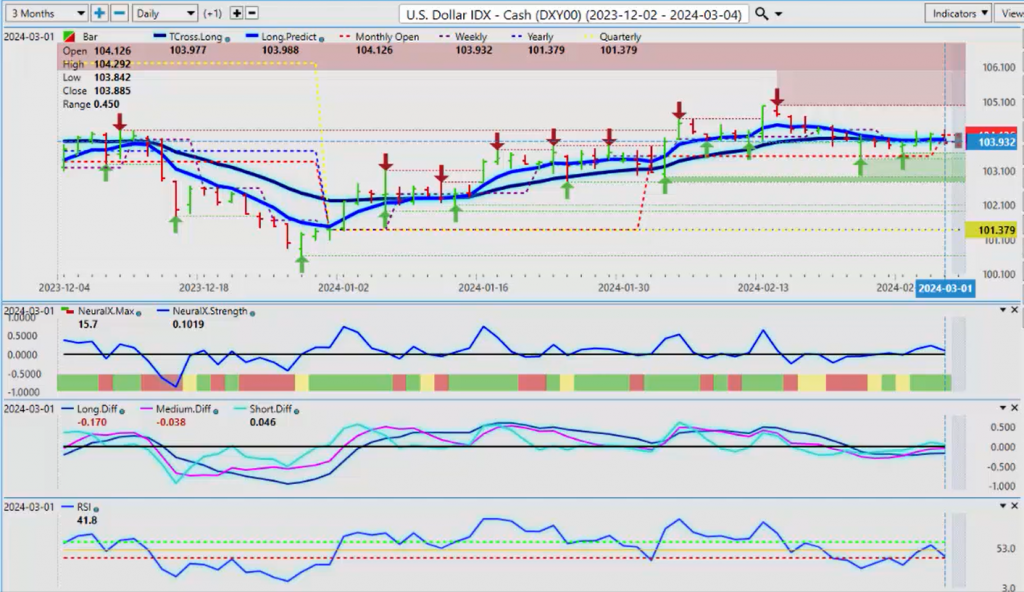
For the most part, I will mix it up from time to time every week, but we will begin with the Dollar Index because it’s setting up for a very busy trading week. We’ve got Fed testimony, ADP non-farm payroll numbers, so it will be a busy week. But, in most cases, the dollar is strong at the beginning of the month with real dollar demand buying, which usually dries up around the 9th or 10th of the month. So, it will be choppy. We have a new monthly opening price that’s coming in at 104.12. We’re looking to hold above that. We have our T cross long coming in at the exact same area, 103.97. The indicators are mildly bullish here. We don’t have any downward momentum. Our predicted RSI not breaking down below the 40 level, but we have an MA diff cross to the upside, which is pretty standard fare in the VantagePoint software at the beginning of the month. So, it suggests we do have dollar strength, but there’s a lot of chatter going on with interest rates. Are they cutting? Are they higher for longer? Data dependent? So, I don’t think any of that is going to change next week, and it could actually get more volatile.
S&P 500 Index
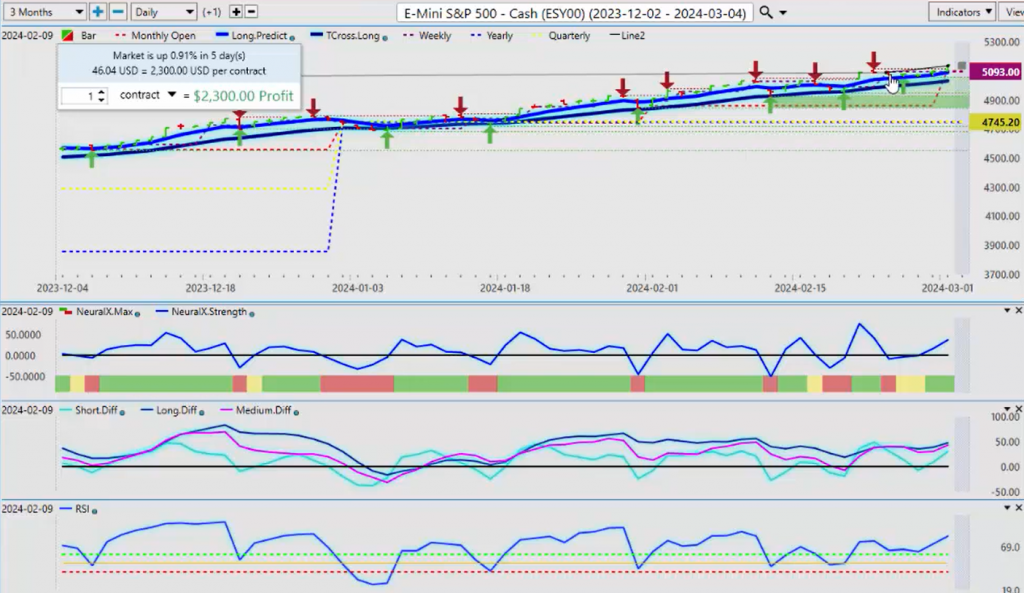
So, when we’re looking at that, we also want to make sure we’re using accurate measurement points on the weekly performance. We always start from the beginning of the trading week on Sunday night to the end of the trading week on Friday at 4:00, so we can see that the S&P 500 actually is not down on the week. It’s up almost 1%. The SPYs are exactly the same thing, about 0.79%. So, again, very important because that can dictate what happens in the next week. But, if we’re using a rolling performance model, that can be distorted and it can create lag. So, the true performance of the SPYs and the S&P 500 this past week is about 0.91%. That’s what we would look at.
Now, if we are going to see a bit of a corrective move in the equity markets, the global equity markets, not just the S&P, then it would likely be over the next 5 to 10 days. That’s usually when that would be. However, the dollar and the S&P 500 have both been positive on the calendar year. Very important again that we’re using proper anchor points. The yearly open price, 4672. When we do that comparative analysis on the Dollar Index, we can see that the dollar is no different, opening the year at 101.20. So again, the dollar is anything but bearish, but neither are stocks. They’re both holding their ground. So, this is something we would want to keep a very close eye on.
DAX 30
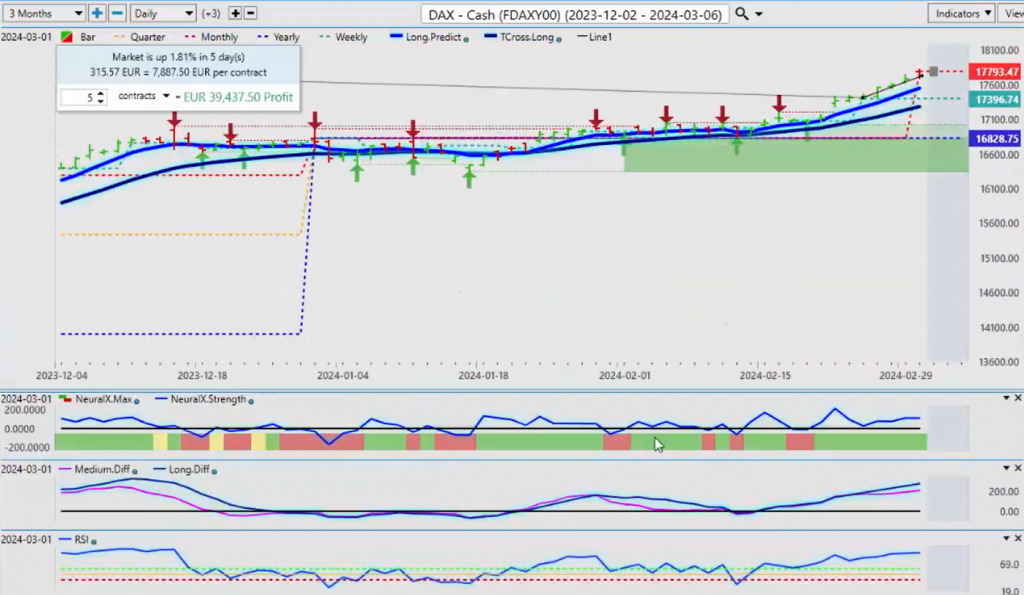
Now, if we do look at the DAX 30, once again, I think it is relevant. There is about a 95% positive correlation to the European equity markets and the US markets, but the DAX is clearly outperforming the S&P 500 again this past week, up 1.8%. So, looking for that to extend. But again, if you’re trading the European equity markets, just like the S&P, the Dollar Index, oil, gold, the FX pairs, we’re looking to hold above the monthly opening price, 17,783. The structural bias of this particular market above the yearly, above the weekly, and we now just need to get above that monthly opening price, and potentially, this can move higher.
Now, the ECB is coming next week. That’s something you want to pay very close attention to because if the ECB is rather dovish in their statement, then that will give the DAX and other European equity markets probably a nice boost. However, if they talk about higher for longer or they’re not cutting, that could put a little pressure on the equities. So, keep an eye on those announcements next week because, again, it will be choppy.
Light Sweet Crude Oil
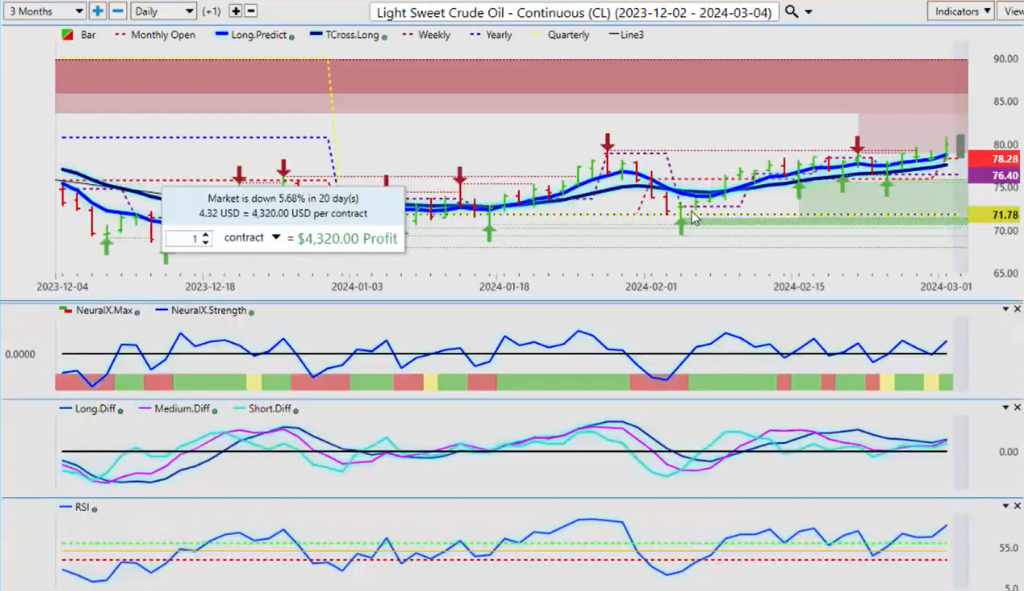
When we look at light sweet crude oil, again, that structural bias of the market using proper anchor points, which I cannot stress enough, guys. The yearly opening price on oil, this has a very high correlation to the Dollar Index. So, as long as we’re good on oil, we’re likely good on the dollar for a little bit longer. So, again, right now, that yearly opening price that is coming in at or about 71.78, but again, the monthly, we want to keep our eye on, and our T cross long, 77.54. Our long predicted, 78.78, but that monthly will is one you want to keep a very close eye on at the beginning of the month, and if the dollar does move higher on its normal patterns of strength at the beginning of the month, then oil is likely to remain firm also.
Gold
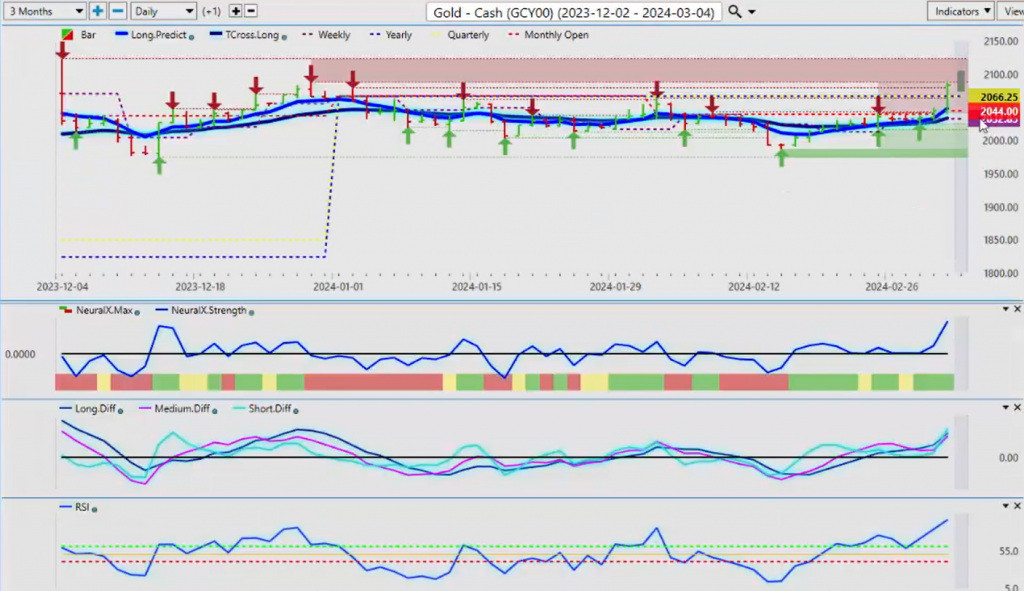
Now, when we look at gold contracts, we’ve had a big spike up on basically speculation on Friday. The speculation that the FED is going to cut sooner. I don’t see a cut until June. If we look at the number of Fed speakers last week, they are not in agreement, guys. So, I believe they’ve overreacted on Friday in thin, illiquid markets, but it’s from an objective standpoint that again using the proper anchor points, the current yearly opening, the current monthly, weekly, and quarterly, very important because either this trend, as we can see with gold, has been down the entire calendar year. We’ve retested the yearly opening price on February 1 and failed. That is exactly what is likely to happen here now. We gold, we could see a lot more gold buyers coming in. I did hear some disturbing news with Putin saying that he potentially would be looking at using nukes. That should have sent equity markets into a death spiral and gold to at least a lot higher than here, and it didn’t. So, we shall see, but the main thing, using that proper anchor point of the current yearly opening price, that level is coming in at or about the 2066 area. So, we need to stay above that level here, guys, over the next few weeks if this is a real trend. But, if we can’t, then gold would likely resume its downtrend, at least for this calendar year.
So again, using an objective current anchor point like the yearly opening price, we know the exact level where the bulls and bears are going to fight it out, and it will be at 2066. So, keep a very close eye on that. But, in my respectful opinion, only buying a bar like that on a Friday is not always the best move. But, if our retracement comes back from our close price at 2083 and then retraces back to 2066, I think you’ve got a long trade here. So again, we need to hold above that. But if any week, you can see we had a very similar fake price like this on February 1, and I will caution everybody of that. We’ve seen another fake price like that on gold around the 12th. So again, be cautious; that is the advice there.
Bitcoin
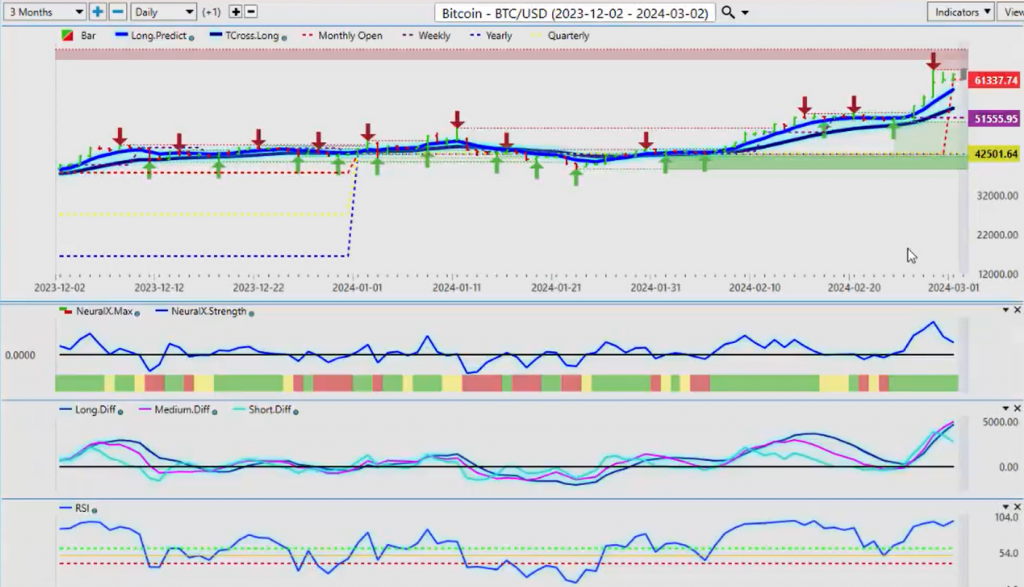
Now, when we look at Bitcoin, again, I’ve been calling for Bitcoin higher and higher. We may have a short-term top in place, but the key word there, guys, would be short-term. I believe they’re going to try and challenge this area yet again, but the levels we want to look on the downside here, the T cross long, 54,000, are long predicted. That’s the area to keep your eye on at the beginning of the week, 58,795. Again, we’re in a period of known dollar strength, which should put a little bit of downward pressure on Bitcoin, but not a lot. We can see that our neural index strength is picking up on exactly what I just said. While the neural index is green, the neural index strength is actually losing momentum. Our predicted differences are overextended, I will say, but again, overbought and oversold signals, guys, very seldomly work out. You’re basically telling the market to stop, turn around, and go the other way. Trust me, nobody’s listening. So, we will keep an eye on this area up here, that high, 63,784. If we can break through that area, then Bitcoin, in my again, in my respectful opinion only, Bitcoin is likely on its way to 75, 80,000 anyway. So, it depends how you want to play this, whether you’re a long-term or short-term investor, but Bitcoin has been a fantastic trade since last year, on that retracement back down into that 16, 20,000 area, and the most recent one, which is really the top trade, in my respectful opinion, is down here around this 36, 37,000 mark. It was a fantastic move, and you can see where that’s gone.
Euro versus U.S. Dollar
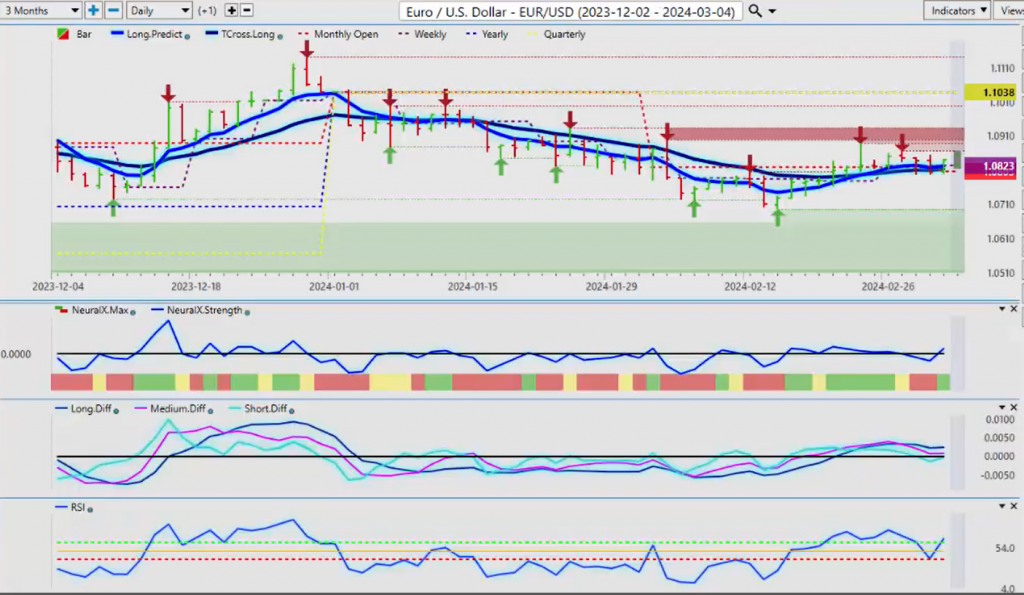
Now, when we look at some of our main Forex pairs, once again, the Euro really doing a whole lot of nothing the last week or two. We’ve had a big spike up. I do anticipate there’s going to be some spikes this week, but in most cases, it’s not always the week to buy the Euro in the first 7, 8, 10 days of the month, plus you’ve got the ECB next week on rates, so we’ll see what they come up with. But right now, the structural bias of the Euro has been negative the entire calendar year, while the dollar has seen gains the entire calendar year of 2024. Now, if I took a random 200 days, 350 days, that would be a false price; it would be misleading. We need to make sure we’re using proper anchor points. So, our new monthly opening price for the Euro, 1.0805. If this level gives way, and we stay below it, then we’re likely going to see the dollar strength run until probably the middle of the month. But again, that is our key area, followed by our T cross long at 1.0812, and the Euro has managed to creep its way back up to 1.0840. But as you can see, we’re really just coiling up and ready for a bigger move, which will likely come this week, triggered by either the ECB or the payroll number. I don’t personally think that that payroll number is going to be good, and it could send the Euro higher. So again, be very mindful of that economic fundamental data coming out this week.
British Pound versus U.S. Dollar
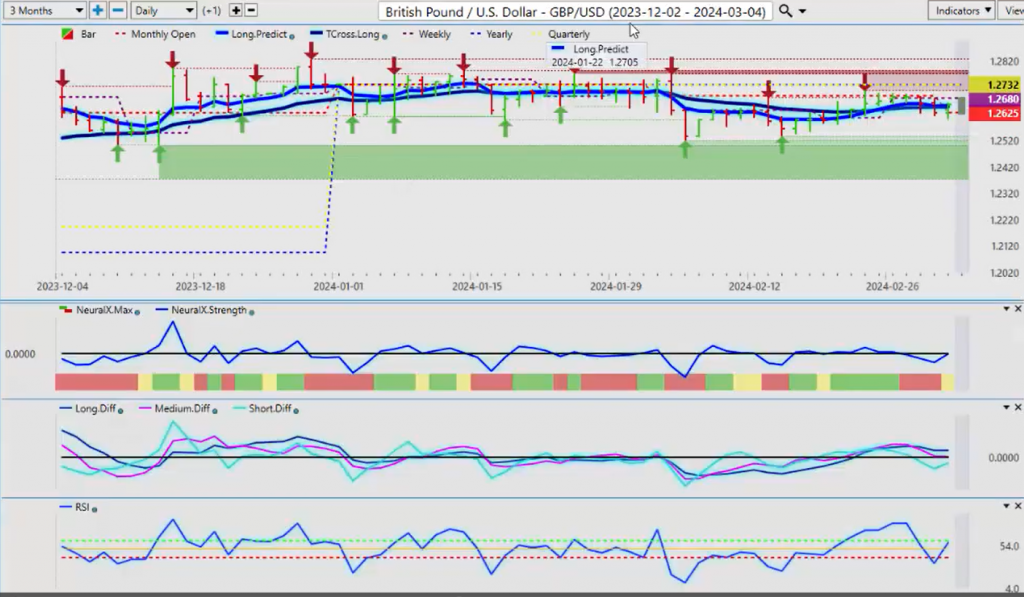
Now, when we look at some of our additional pairs, the British pound-US dollar, we can see that pair again stalling. This is, once again, the importance of using proper anchor points, much like what I showed at the beginning of the presentation. The S&P and the SPYs were not down last week; they were up almost 1%. So, it automatically changes the perception of the trader trying to figure out, well, is it bullish, or is it bearish? Well, it was bearish, actually, last… well, no, it wasn’t bearish last week; it actually had a pretty good week. So, when we look at the structural bias of the pound, we can see how incredibly important the monthly opening price has been in February. So now, we can’t get above the yearly, we can’t get above the monthly, but we do have a new price, and that’s 1.2625. Keep a very close eye on that because our T cross long is also sitting there at 1.2645. So, if we can hold above these two levels, then that should put pressure on the dollar. But as you can see, that is not what’s been happening. There’s been multiple opportunities to short this thing every single day last week, using these particular aforementioned levels. So again, as long as you’re watching that, it’s important.
Now, I do have a notorious reverse check mark on the predicted RSI, so be cautious, but always remember what I’ve talked about in these videos: you very often have a Monday-Tuesday reversal, which means that if the pound goes screaming higher on Monday, it’s likely to reverse on Tuesday, and that’s when you’re getting into your real price for the week. Then we have the ADP report, the ECB, and then the non-farm payroll, so there will be no shortage of volatility.
U.S. Dollar versus Swiss Franc
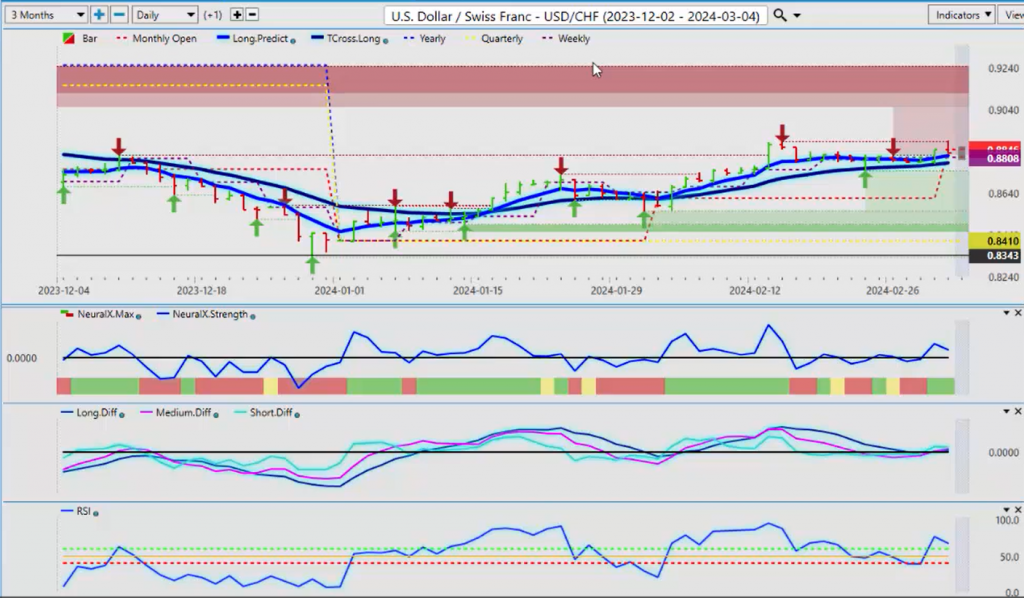
Now, the US-Swiss franc, again, these currencies all have one thing in common, guys. They’re all based around buying or selling US dollars. So, right now, the Swiss franc has been weak. It’s been quite a few years since I’ve seen this, where this particular pair has held above its yearly opening price the entire time. So, we don’t want to get caught up in short-term, medium-term, long-term, or different types of trading to figure out what the trend is. The trend is up, guys. That’s what it is until such time as we hold below our monthly opening price and break down below our T cross long. That’s coming in at .8785. That’s the area to keep an eye on. We break… I believe we will break this area later in the month of March, but I’m not convinced it’s going to be right now. Our main obstacle on the upside, the verified high, that’s coming in at .8886. So, be careful up around this area. If that continues to hold, we’ve had one test on this on Friday, and we’ve already had a failure. So, that’s the value of the verified zones. This is completely objective. The market has failed at this high two bars to the left, two bars to the right, that are lower than that highest point. There’s nothing subjective about it; the market failed. We could argue it’s because of the data, because of the Fed, because of stocks, all these different things, but it failed. That’s all we need to know. The indicators right now are turning bullish again. The predicted difference is breaking above the zero line, so the immediate move up until at least the non-farm payroll number on Friday is likely going to benefit the dollar.
U.S. Dollar versus Japanese Yen
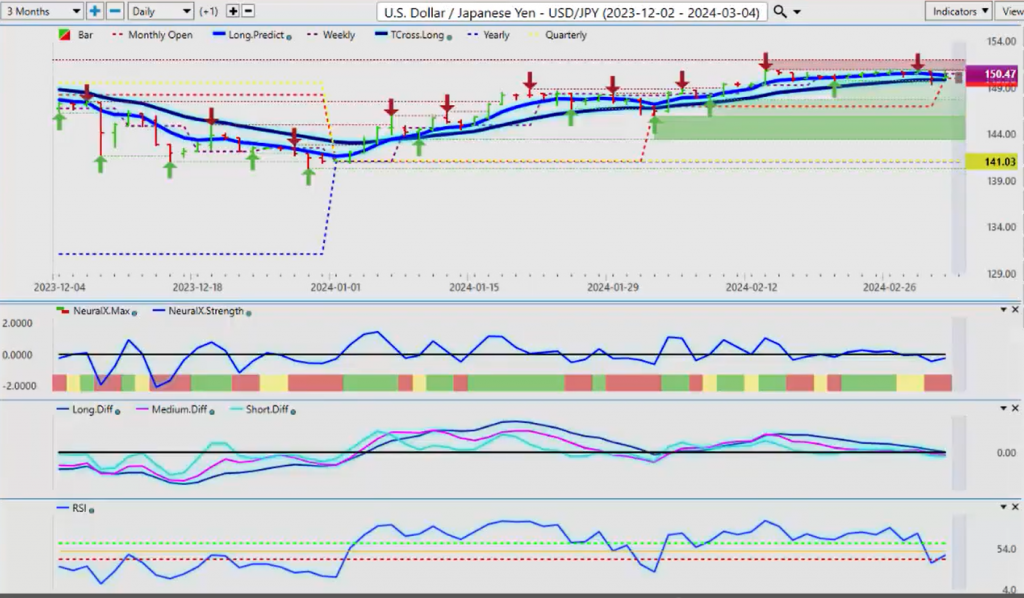
Now, as we come into some of the very, very volatile pairs, which I believe volatility is simply going to tick up, not down, and that would be on the dollar yen. Now, again, with the dollar yen, my concern, as I’ve mentioned on here and in the Vantage Point live training rooms, is that I believe the Bank of Japan is going to intervene in these currency markets, and they’re going to leverage the Fed to do it. So, be very, very cautious. We’re not seeing a lot of buying up here, and again, I still can’t believe that this pair made it to this level of 150, but it’s up here, guys, and a lot of traders trying to short this thing, but you’re fighting the carry trade too. So, be very cautious with this one. Keep an eye on the current monthly opening price at $149.98 and our T cross long at 149.85. The good thing here is that we have these two very identifiable, objective areas. The VP level and the monthly opening. If we’re holding below that, we should see this thing accelerate to the downside, but if we’re holding above it, we still could extend higher. If the Fed backs away from any type of cut, that will send this pair towards 151, 152, likely very quickly. So, be careful with it. The indicators right now are pointing lower, but that infamous reverse check mark on that predicted RSI again, the 60/40 split on the predicted RSI is there for a reason, guys. We’re not using an RSI or any other tool for overbought/oversold. We’re looking for momentum. When we break the 60, we’ve got upside momentum. When we break below the 40, we’ve got downward momentum. So right now, we’ve had a little push below there to 36, and now we’ve got that reverse check mark, and it’s pointing higher. Be very cautious with this pair, is my direct advice, until we know exactly what the Bank of Japan is going to do, and if the Fed is or is not going to cut because he certainly seems very confused, again, to me.
U.S. Dollar versus Canadian Dollar
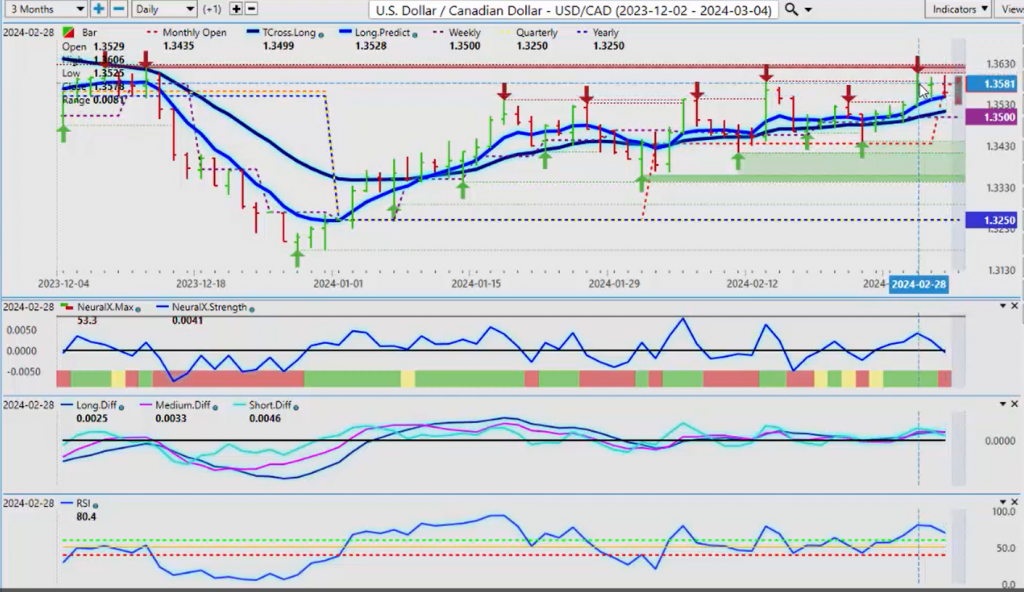
The US-Canadian pair, significant resistance building up here, as we can see by the charts. The verified zones, that high coming in around 1.3606. So, keep an eye on this area up here. The indicators are turning mildly on here. Our neural index strength is in agreement with the neural index itself. You’ve got red there and a break of the zero line. The predicted differences, though, the crossovers are dead flat. The predicted RSI is slightly pointing down, so we may see some selling on this pair, but again, the Canadian economy, in my respectful opinion, again only, is in much worse shape than the US economy, and I believe the Bank of Canada will cut before the Fed. So, if that happens, that will trigger additional Canadian dollar weakness, but for now, there is a mild sell signal forming.
Australian Dollar versus U.S. Dollar
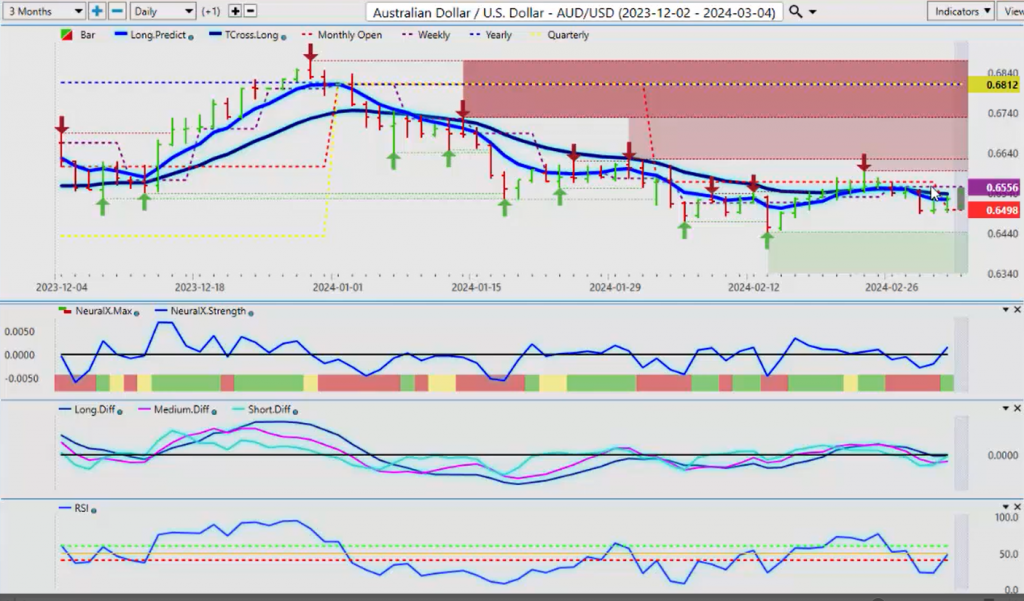
Now, when we look at the Aussie currency and the Kiwi, very similar, if not identical trade. We can see that the structural bias of this is extremely negative. The yearly opening price, .682. Now, we’ve got a new monthly opening price, which may assist the Aussie currency here. Now, that new monthly opening price is approximately the .65 level, so we need to hold above that. Now, our T cross long is .6537, so the way we look at this is if we’re holding above the monthly, and we can get above the T cross long at .6537, then we potentially have the start of a pretty decent long trade, which I believe will happen later in March. I’m just not convinced it’s going to happen yet until we get past this period of known dollar strength, but the VP short-term indicators are turning back up. We can see almost the identical same thing with the Kiwi, but it’s not quite as pronounced.
Australian Dollar versus New Zealand Dollar
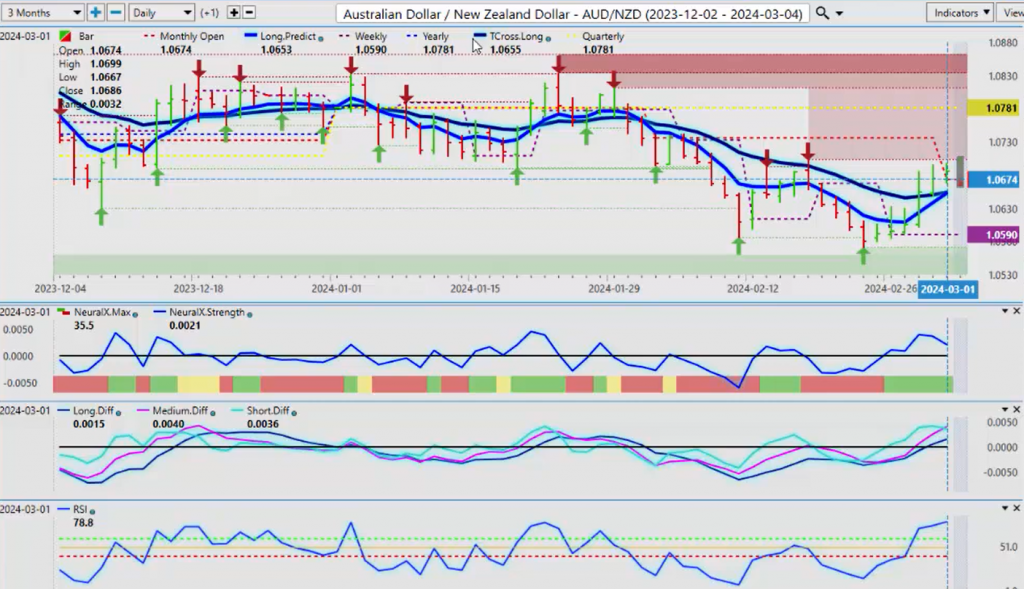
We got a cautionary sign there, so maybe if we’re picking between these two, there’s a little bit better value in the Kiwi than there is in the Aussie. Or, one of my personal favorites that I share on here from time to time is the Aussie-New Zealand. So, instead of trading the Aussie-US and the New Zealand-US, or one or the other, I can have the luxury of going after both. So, showing this pair is kind of cool to see this. We’ve got a strong rise, and we can see where that rise has come from, and we can clearly identify that that’s coming in at or about this area down here at 1.0589. So, we’ve got some support building. We start to move higher. We’ve just got to stay now above this current monthly opening price, and we need to hold above 1.0655, which is the T cross long. What I do like about this is now I have the long predicted at 1.0653, with both of those two sitting there. It looks like we have further upside. Now, I was asked this question before, and I’ll quickly answer it: so if this pair is going higher, should I buy Aussie-US or New Zealand-US? The answer to that question, guys, is you would buy Aussie-US more than New Zealand-US because, in order for traders like me to go after this pair, the brokers behind the scene, they have to buy Aussie-US and sell New Zealand-US to actually buy Aussie-New Zealand. So, just a little side note there that will help some of the traders out there understand that there is some very good opportunities in these cross pairs, and I’ll speak more to that in the coming weeks.
So, with that said, this is the Vantage Point AI Market Outlook for the week of March the 4th, 2024.


