Welcome to the Artificial Intelligence Outlook for Forex trading.
VIDEO TRANSCRIPT
Hello everyone, welcome back. My name is Greg Firman, and this is the Vantage Point AI Market Outlook for the week of November the 20th, 2023. So, to get started this week, let’s begin where we always do, with the US dollar Index.
U.S. Dollar Index
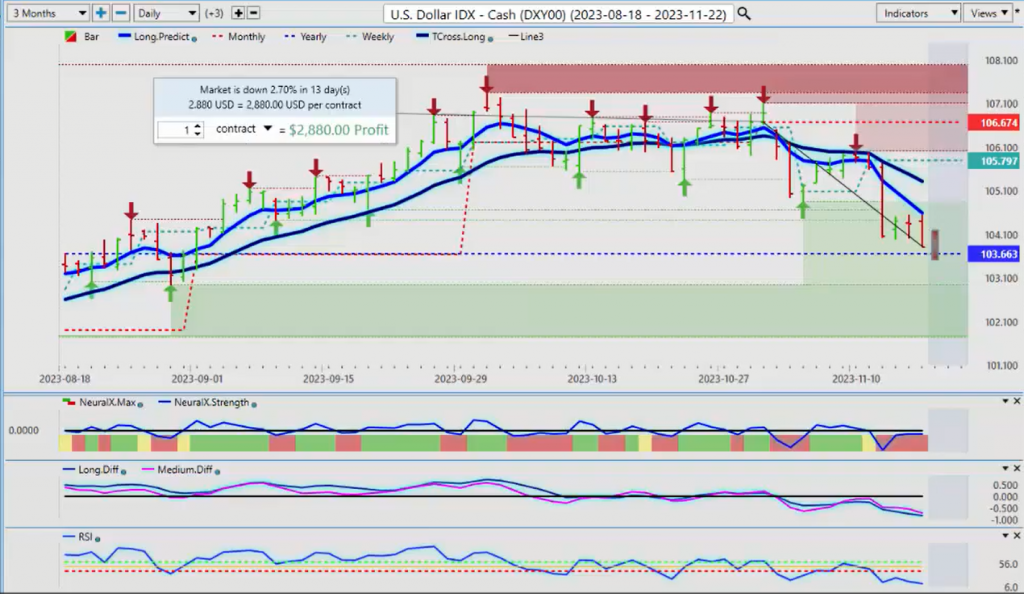
Now, when we look at this from the start of the month, once again, here, guys, we always want to take our Anchor Point from the beginning of the year, and the beginning of the month, the beginning of the quarter, and the beginning of the week. Rolling performance is a lagging model, so when we look at this from the beginning of the month, we’ve used the push from the beginning of the month with the Vantage Point indicators, again confirming that the dollar was going to struggle. Now, that move is accelerated with some of the comments from the Fed this week, some of the economic data, the CPI slightly softer. But again, when we look at this going back into last October, November, the dollar Index did the same thing, even when the Fed was hiking. So, whether he’s hiking or not hiking, the dollar tends to sell off on that seasonal pattern going into year-end.
So, when we look at this, we’ve come back up, hit the T cross long, and we’ve taken a significant drop. But once again, we’re down 2.7% on the month. This is largely giving that boost to the individual stocks, but mainly the stock indices. Now, when we’re using that accurate yearly opening price, we don’t want to be going back a random 5 days, a random 30 days. I’ll show more examples of that as we go forward, but the main thing we have to understand is that we’re still above the yearly opening price, the current yearly opening price, 10366. So, the dollar could find some support down here, at least briefly. The closer we get to the end of the month, that dollar cycle that I’ve discussed where people are required to buy US dollars at a certain time of the month, almost every month, I believe that that will be a smaller purchasing in the month of December, but it could still be there. But our main support we have to look at for this coming week is again, one, the current yearly opening price, 10366. If we can break down below that and stay below that, then we should see further losses in the dollar, particularly going into 2024.
S&P 500 Index
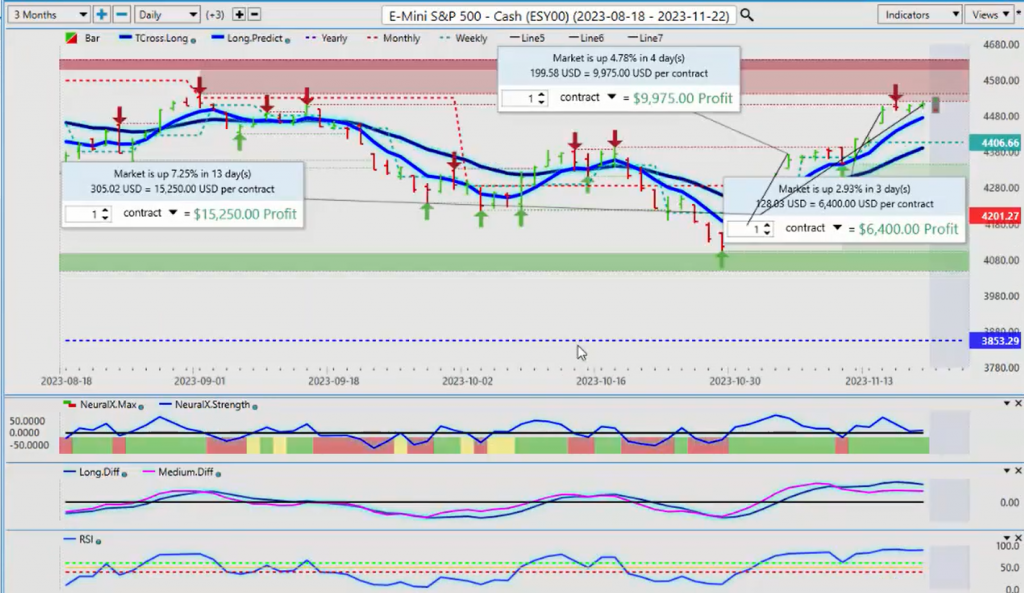
Now, when we look at the stock market and how it’s reacted to this dollar move lower, the first thing we need to do is identify we’ve had several decent rallies this month that started on basically October the 31st. We can see that during this rally, the S&P 500 has moved up approximately 4.87%. We’ve seen a similar rally this past week, up at 3%, but now we’re coming up into some verified resistance. That area of resistance high is approximately 4541. But the key thing we want to make sure that we’re understanding here is when this stock market has rallied on both of these occasions, and I’ll use the example here of October the 31st to approximately November the 3rd, and you can see the secondary rally has occurred this past week. But we’re also starting to stall out a little bit up here. The Vantage Point indicators are actually quite mixed here. They’re suggesting that this rally is not as strong as what it appears to be.
But here’s how we have to look at this. When we look at the SPYs again, the SPYs, they’re not up 3% over the last 3.2% over the last 30 days. They’re up 7.45% from the beginning of the start of November. That current monthly Anchor Point tells us something very different than if we look at it over a random 30 days. It would show 3%, but in actual fact, 7.4% were up in the month of November. In my respectful opinion, it’s a little overextended, and I believe that these Vantage Point indicators are picking up on that. But the verified resistance high once again on the SPYs, we’re coming in at 45367. And again, we’re up 7.45%, not 3.21%. So again, if I took a random 30 days and went back, it would show something different, a smaller move, and this is very often how what confuses junior analyst retail analysts.
Again, we’ve got to be very, very cautious here because a 7.545% move on the SPYs is a significant move either way. So, but the main thing we want to look at here is how do individual stocks react to this? If we look at Ford Motor Company, which I’ve talked about over the last month, we can see that it is grossly outperforming most of the other stocks. When we, not all stocks, of course, but I’ll use a few as an example. So, during that rally in the S&P 500 that I just showed you, the Ford stock actually went up 9.26%. So, if you’re short selling this, you’re getting killed. The market then comes back down at the same time the S&P 500 corrected lower. Then this past week, we rally up again, another almost 9% on this particular stock.
If we do a comparative analysis to something like DGX, these moves are tiny compared to what they were with Ford. But the point being is that they’re moving up with the S&P 500. If we look at the HSC stock, this is probably one of the biggest winners from last week, again, up almost 10%. And again, short selling this stock, the trader’s getting killed on this. You’re borrowing money, you’ve got unlimited risk, now you’re caught in a short squeeze.
So, again, when we look at this, when we see a big, and this, at this particular time, this stock moved in the opposite direction of what the S&P 500 did. But now we can see, a mere matter of weeks later, that this stock recouples its correlation to the S&P 500. But again, if we look at something like Gap Bank stock, we see the exact same rally on a percentage basis. During when the S&P went up, the Gap stock went up the same amount that the Ford stock went up, and it went down the same amount also, which is critical to understand. So, if you sell Ford and buy Gap, you’re theoretically either break even slightly up, or you’re actually probably down money because of the cost of short selling the stock, and you’re caught in this short squeeze.
So, the main thing we have to understand that we don’t want to buy one and sell the other because, again, you’re at best break even here. When we look at the additional stocks like Kelloggs, very slow moving, very, they’re still decent moves, but nothing compared to Ford and Gap. But the main thing we need to understand is that these two stocks, meaning Ford and Gap, they moved up at the exact same time, and on a percentage basis, they moved the same. And again, when it turned back down, it also did the same. So again, if the S&P 500 does correct lower into the end of the month, then so would all of these stocks.
If we look at the additional stocks here, we can see that again, these rallies are the same. But the big winners in both of the most recent rallies in the S&P 500 and the SPYs, Ford and Gap, both made very good gains. But the whole concept based around Advanced Intermarket Technical Analysis is that we can identify this, and we also use the current weekly, monthly, yearly opening prices to further identify what these trends are. Ultimately, we can see that the data can push the Gap stock even higher. But that doesn’t mean that these other stocks are of less value. So again, it’s very important that we’re always looking at all of the data, not just some of it.
Gold
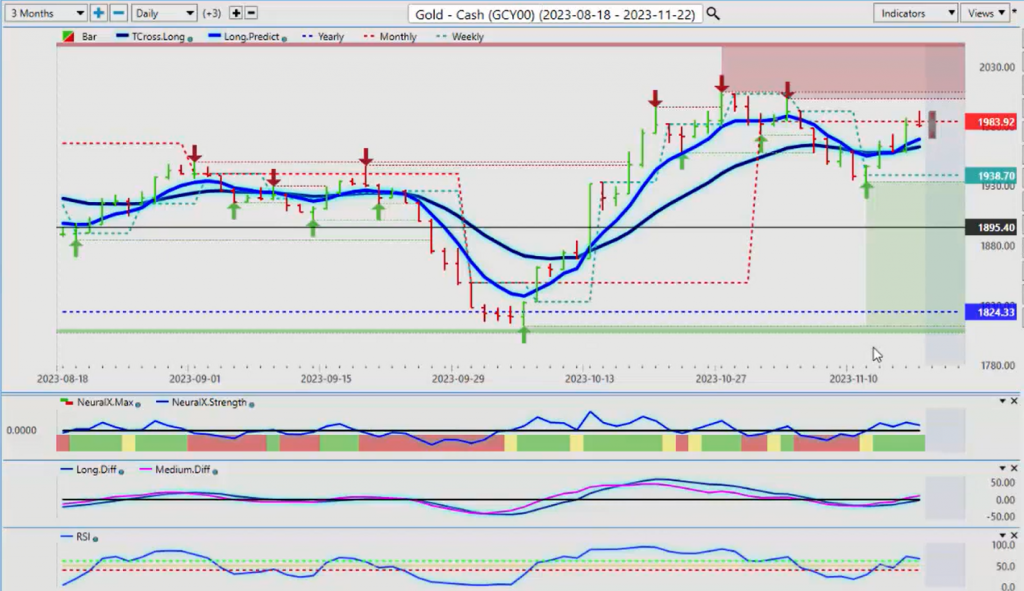
When we look at the Gold stock, or excuse me, gold Futures going into next week on that dollar weakness, they’re starting to recover. There’s a very well-known seasonal pattern in the month of December with gold. And either way, we can see that gold is flat at the start of the week, and it’s rallying up. But it’s getting tangled up in the current monthly opening price at 1983. So again, if I went back a random 30 days, a random 5 days, a random 365 days, I wouldn’t see this resistance here. And again, guys, this is based on just trying to help you get more on the institutional side of trading and move away from these retail pitfalls. Because again, in order for me to get long on gold, I would like to see this clear and get positive on the month. I’m not convinced at this time that will happen until after the first week of December, but it could. But you remember when they said back here that gold is a sell, gold is bearish? Well, actually, when this happened back at the back in October…
I had been clear that the year-seasonal versus the 10-year and the 20-year seasonal have started to shift, and that’s like an exponential moving average or a weighted moving average where I need to look at what the current trends are. That seasonal in gold is shifting forward is what it’s doing, and again, these are things we want to make sure we’re looking very closely at. But for now, we have good support on the TR cross long, and that’s coming in at 1962, but 1983 is where we need to clear this and stay above this. And again, I believe that we’re still a few more weeks away, and we’re likely we could see another slight corrective move lower. But I will concede the Vantage Point indicators are bullish at this particular time.
Bitcoin
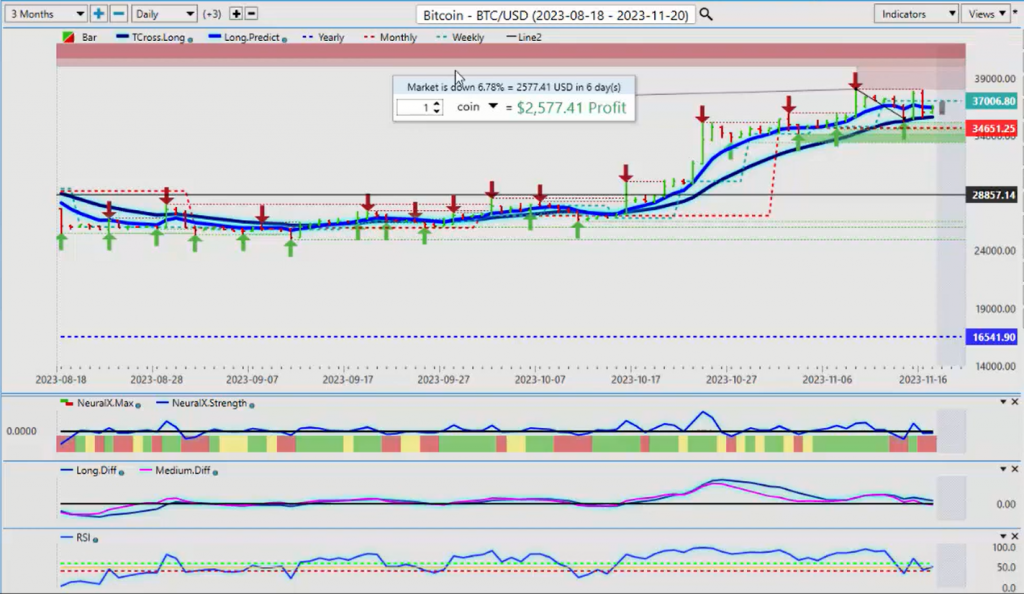
Now, when we look at some of the other major players in these markets, of course, we don’t want to ever discount analyzing in isolation to some degree. Bitcoin, now once again, Bitcoin as I talked about, we had a fantastic long trade on this in October, and we were weeks out in front of this because again, guys, this is an Outlook, not a recap of something that’s already taken place or is in progress. So, in the last couple of presentations, I’ve warned that in most cases by mid-November, Bitcoin is struggling. Now, Bitcoin is putting up a good fight here between the Bulls and the Bears, but you can see that they’re reacting to the Vantage Point TR cross long to the number. So whether you’re a buyer or a seller of this, there’s enough meat on the bone for everybody here.
So again, this past week, I was going long and short, but predominantly short because the same signal from Vantage Point that put me long in Bitcoin before this big move happened are the same indicators that are telling me now that this is probably not the time to buy this. So, a very strong seasonal pattern in Bitcoin usually occurs between early to mid-October and early to mid-November, then it backs off a little bit, and then it starts to rally again. So we just want to be patient with this one, but I think that the shorts carry the edge. And again, the AI is very clearly identified the resistance High 37962; we have hit that level twice this week, but we’re also hitting the Vantage Point T cross long at 35517. So that’s what you’ve got to deal with here next week, guys. And if you don’t want to get involved on either side of this, you can straddle the levels that I’ve just said: a buy limit order above 38,000, a sell order below the Vantage Point T cross long, which currently resides at or about the 35,663 Mark.
Crude Oil
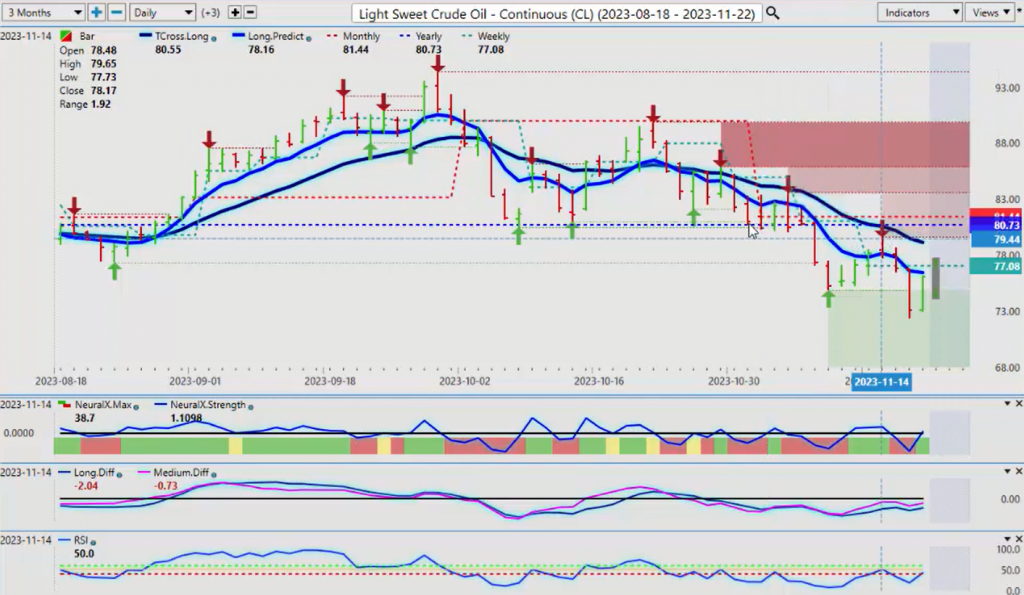
Now again, when we look at going into oil for next week, oil really struggling these last few weeks, and I don’t see a lot of light at the end of the tunnel for this. We’ve broken down again, the importance of using the current monthly and yearly opening price because you can see as we, as we, the battle lines are drawn along the current yearly opening price; the market doesn’t care what occurred 365 days ago or 30 random days ago. It cares about what’s going on in the current year and in the current month and in the current quarter and week. So when we look at this, the retracement back up to the yearly opening price saw yet more selling coming in. But again, we could recover or look for a retracement; the indicators are starting to turn very mildly bullish. But again, this would be a corrective move higher, not a new trend, guys. We’re below our T cross long; we’re below the current yearly opening price at 8073, and more importantly, we’re above the monthly opening price at 8144. So, if we do move higher, we must get past this long predicted at 7646 first before we go anywhere else.
Euro versus U.S. Dollar
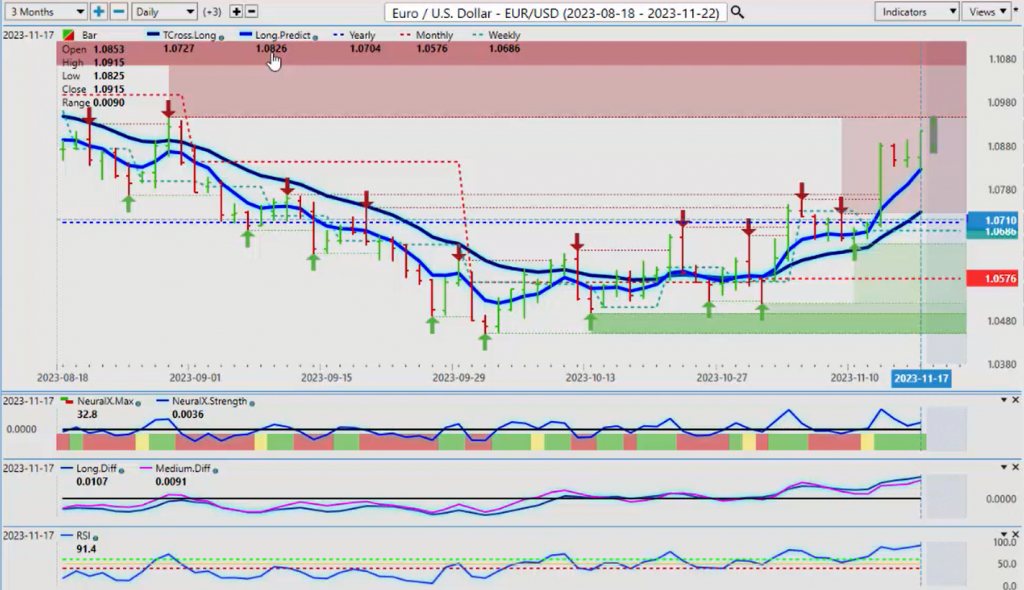
Now when we look at the Euro going into next week, if we’re going to see some type of corrective move on the Euro or some US dollar buying, then we use the verified resistance Zone up here as a target point that is 10945. This is going to be a significant obstacle; be careful of a bull trap up here, okay? Again, we’re pushing a little bit too far away from our T cross long, 10727. 10826, those are our two main predicted moving average pivot levels. So again, the further we move away from there, the more likely it is we’re going to retrace back to them. But because cautious buying up here; the indicators are still moderately bullish, but again, that dollar cycle at the beginning of December is concerning. But everything is starting to pile up on this fed, and I think he’s going to get even more dovish going into 2024. So yes, it does favor more longs on the Euro, but I think a corrective move first to the minimum level of 10826 is likely in the cards.
U.S. Dollar versus Swiss Franc
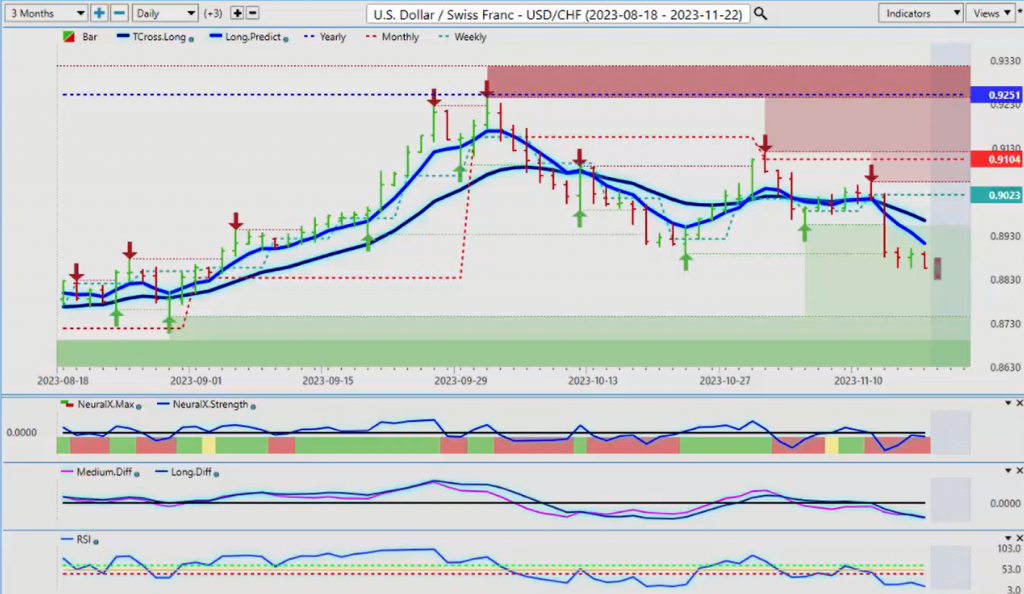
Now, if we get that same correction on Euro US lower, then US Swiss franc would correct higher. We can assess here that again you’ve got three daily bars that are all beside each other. So in your software, you can simply click on this and go like this and create your own support level. So that support level is coming in at 8856; watch for a bear trap here, guys, okay? Because again, I don’t think there’s a lot of love out there for the US dollar at this current time. But we see how quickly sentiment changes, right? So sentiment can change here very quickly also. So for next week, if we get this neural index strength breaking above the zero line, then a short-term corrective long back to the TR cross long at 8965 is reasonable. But this is not a new trend, guys; this pair has been, and again, the advantage of using the current yearly and monthly opening price and putting aside the rolling performance model because again, you can see the confusion it’s causing every week. One week it’s bullish; oh, now we’re bearish; oh, it’s boring this way. Well, no, guys, you’ve got to measure where the real performance in the year and the month is. So for next week, be cautious with this pair, and the same would go for the pound-dollar.
British Pound versus U.S. Dollar
The pound has made a significant advance, but as you can see, the bulk of this came on Tuesday of last week with that CPI number. And this is another good example of why a lot of this data is meaningless. Again, the CPI is lagging, guys; it’s a month behind. It’s like the non-farm payroll; it’s lagging the unemployment numbers on the previous month. So after all, basically, all hell broke loose on Tuesday, it’s done nothing since then. It is connecting to the Vantage Point long predicted here at 2392, but I think a slightly deeper correction could be in the cards here.
But either way, we would be buyers of this pair in December on that seasonal dollar weakness. But again, be careful because the indicators are very mixed, but that is the level you want to watch, 1256. But you can see that in that single day, we went from 12266 to 1256. That is a big move for a G7 currency, guys. And again, we’ve done absolutely nothing since. So if you’re a seller of this pair, you would use this point or slightly above it to set your shorts. If you’re a buyer of this pair, then you would be using the long predicted at 12392 or the T cross long at 12305, and you would patiently wait for the dollar buying to exhaust itself and then step back in. Let the market come to you, guys.
U.S. Dollar versus Japanese Yen
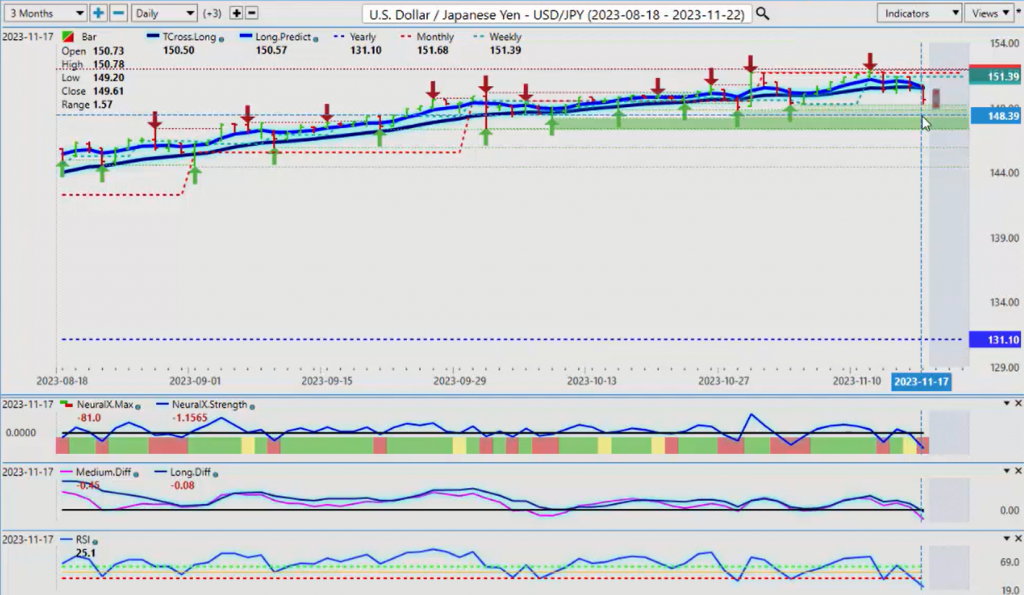
Now, with the dollar-yen, I’ve talked about this one over the last month or so too, and there is a strong seasonal on the yen. I know it’s the carry trade, but now the market is rethinking that carry trade and saying, okay, if the Fed cuts the interest rate differential between the Bank of Japan and the Fed is going to change, it’s going to change a lot. I don’t think right away, but it is going to change. But either way, when we look at this, and again, if I look at that exhaustion from last year, this is what dollar-yen looked like last year while the Fed was still hiking, and now he’s not going to be hiking. So this almost looks like anybody watches a kid The Price is Right or maybe some people still watch that show where they have The Yodeling guy that goes up the cliff. Well, it looks like The Yodeling guy is about ready to fall off this thing. So be cautious. I know everybody wants to get on the long trade, but we’ve got some heavy verified support at 14921. I respectfully submit if we break down below this level or more importantly 14881, we could see a significant move lower here. I believe this pair is grossly overvalued at 150, and this largely had to do with intervention from the Bank of Japan. Once again, just another great example of how a central bank interfering with the markets does nothing but screw everything up. So to put it in layman’s terms, and we’ve seen the Fed do it, the Bank of Canada do it, every single Central Bank, and now they appear to be reading off the same script, don’t they? Well, we’re not going to cut but higher for longer. Well, it’s funny that they’re all saying the exact same thing. So obviously, they’re working together and they’re being told what to say and not say. But either way, guys, if we look at the patterns, I could see next year the yen moving back into where it should be, fair value somewhere down around the 120, 119, or even around the 115. This move could accelerate very, very quickly. So be cautious with longs.
U.S. Dollar versus Canadian Dollar

Now, when we look at our main equity-based currencies, the CAD, the Aussie, New Zealand, if the equity markets… I believe we a slight corrective move in the equity markets is warranted before we go into our Santa Claus rally in December. And again, nothing is guaranteed in these markets, but if that transitions, which now the Fed backing himself into the corner likely going any future hike would be a dovish hike either way. And then we have the potential of… People will argue, ‘Well, we’re in a recession, so stocks do bad in a recession.’ Well, my view would be the US and many other countries have been in a recession in a technical recession for over 6 months, inverted yield curve, economic indicators like the ISM showing contraction, not expansion, unemployment numbers falling. I don’t know where the Fed is getting his information, but I pull it off the BLS website. I can see what the unemployment numbers are. The CPI number is, again, a lagging indicator. But if we look at what the technical definition of a recession is, then I think the markets are lagging, and we’ve already technically come through it. So that is still a concern.
But for now, our T cross long is 13744. So for next week, and again, we’re below the monthly opening price. All our resistance here is 13875. But the yearly opening is 13551. So I believe we can move down towards that target, but we need stocks going higher and we need oil going higher, and preferably commodities too, like gold and silver, to put further pressure against the US dollar. But 13551 and I’m going to argue 13875. This is where our main resistance is for next week, and shorts carry a very, very slight edge.
Australian Dollar versus U.S. Dollar
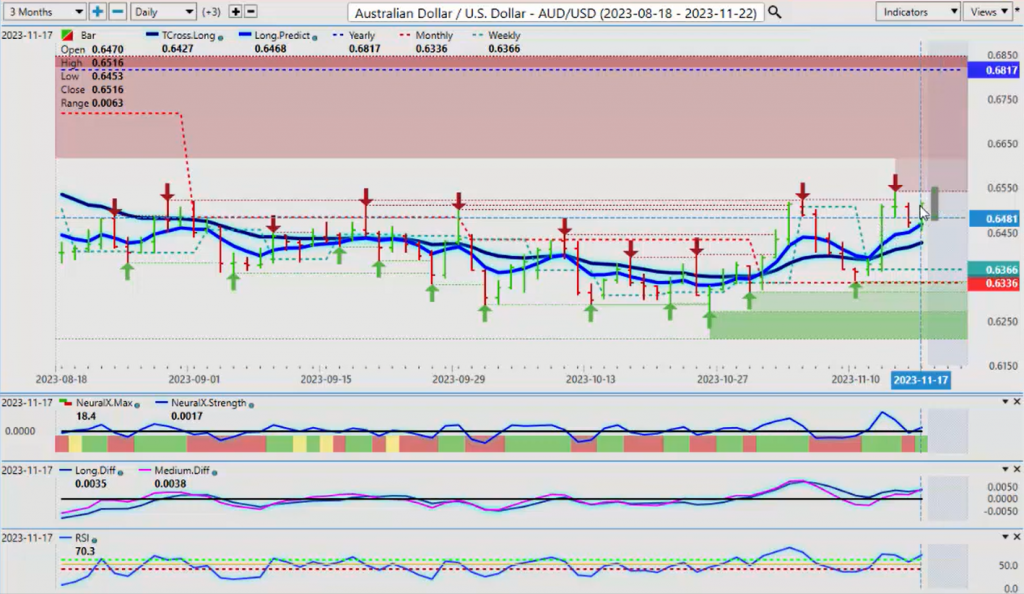
The exact opposite Aussie is the base currency against the US dollar, so this carries a slight resistance here or a slight bias higher. But we’re still very negative on the year, 687. We need to get this thing moving. But again, my concern is that all of these gains have come from that CPI number. The retail sales last week certainly didn’t help the dollar’s case. But the CPI is the one that did the damage. So again, the markets, there’s some indecision here. We finished the week quite bullish on the Aussie, actually. It matches the high from that CPI bar just under 65. But this also could be a trap here.
If we’re going to buy this, we look more towards the T cross long, 6427, and between that and the current not random 30 days, guys, the current monthly opening price, 6336. Again, even if we go back and look at this, and this is what most junior analysts miss, is even if we look at something like this with Ford, we’ve got a verified support low at 963. We come back down to 963 this week and we rally off the exact same point. So again, short-selling is very expensive. Short-selling is potential for unlimited losses. I don’t think we would just want to throw that out there about short-selling. It’s easy, you’re borrowing money if you read about it. But again, when we look at this, this was a pretty easy trade, and all we needed was the S&P 500 moving up. And we know that these low-hanging fruit stocks, any one of these stocks will immediately react to that. And again, currencies work the same way, guys. When the dollar is weak, everybody else gains, right? So when the S&P 500 is strong, like if you look at a lot of the companies in the S&P, they’re largely… There’s a number of zombie companies where they’re just in business to service their debt. So again, but they still go up when the dollar… So that reaction can be very, very lucrative if you know how to play it. We don’t want to get caught up in lagging tools and indicators and throwing in rolling performance models because it just throws us completely. It causes confusion when it… There’s nothing to be confused about. Stocks go, S&P goes up, most of your individual stocks go up, US dollar goes down, most of the currencies around it will tend to go down.
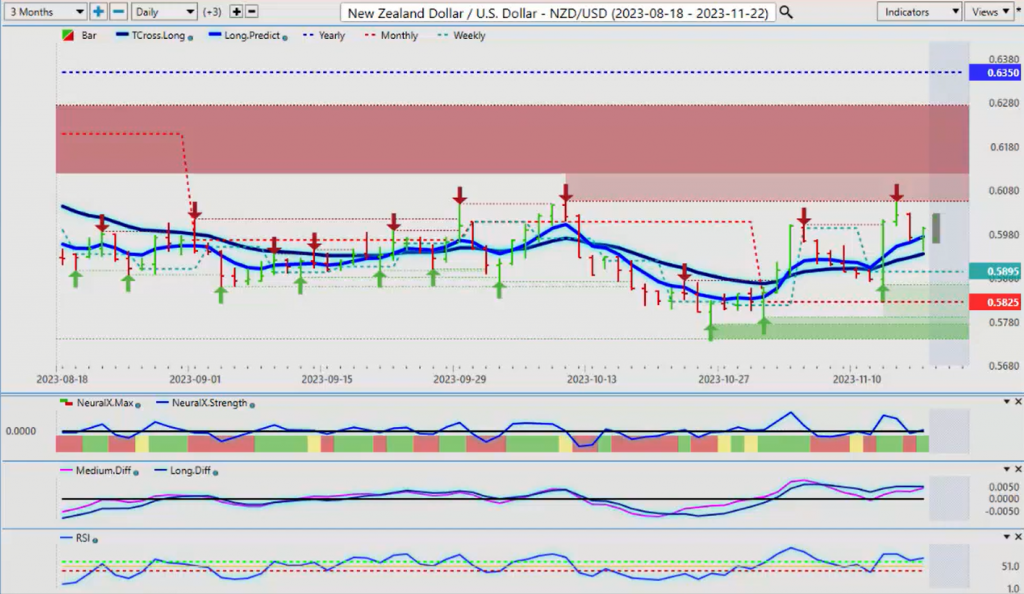
New Zealand Dollar versus U.S. Dollar
And it again, New Zealand…
New Zealand had a slight extension, but that is a good example of a bull trap here. But the verified resistance high in Vantage Point warned us that there was additional resistance there at the high of 655. But Vantage Point also shows us the T cross long by using the triple AMA CR cross with just the T cross long that gives me an exact pivot level 5935. And I know that that’s is actual support for me. That’s a buying area for me. I’m backing that up with the current weekly opening price and the current monthly opening price. This gives me the leverage I need. And when we look at New Zealand, the pair, you can see that a number of pairs, including the S&P 500, by the way, and the NASDAQ, they leveraged the very beginning of the month. They went straight up, and that’s because, again, there’s that beginning of the month buying, and a lot of times the institutions will come in and make those moves at the beginning of the month, take their profit, and then wait till the end of the month. So as long as we can track them, we can definitely follow what they’re doing.
So, with that said, that this is the Vantage Point AI Market Outlook for the week of November 20th, 2023.