


VantagePoint AI Market Outlook for the Week of October 14, 2019
The VantagePoint AI Market Outlook is designed to help traders. It’s important to remain aware of correlations in the global markets. Traders can become more profitable if they know how to get ahead of the trends. Utilizing the predictive indicators in VantagePoint Software can help traders find the right trades and the right times. Above all, traders know when to enter and exit those trades for maximum profit. Let’s look at the charts for the U.S. Dollar, Gold, Crude Oil, The Stock Market, and Major Pairs.
VIDEO TRANSCRIPT
Hello everyone. Welcome back. My name is Greg Firman and this is the VantagePoint AI Market Outlook for the week of October the 14th, 2019.
The U.S. Dollar
Now to get started this week, we’re going to begin where we always do, with that very important US dollar index. Now as you can see here, as we discussed in last week’s Forex weekly outlook, working with these monthly seasonalities, patterns in the dollar. Now in last week’s Forex weekly outlook, I suggested that the dollar would not have a very good week and that has come to fruition. Now surprisingly, the dollar is sold off on this partial trade announcement. A little confusing as to what actually is going on now with this US trying to trade deal. Now we’re going into a phase one, phase two, phase three. The market, initially, responded very positively to that, but then by the end of the trading day they started to scratch their heads saying, “well, is anything really resolved here?”
So that’s the million-dollar question here, guys. So I think that the volatility is going to continue. Now with the dollar index, as I had talked about in last week’s Forex weekly outlook, that we have this major support here coming in at or about the 98.30 area. We have decisively broken below that area. The VantagePoint indicators, however, again, to point out, told us long ago that the dollar was going to move lower. I simply highlight the VantagePoint indicators to help interpret what they’re saying. So the medium-term crossing the longterm predicted difference warned us the dollar was getting ready to move lower. This has continued to advance lower with the neural index and the predicted RSI. However, we are now moving into 21.2 on the predicted RSI, which is suggesting the dollar losses could start to slow here.
Now the dollar is usually stronger towards the end of the month, but there is enough on the table that could boost some dollar demand, but I don’t think that’s going to be for a little bit yet. So for now, we want to watch the next verified zone coming in at 97.73 and again you can see here 97.56, but the bigger level that I would be very concerned with is down around this 96.55 to see if we can even come down and test this particular level.
The Gold Market
Now with gold contracts, looking at gold in the next week, gold suffered a little bit this week with the dollar, as the markets trying to determine what’s going on with all of these factors. We’ve got Brexit, we’ve got Hong Kong China relations breaking down. We’ve got a war brewing again in Syria. All of these different factors still do indirectly support gold. Now again, nothing goes straight up and nothing goes straight down. The primary range that we’re still in, you can see that gold has broken down below this particular support level, also, at 1,492, which is not a big concern. The bigger level here where we’re likely going to see those buyers coming back in will be 1,465 in that particular area. The VantagePoint indicators are saying we’ve still got a little bit more downside on gold from a corrective standpoint, but we’re going to wait and see how this progresses.
But right now there is still a bias to the downside, but this is based around the positive developments on the US-China trade deal. And of course, the Brexit going from a no deal, a 35% chance of a deal, only to now a 55% probability of Brexit going through. So that’s not a huge difference here guys. So the market has to rethink this now going into next week and saying, “Has anything really changed here?” And in my respectful opinion, the answer is no.
S&P 500
So when we look at the rally that we’re currently seeing on the S & P 500 on oil, they’re both going up together. We’re now coming back up into a known area. What I would anticipate here is additional strength up into somewhere, maybe even just above 30, 3,027, we get a false break higher or a bull trap up here only to see the equity markets slide on further global tensions and global growth slowing period would be enough to cause that. Earnings have not been great. I don’t anticipate them to be that great going forward. There are far more reasons to sell the S & P 500 than to buy it, but be again either-or. Right now, VantagePoint has called the direction of the S & P 500 accurately in both directions here, guys, both up and down.
I was asked earlier in the week in the VantagePoint live trading room, “Would I sell the S & P 500, down at 2,930?” And I said absolutely not because this is, again guys, very much like a movie here, and it, or a story that’s being told on the planet Earth, we only have seven or eight stories. We just keep retelling them over and over and over again. We’ve got a love story. We’ve got a villain, we’ve got a betrayal. We’ve got all these different things, but it absolutely applies to trading. We have seen this before. We’ve seen this movie before. We know who the players are. We know what the plot of the story is. All of these different factors absolutely apply to trading and trading can be very, very repetitive, and remember the market is only trending 20% of the time. We do not want to follow the trend in most cases because in most cases the market can’t figure out what the trend actually is.
So when I look at this right now, I have very, very strong resistance here on these verified zones. The first one, 2,993, the exact level that I discussed in the in the VP live room, and again, this additional resistance up in this 3,027, 3,024 areas. So we’re going to be watching this area very closely. The indicators, for now, are saying that the S & P 500 is going to go higher, but this is also based around the global inter-market correlations. All of those European stock markets rallied significantly after this Brexit announcement. So if that Brexit doesn’t come to fruition, then those global or the European equity markets will sell off again, potentially, next week. So be careful with this, okay?
Crude Oil
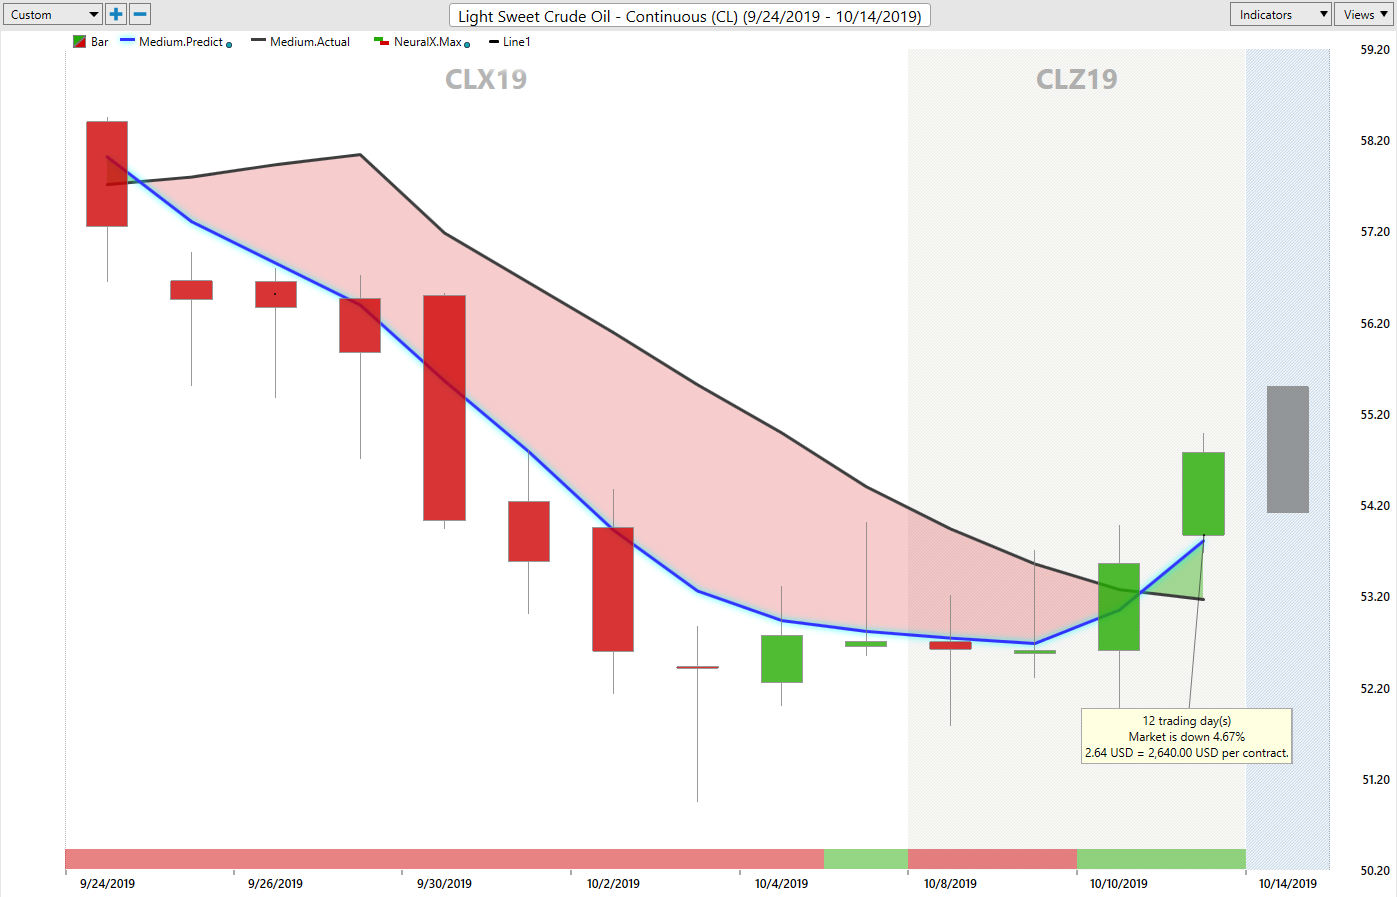
Oil? Oil is simply running on the coattails of the global equity markets. Oil is rebounding, but remember, guys, Brexit aside, the US trying to trade deal aside, are the global markets slowing down? Yes, they are. Is that partially being caused by this a trade war? Yes, it is. But again, take the trade war out of this. It doesn’t mean that all of a sudden the global economies are all of a sudden going to go higher, or they’re going to start seeing additional growth. I don’t believe that to be accurate. So right now we’ve got this resistance on oil at about 54.42, but again, I don’t anticipate any significant rally. Looking at the seasonality of oil 80% of the time it sells off between September and December.
Bitcoin
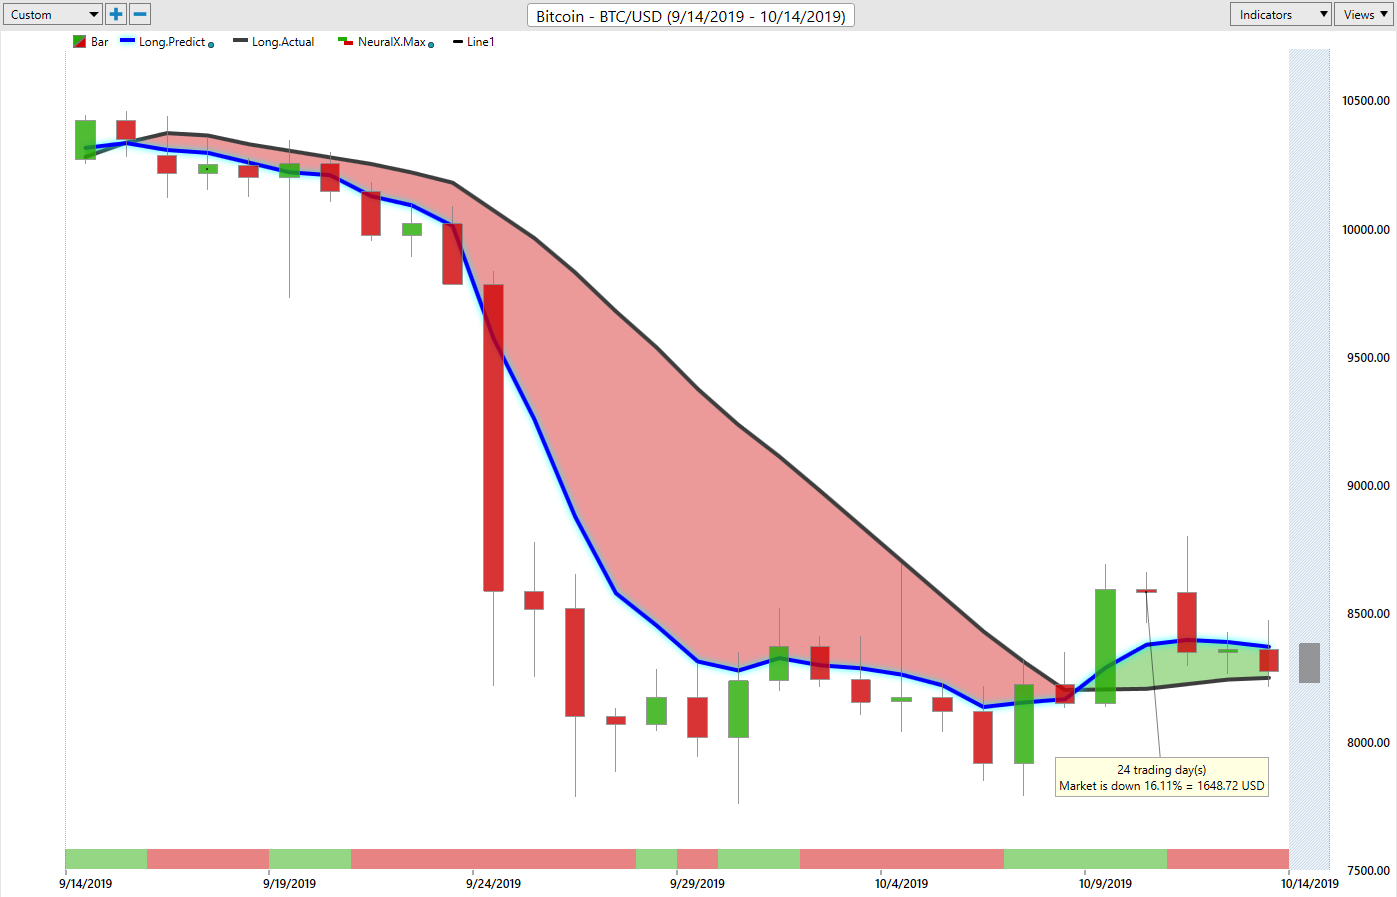
Now, what we also want to look at here going into next week’s trading is Bitcoin. I’ve worked that into one of the major markets that we should be looking at. Now with Bitcoin, we’ve got very significant support down here that I’ve outlined over the last several weeks, that area coming down around 7,755 we’ve made a nice move off of there, but now we need to get going here, okay, and what I mean by that is we need to get above 8,535 and stay above this level. Break free and clear of it, free and clear of this level, which may allow us to retest the ten thousand, eleven thousand mark. That may or may not come to fruition, but right now the indicators are very mixed on Bitcoin. I would say that Bitcoin is going to move, likely to move sideways with a slight downward bias next week, if the US dollar starts to turn around. So we’re going to be watching that, again, very, very closely next week to see what’s going to come from that.
Forex Weekly Outlook for Major Pairs
Euro/U.S. Dollar (EUR/USD)
Now when we start moving into our main Forex pairs, the first pair we want to make sure we’re looking at is, of course, the Euro-US. Now the Euro-US, I had been forecasting this to go higher at the beginning of last week and that was around the basis of that monthly seasonality, that there is very little demand for US dollars the week after the non-farm payroll. Regardless of how good or bad that number is, it’s come to fruition again. The dollar index selling off is pushing the Euro higher, despite dismal economic data coming out of the Euro, I don’t dispute any of that, guys, but the fact of the matter is the market would rather buy Euros than U.S. dollars. Now we need, the downside here is now we’ve moved into an overbought condition at 80.6.
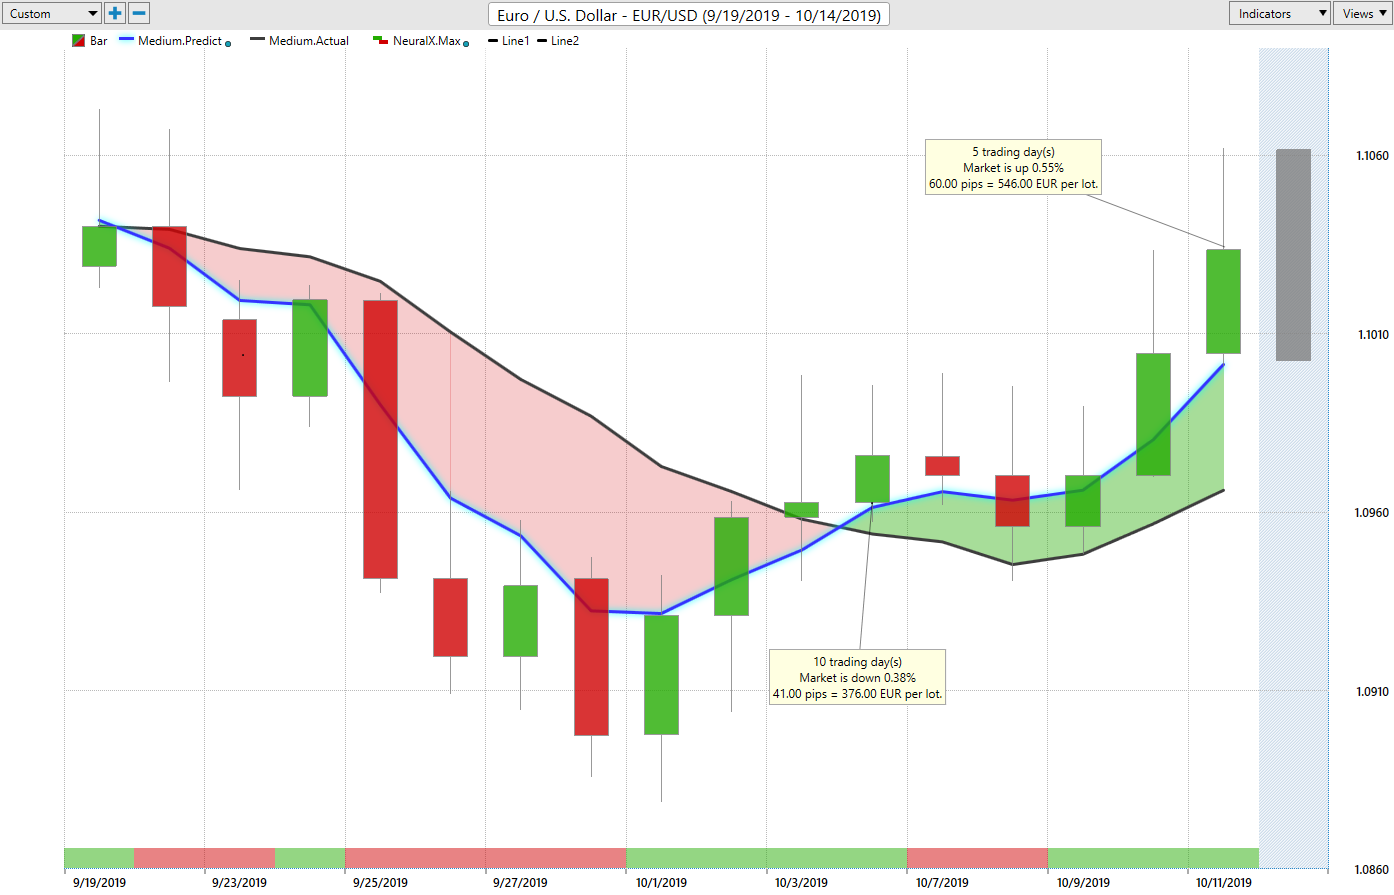
We’re going to see if we can at least retest this again, the December 13th high, and that’s where the Euro started to fall. Now we could see that seasonality there as we go into next week, or that monthly seasonality where the Euro starts to weaken again towards the middle or end of the month. So a little bit more of a push in the Euro, but just be very cautious next week around this 1.11 area. If we break through 1.11, be even more cautious around 1.1163. But with the dollar, if the dollar index can hold below that level that I discussed, then the Euro should be able to advance.
U.S. Dollar/Swiss Franc (USD/CHF)
Now as we look at the US-Swiss Franc, the Euro-US counterpart. This is a 100% global equity-based trade. What I mean by that, guys is if the global stock markets or the S & P 500 are going higher than US-Swiss Franc is going higher. But if those global equity markets and more specifically the S & P are going lower, than the US-Swiss Franc and the dollar-yen will follow. So right now we’ve got a critical support level, .9944, but our medium longterm cross, even though the equity markets have rallied, this particular Forex pair is suggesting that that could be a false rally on stocks.
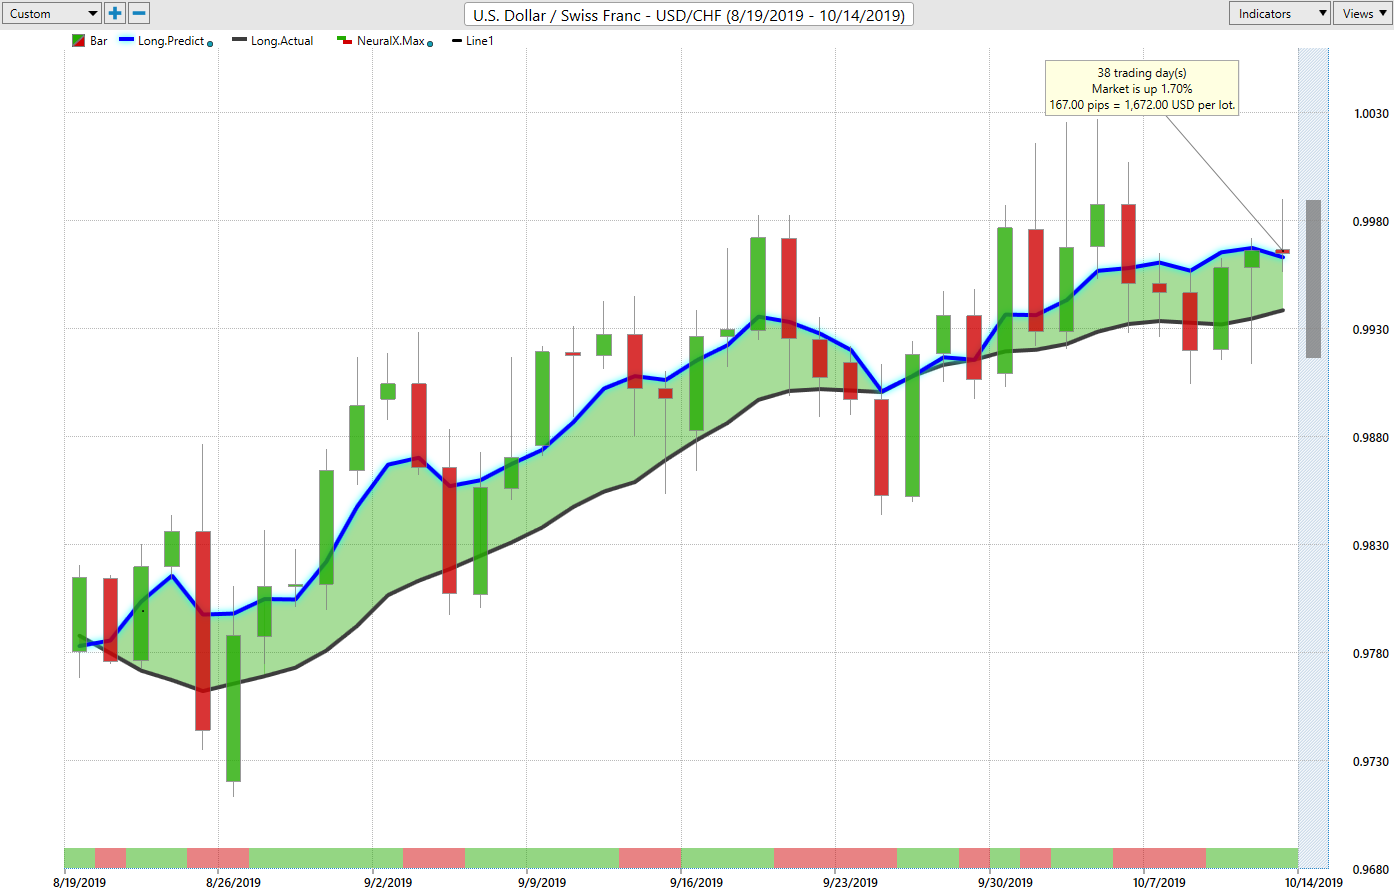
I would tend to agree with that particular trade setup, so we’re going to watch it closely, but right now we’ve got resistance up here on this line that I’ve drawn in at 1.0027. If this is going to turn bullish, guys, we must break above that level, but I will point out the global, or the overall depreciation of the US dollar shows very clearly on this particular pair and on the dollar-yen. Years ago I would be trading US-Swiss Franc at the 1.40, 1.30, 1.20 level. We can’t even hold above parity. So it clearly shows a longer-term depreciation of the US dollar, not even the interest rate differential between the Swiss and the US, which is substantial, is not enough to boost demand for US dollars against the Swiss Franc. So we’ll be watching, again, right now we’ll be watching this 1.0027 level, but we’re also going to be watching this .9945. If we break down below this level, that will tell us that the equity markets are likely going to go lower.
U.S. Dollar/Japanese Yen (USD/JPY)
We can see the same trade, which is US-Japan, is sitting up at this major resistance level, 100, or 108.34, excuse me, with an even bigger resistance level at 109.30. And now up at this 109.30 area, this is where your order flow traders will watch for most of their positioning, is up at these extreme levels up here and what I mean by that is they want to get into these levels. They want to trade at the extreme of the range, the top or the bottom, so they’re going to be targeting shorts up here, and they target longs down in this lower area, down around the area that I warned everybody about last week, at 106.95. You can see that we did end up rallying off that, so the dollar, while very, the dollar having a very bad week, it still did well against the dollar-yen, but that’s because it got the assistance from the equity markets. The dollar did not do well against the British pound or against the Aussie, or against the New Zealand, or against 80% of the Forex pairs, but it did make gains against Japan for this particular reason.
British Pound/U.S. Dollar (GBP/USD)
Now when we look at that dollar, at the British pound-US dollar, we’ve made a significant move here guys, but again, this is all rumor based. You can see we have an absolute wall of resistance up in this particular area up here. So right now if those order flow traders are getting ready to short this thing, they’re going to be looking for another rally, potentially to 1.2734, maybe even a little bit higher towards the 1.28 level, to set their bull traps. So be very careful on this because, again, nothing is really resolved with Brexit, to be perfectly blunt, and the percentage of Brexit has simply gone from 35 to 55% of it going through without any issues. So not much has changed here guys, and I’ll point that out. The indicators already are grossly overbought on this particular pair. That, of course, doesn’t mean that it can’t go higher, but it does mean we should show some caution around this, okay, particularly around the levels that I just discussed.
The Commodities Currencies
U.S. Dollar/Canadian Dollar (USD/CAD)
Now as we look at our three main commodity currencies, I’m going to start calling these ones equity currencies, too, because the correlation between the CAD, the Aussie, and the New Zealand to the global equity markets, and more specifically the S & P 500, is becoming increasingly stronger. I would say right now upwards of about 80%, meaning the S & P 500 goes up, those three currencies, the aforementioned currencies, they go up, too, meaning US-Canada lower, Aussie-US higher, New Zealand-US higher. These currencies at one point had a very strong correlation to gold, but that correlation now is moving towards the equity markets. So if the S & P 500 turns around and tanks, then US-Canada will reverse higher. Aussie-US, New Zealand-US will reverse lower. There’s at least a 50% chance of that happening, maybe even higher.
Right now we have two major zones that we want to watch. We are coming into a known significant level of support here, and that level goes all the way down to basically this 1.3133 level. One could argue an even bigger level at the 1.3105. So the buyers, always look to buy low and the sellers always look to sell high. We just identify these ranges with the verified zones to clarify this. So right now the indicators are saying we’ve got a little bit more downside, but if US-Canada is going to turn around and go higher, we need oil moving lower. There is a very strong possibility that that’s going to happen, right? Oil goes lower, US-Canada goes higher, so we’ll watch these areas very closely between essentially where we’re at right now, this 1.3205, and I’m going to tag it down to this level here at 1.3105. You’ve got this range down here where the buyers are going to be looking to come back in. We just need a signal from VantagePoint to guide us through that.
So right now our predicted RSI is that 18.8 so not a whole lot of momentum here, is there guys, not a whole lot of momentum at all, actually. So when I look at that downward momentum, I would anticipate one more move to the downside. And remember it’s a holiday thin market, Thanksgiving in Canada on Monday. Do not trade the US-Canada pair on Monday, and be careful with it on Tuesday. Look for a reversal on Wednesday.
Australian Dollar/U.S. Dollar (AUD/USD)
Okay, now with the Aussie-US, again, the Aussie is trying to push through this level, but again, this is not necessarily on-demand for the Aussie currency. This is the global intermarket correlation that’s pushing this higher, stocks higher, risk-on environment. The Aussie goes higher, the New Zealand goes higher, the Canadian dollar strengthens.
These are all the things we look for guys. Inter-market correlations rule supreme at the end of the day. So when you’re, if you’re trading the Aussie currency and you’re saying, “I’m not a stock trader,” well, yes you are. You just don’t know it. And if you’re trading stocks and you’re saying, I don’t trade the Aussie-US, yes, you are trading it, you just don’t realize it. So that is the intermarket correlation. Right now, our key VantagePoint level, 67.61. The indicators do look pretty good for advancement here, but a longer-term advancement will depend on whether the market buys into this latest trade deal. Whether some of the other issues get resolved. Brexit, the very poor relationship between Hong Kong and China. That’s not overly positive for the Aussie currency or the New Zealand currency. So we want to watch this closely, but the main thing is to understand that it’s very similar or the same trade.
New Zealand Dollar/U.S. Dollar (NZD/USD)
We can see that New Zealand is up against a very strong verified resistance zone. That verified resistance zone coming in at .6348, we’re failing at that level. You can see we’re all stacked up here. So we’re looking for a break or a catalyst to push this higher. That catalyst will be, it’s either going to push it higher on the global risk environment, global growth expanding, or it’s going to fail and we’re going to see a risk-off scenario and the market saying that we’re not buying into Brexit is going to be resolved, we’re not buying into the US-China trade talks, we’re not buying any of this. And we move back into a risk-off environment that would be very negative for both the Aussie and the New Zealand, and indirectly the Canadian dollar also.
So with that said, this is the VantagePoint AI Market Outlook for the week of October the 14th, 2019.


