


Welcome to the Artificial Intelligence Outlook for Forex trading.
VIDEO TRANSCRIPT
Hello, everyone, and welcome back. My name is Greg Firman, and this is the Vantage Point AI Market Outlook for the week of
October 1st, 2023.
U.S. Dollar Index ($DXY)
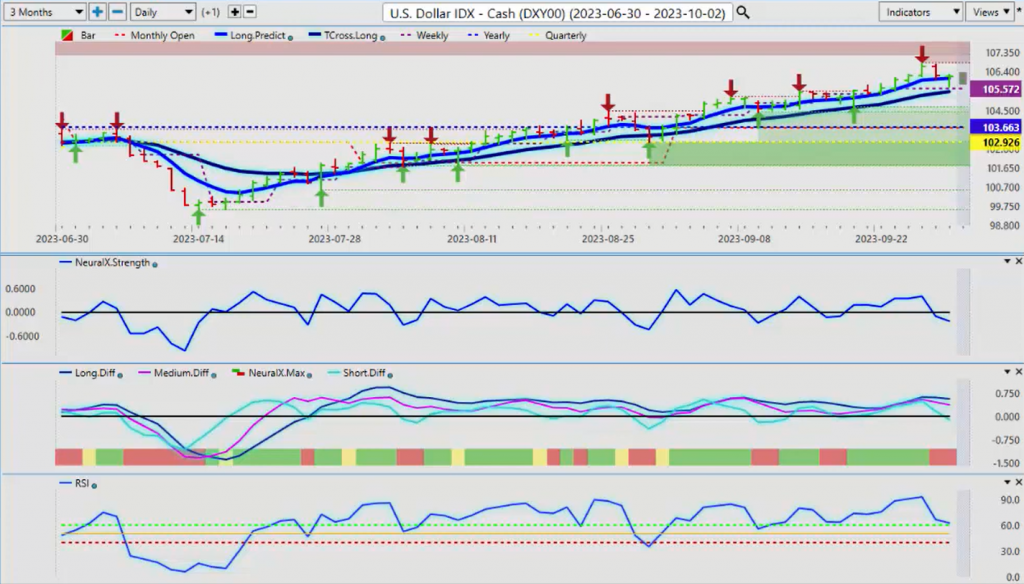
Now, to get started this week, we’ll begin with the U.S. Dollar Index. Again, all eyes will be on the dollar next week with the non-farm payroll number. But again, as discussed in many of these weekly outlooks through the month of September, the dollar usually peaks around October 10th, approximately. So, I think we’ll have one more period of dollar strength leading up to the non-farm payroll number. Then, about 80% to 90% of the time, the dollar sells off on the Tuesday after the nonfarm payroll number. So, just a reminder, this is the end of the U.S. fiscal fourth quarter. That’s usually when we see the dollar turn lower, like we did last year.
We see gold moving higher, equities moving higher, a number of currency pairs moving higher against the U.S. Dollar. So, let’s look closer at this, the Dollar Index. Here, we can see we’ve got a new verified resistance high that’s coming in at 106.50. This very often happens, guys, in the end of September. We can see something very similar again last year. And what they’re doing is they’re just simply flushing the market out of anybody that’s basically trying to short the dollars. So, they run it up higher. They get every all the shorts out of there, and then mysteriously after they’ve done that, the dollar turns.
So right now, our T cross long for next week is 105.41. That’s our key support level now. Just remember again, this is the end of the third quarter for most asset classes, but for the U.S. Dollar, it’s the end of the fiscal fourth quarter. So, but again, in next week’s presentation, these quarterly opening prices are going to change. So, where the dollar is closed on Friday is very interesting. It’s 106.17. In my respectful opinion, we would have to hold above that level for the dollar to remain strong, and that is incredibly unlikely despite what the FED does because, again, the Fed was Ultra hawkish last last year, continued to hike through the early part of 2023, and the dollar still had not made any new highs since October of last year when we look at the chart, it’s clear as day.
So if the FED is super bullish at this particular time and all of the arguments on dollar strength are solely based off of interest rates, then that theory is debunked when we actually look at the physical charts. The Vantage Point indicators, our neural index strength, which again is rapidly becoming one of my favorite tools, it clearly warned us that the dollar was turning, and that was back on Tuesday, Wednesday of the past week.
So right now, we’re looking for the dollar to hold below 106.17 and ultimately break below the Vantage Point T cross long at 105.41.
Gold
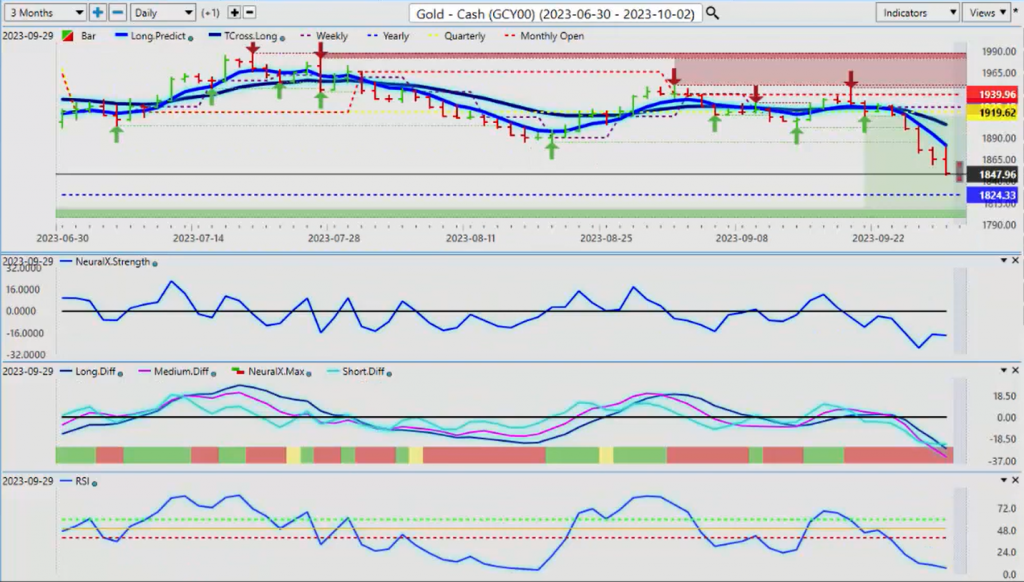
When we do a comparative analysis, the confusion again, most analysts, including myself, fully expected gold to go lower in the month of September, but what I’ve stated I think that misinterpreted or not understood is that gold usually bottoms out in the last 5 years. Gold has been 80% bullish from about October 5th to September 28th. I could even argue right through. You still have your normal daily ranges, your pullbacks, but ultimately the dollar goes lower and gold goes higher. So yes, we all know gold that was going lower in the month of September, but it’s the looking for that bottom is what we’re looking for. So again, gold remains bullish on the year. The yearly opening price is 1,824.
It does not officially enter into a bear market unless we break down below the calendar year opening price. The last thing we want to be looking at is rolling performance, random 30 days, random 5 days. It’s very misleading as you’ve seen with a number of these stocks.
I’ve illustrated over the last several months, but more specifically last week, Tesla. We look at the high correlation Tesla has to the S&P 500. We pretty much know based on the seasonality that the S&P 500 is going to move low, and it will likely pull Tesla down. Now, this coming week or over the next couple of weeks, Tesla could again now be along. Now that we’ve pulled back. But again, when we look at this, we have to make sure we understand where the difference between bullish and bearish or a trend and a corrective move higher or lower. This is a corrective move lower in Gold, not a new trend here, guys, until we break 1,824. You remember back in March when they said the S&P 500 is officially in a bear market, and in actual fact, it wasn’t. It was holding above its current yearly opening price. But analysts use that rolling performance model, and they get caught with that lagging indicator.
So right now, 1,824 or this coming week, we’re likely to see a bottom in gold, and we’re looking to buy it, as per several of the last weekly outlooks, which I’ve clearly outlined. That again, gold is 80% up, I would argue 100% bearish in the month of September, but it’s not 100% it’s not bearish in October, November, and particularly December. So we’ll continue to monitor this, but the Vantage Point indicators are bottomed out. Anybody who was long gold, they’re just flushing them out, and all of these losses occurred in 3 days, guys. And that’s a classic sign of a reversal, a pending reversal. So keep an eye on that.
S&P 500 Index
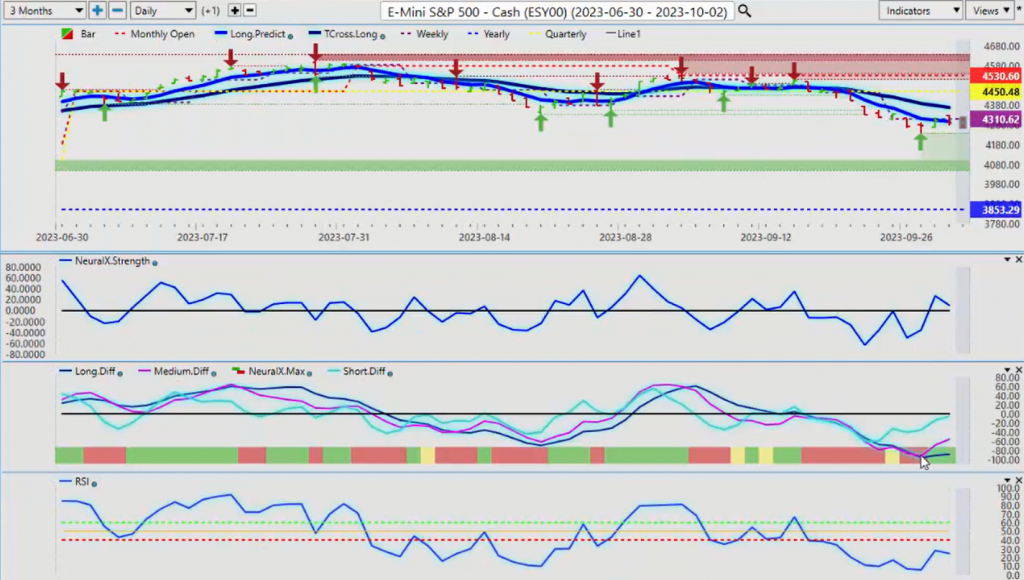
The S&P 500, good indicators here in Vantage Point, warning us not to buy into the bear market theory and the sky is falling, all this stuff. I’m certainly not saying that stocks are super bullish here, but they are well above their yearly opening price at 3,853. It is not in a bear market. We need to make sure we’re not getting caught up with some of these analysts that, again, are using different tools without actually looking at the primary trend in 2023, which is for the equities, surprisingly, is still up. So we’ve had our corrective move. The dollar turns. Gold goes higher, S&P 500 goes higher. The indicators from Vantage Point are clearly warning us of that. But remember, that dollar cycle at the beginning of the month, where, in the last thing we want to ever do, guys, is track impulse buying and selling. We want to track institutional funds. They are required, in my respectful opinion, only to buy dollars at the beginning of the month. But when they stop, the dollar very often turns. So, I don’t think that anything has changed here. The fact that we’ve had nine or 10 consecutive weeks of dollar strength is a big enough warning sign for me that really nothing has changed. The seasonals are still in play, all these things are still happening. So, right now, this is warning of some of further equity strength. Now, again, the quarterly opening price is going to move all the way down to the closing price here, which is 4,288. So, if we can hold above 4,288, then that will see the equity markets rise.
But I’m not looking for a big move up on stocks until again about mid-October, about the 10th. But again, a warning sign with gold too. If we’ve closed the week on these gold futures at 1,848, gold would have to remain below 1,848 to continue that bearish momentum, which is incredibly unlikely when you look at it from a fundamental standpoint. Gold goes up 80%, 90% of the time in any recession or pending recession. If you’re betting on gold shorts, then you’re betting, you’re basically banking all your money in the U.S. dollar, and we know how that’s turned out if we look at the dollar index over the last 30 years, and we look at gold over the last 30 years, clearly, the horse that we want to back is not the U.S. dollar. It’s gold. So we’ll continue to monitor that.
Light Sweet Crude Oil
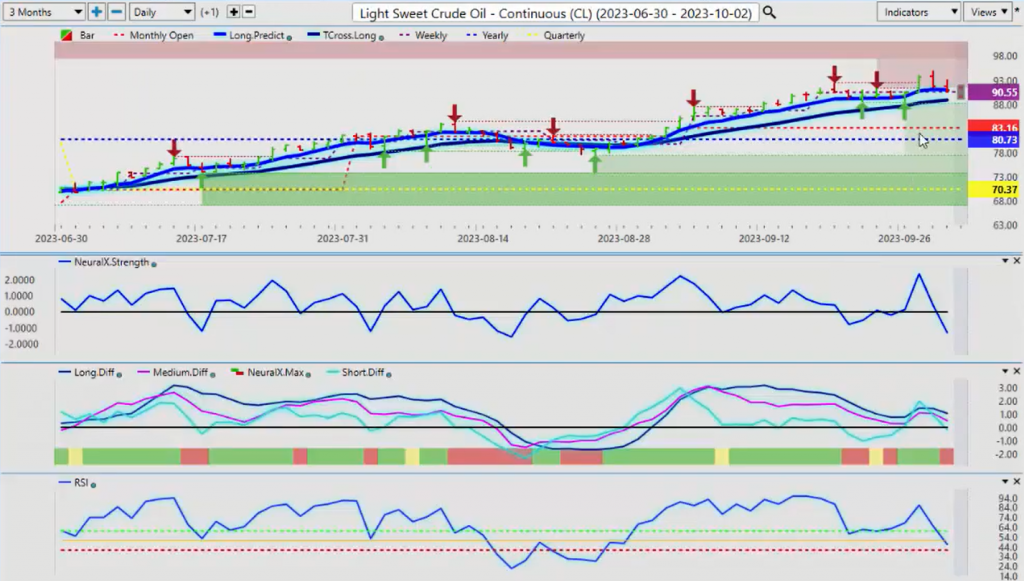
Now, when we look at light sweet crude oil for next week, again, oil still holding these gains, but again, we’re running out of buyers up here, guys. So right now, it’s the new quarterly opening going into the fourth quarter here for oil. Those prices oil is going to have to maintain above the 9079 mark to hold this bullish momentum. And again, very unlike, possible but unlikely, going into because, again, we’re seeing a very warm season here, a warm fall in Canada and the U.S. So not a lot of demand for oil. But it could still move higher. But the indicators in Vantage Point are giving us a clear warning sign. The neural index strength is really adamant. And you can see that the big slope down on here while the main neural index was green, the neural index strength gave us a two-day warning to that we might want to think about exiting longs here. So our T cross long there is coming in at 88.87. But the 90.79, the new quarterly opening price is really the one you want to watch here, guys, because, again, we’re matching the AI predictive indicators with standard price. We don’t want to get caught up in Fibonacci and waves and all this wild and wacky voodoo. We want to make sure we’re staying focused on who’s in charge, the bulls or the bears. So oil is definitely going to have its work cut out for it to hold on to these gains at this particular level.
Bitcoin
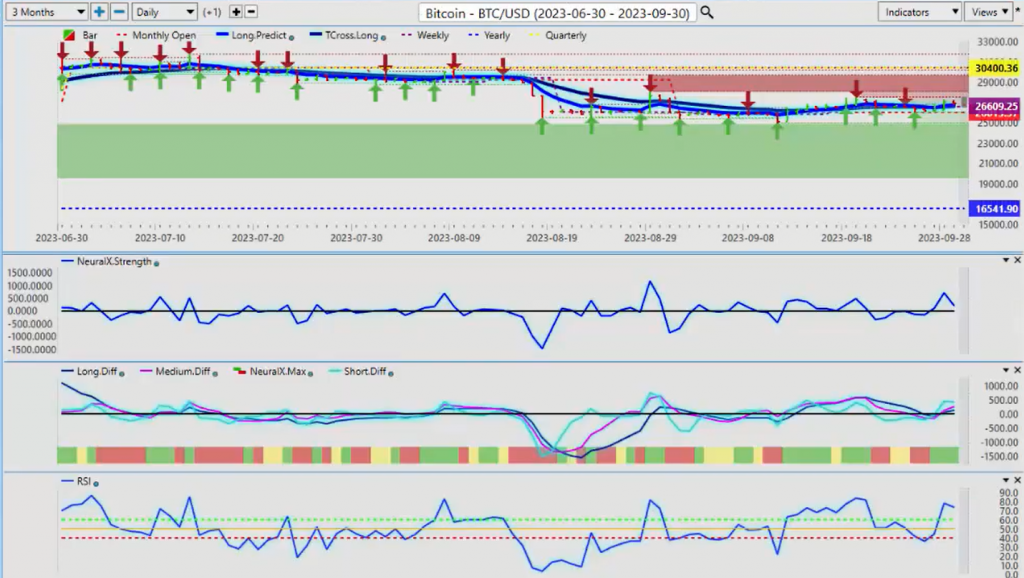
Now, when we look at Bitcoin historically, from a seasonal standpoint, I can’t remember in August, or excuse me, in October in the past, where I have not bought Bitcoin in the month of October. Very strong seasonal pattern here. And once again, despite this excessive dollar strength, they could not push Bitcoin any lower. It’s been running flat. The indicators right now in Vantage Point are warning the predicted short, medium, and long-term differences are all pointing higher. You’ll notice this slope down in the neural index strength and the predicted RSI that, yes, we’re likely to still see a little bit more downside until we get past that period of known dollar strength between the beginning of October and until the week after the non-farm payroll, which is a week this coming Tuesday. So I would watch very closely for anything related to Bitcoin or blockchain for potential longs, because, again, that seasonal is still very strong. And just by looking at this chart, we can see we have absolutely no sellers here. And the more the media comes out and tells you that Bitcoin is a scam, Bitcoin is — they already said Bitcoin was supposed to be at 7,000 this year. And the Vantage Point software clearly, and using a current yearly opening price, not a rolling performance model, that’s what led to people shorting Bitcoin in March when they shouldn’t have been. They should have been using that weakness to buy it as it held above its current yearly opening price. So don’t get — don’t get caught up in the media or junior analysts trying to figure out which way the market’s going. We’ve got bullish momentum coming in, no — no, we don’t, now we do, now we don’t, flip-flopping back and forth. Follow the predictive indicators and follow the seasonal patterns and use your current quarterly, weekly, monthly, and yearly opening prices as leverage points. So again, the Bitcoin, the new quarterly opening for Bitcoin, is going to come in at about 26,903. If we’re holding above that, and we’re going into a strong period of known strength in Bitcoin, you want to look for longs here, guys.
Euro versus U.S. Dollar
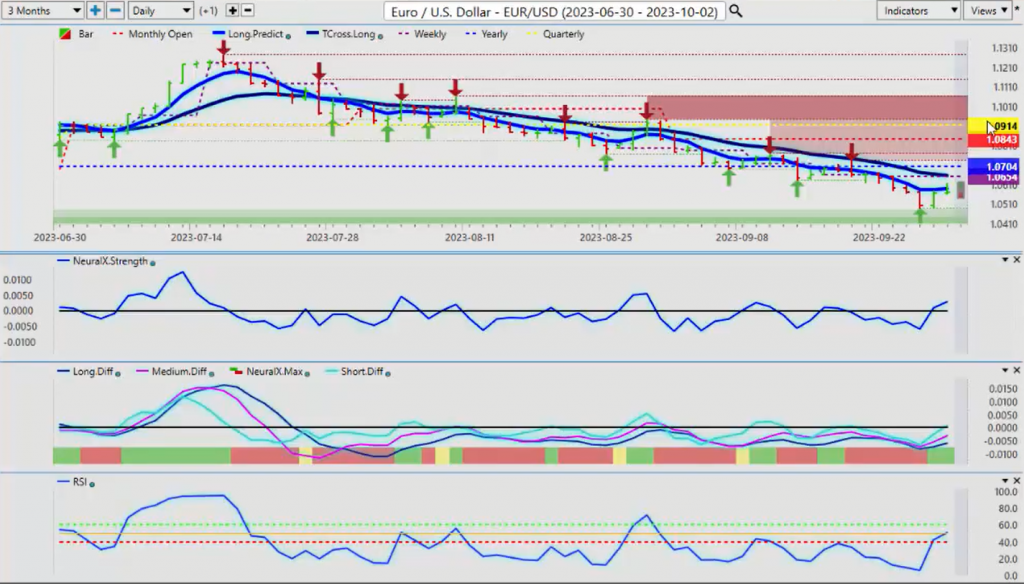
So when we look at some of our Forex pairs for next week, again, a classic reversal, a classic bear trap on EUR/USD going into Thursday, Wednesday and Thursday trading. Now, our main indicators, I’m looking for the predicted RSI to break above the 60 level, but our MA diff cross, our neural index strength, guys, once again, I really do want to highlight what a fantastic job Vantage Point has done with this particular indicator, because the second I saw this, I immediately exited any shorts on Euro/USD, knowing that the dollar is likely near the end of uh its strength for this year. And the dollar will still go up and go down, but its primary big move is likely coming to an end very soon. So, despite all the fundamentals of how the ECB is not hiking anymore, one and one, it’s not really going to change anything when it comes to seasonal patterns. So, right now, we can see our neural index strength is moving higher. But again, all of your Forex trades, in my respectful opinion, at least on the G7 pairs, are all based on one thing. Either you’re buying or selling US dollars. The first thing the trader has to do is make a decision. And again, this is the basis of intermarket technical analysis: are we are we is gold getting ready to turn higher? Probably. Is equities are they likely to see some signs of life in the middle of October? Yes, they are. Uh, you’ve got all — Bitcoin going higher, all of these things point towards weakness in the US dollar. But the dollar is affecting the major markets the same way. So, with the Euro, uh, I again we’re going to be setting the bar very very low here, because our new quarterly opening price is going to come in at about 105.74. So in my respectful opinion, counter-trend longs are potentially in play here. Uh, we just need to, again, get past that first week.
U.S. Dollar versus Swiss Franc
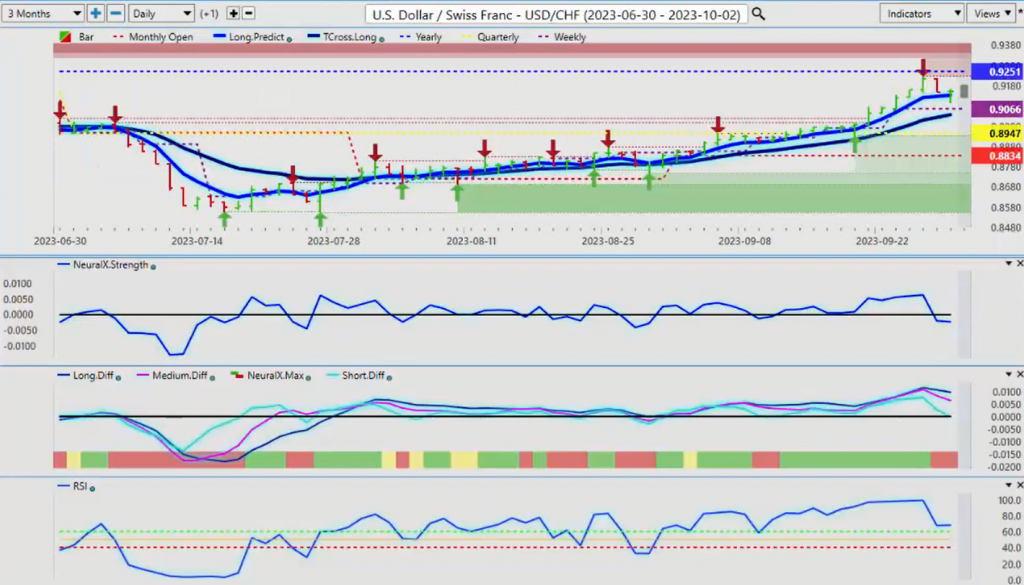
We can see something very similar again happening in US Swiss franc. We approach, and this is the best POS, one of the best I’ve given multiple examples of this. But again, guys, the rolling performance model, the last 30 random days, the last five random days, the random 365 days, it’s a lagging indicator, guys. There is the current yearly opening price at 92.51. We hit a high of 92.25, and this pair dropped like a wet bag of cement. But the average trader never sees it because they’re, again, trying to gauge performance from that lagging model. So right now, we’re looking — we’re going to be setting the bar even even lower for longs here, because the closing price at 91.52. That’s the new quarterly opening price. Uh, in next week’s presentation, the Vantage Point point in time tool will move all of these automatically to the new quarterly opening, and again, it’s the fourth or the first fiscal quarter of the US. The US dollar seldomly does well. So, again, they’re already getting out of Dodge here, guys. But using that yearly opening price allows us to clearly define that this was never in an uptrend. It’s simply correcting higher, but it was a very, very good long trade, but it’s only a short-term trade. In order to stay long at this time of the year, I would need to get above 92.51 on the yearly opening price. Current yearly opening price and stay above that before I would bite on longs. The probability, as I warned everybody last week, there’s likely a bull trap setting up in the US dollar. And I’m sure a number of people got caught in this. Now, the pound-dollar, again, there’s not a whole lot of fundamental positive fundamentals we can say for the UK. But once again, guys, here, we trade what we see, not what we hear. That is the one of the phrases that was coined by one of the students in the V Point live training room. And I love it because that’s exactly what we should be doing. They’re being taught to stay away from looking at these rolling performance models, keep your current yearly open. I could care less, guys, what happened last year in 2022 and 2021, in I’m looking at the current calendar year. We’ve got enough to deal with in the current calendar year without going backwards into those years. The only thing we use those years for is the seasonal pattern, right?
British Pound versus U.S. Dollar
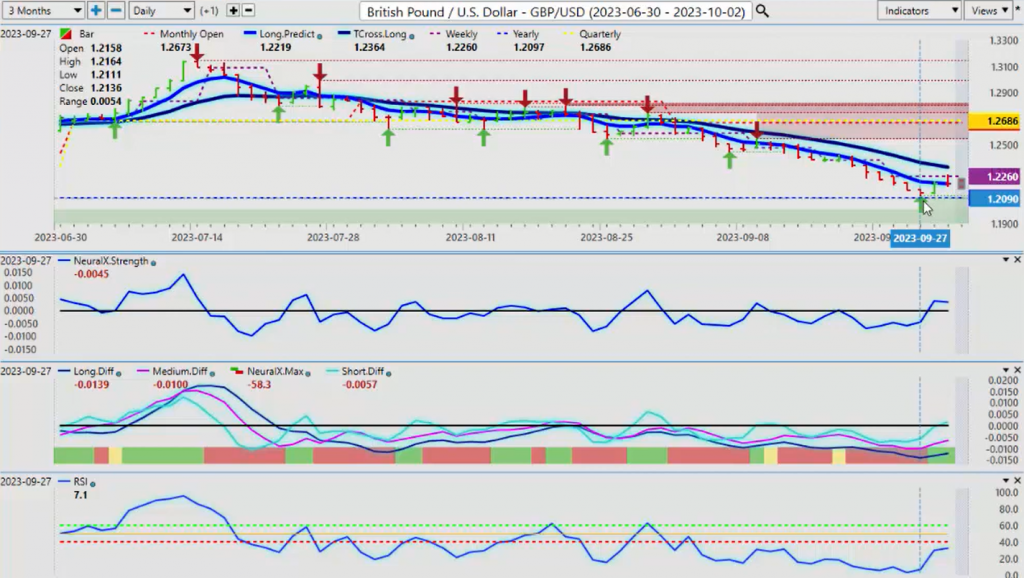
So when we look at the British pound, we have stopped dead. It is impossible for me to script something like this because I talk about it every week. So, the yearly opening price here on the pound-dollar is again 126.86, right? We agree. So, the market comes down. The sorry, excuse me, the yearly opening price is 122.97. That’s my, sorry, and we came down to 123. We hit a low of 121.11. We basically got within 10 pips of the yearly opening price, and it just shot out of there like a cannon. Doesn’t mean there isn’t more downside, but we’ve got to clear above that. The Vantage Point T cross long. But again, what you can do is look, and this is another way of using seasonals and saying, okay, when did the British pound US Dollar bottom out? Well, it bottomed out on October the 11th. That’s exactly when I’m saying gold will rise, the Euro will, the dollar will fall, and most other markets will gain off of that dollar weakness. But this happens very, very often. So, the seasonal pattern in October, long and short, doesn’t really favor the US dollar, so it doesn’t favor continuing to short the British pound. And the fact that we couldn’t get below that current yearly opening price is exactly what we’re looking for. The Vantage Point indicators, the neural index strength pointed this out on Wednesday that this was turning. But the very second we couldn’t close below that yearly opening price, I immediately executed longs, and they’re instant winners. But if I was using a random 365 days or say a random 30 days or 5 days, then you would say, well, this is super bearish on the British pound. But it’s not. And again, we’re not chasing price, bullish one week, bullish momentum coming into the one week, bearish momentum back and forth. We don’t want to play this game, guys. We want to identify whether something is in an uptrend or downtrend. So the British pound has been moving lower since basically July, so it’s been moving, correcting lower in the primary uptrend. We can’t say something is in a downtrend when it’s positive on the year. This is exactly what I stated back in March. Don’t buy into this methodology, guys, because it’s misleading. It’s lagging. Right? So, if we can hold above this level, then we know we’re still long on this particular pair, despite what these media pundits keep trying to sell us.
U.S. Dollar versus Japanese Yen
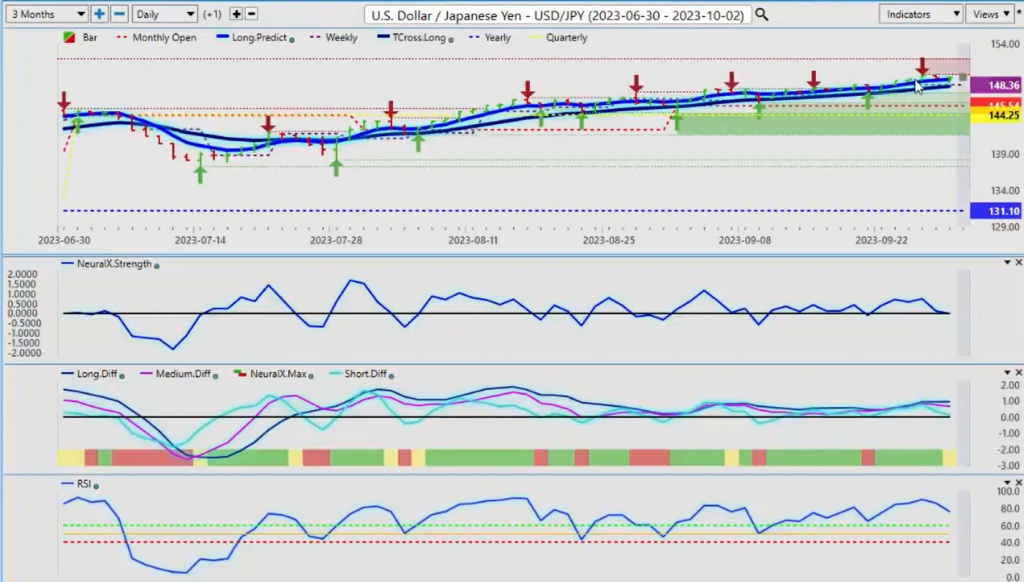
The British, or the US Japan, once again, the dollar should have easily have been able to hold its gains against this because of the carry trade. And it couldn’t. It started selling off also. So we can see that right across the board on Wednesday, Vantage Point clearly warned us that, stop buying dollars. Take a look at the equity market, some of the other markets. But right now, the carry trade is likely to support the dollar here, but I, this is going to be very, very difficult because the new quarterly opening price is going to come in at about 1.4936 for the fourth quarter, and that would mean in order to remain bullish on this or buying this pair, I’m going to need to hold above that. And the Vantage Point indicators right now are not in support of that in the least. They’re rolling over, a neural index. As soon as that neural index strength breaks that zero line, I believe the dollar will be in trouble. But I also believe they do need to buy US dollars in that first week of October. But again, once you get to the end of next week, I would respectfully submit we would start looking for dollar shorts, much, much closer. Now, the US Canadian pair, choppy. Once again, the Monday, Tuesday reversal that I’ve talked about, we can see that we go down on Monday, and then it turns around. It goes right back up. So to finish the week here with US Canada didn’t fare well, moving higher. Still some dollar strength there, closing the week at 1.3536. So again, we will continue to monitor this pair. But once again, that yearly opening price, 1.3551. For the average person, including me, this is invisible support and resistance that most people never look at. In the earlier part of my career, I definitely looked at the rolling performance model, the r, what has it done the last 30 days, the last 5 days, the last 365 days. But I kept getting wrong, false signals from that, and hence the birth of the point in time indicator, where it takes the current weekly, monthly, yearly, and quarterly opening price, so we’re not getting caught with these lagging tools. Right?
U.S. Dollar versus Canadian Dollar
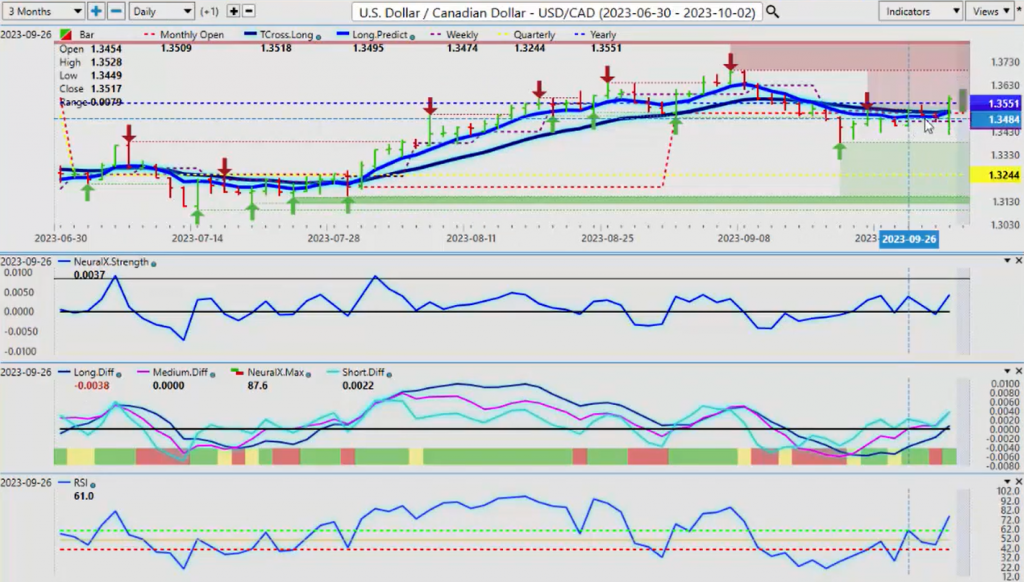
So for US Canada to be bullish, we need to maintain momentum above 1.3551, and even on dollar strength, I believe that that is still possible because again, the Canadian economy is likely in recession now, to be perfectly blunt, and if not, it will definitely be heading in that direction. And on top of everything else, to forewarn everybody, covid-19 has reared its ugly head in Canada already. The social distancing nonsense has started up. The masks potentially are coming, but covid-19 is spreading here, so that is another. We saw what happened before US Canada went through the roof during covid-19, and when you go back and look at those longer-term charts. So this could keep upside pressure on US Canada, but either way, 1.3551 is the level you want to monitor here, guys.
Australian Dollar versus U.S. Dollar
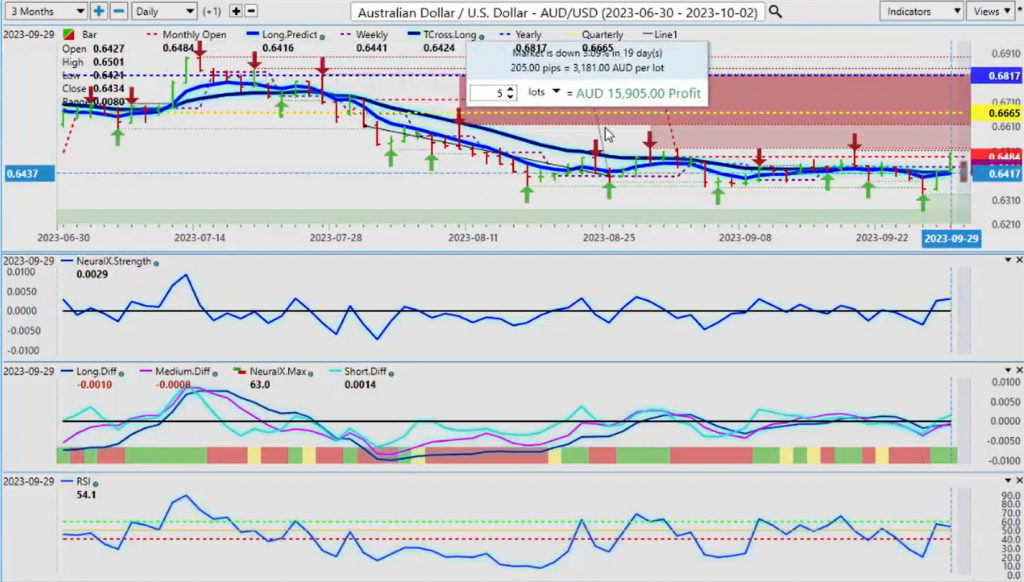
Aussie US, as talked about last week, if those stocks turn around, then the Aussie will turn around with them. You can see as soon as the S&P 500 turned back to the upside, the Aussie immediately followed, as discussed in last week’s presentation and many before that. So right now, we are going to set a new quarterly opening price on the Aussie, and again, I think the Aussie has had some pretty darn good moves here, but we could see further upside. My concern again is, is covid-19 going to start up again globally or is it maybe just Canada with the cold weather? We’ll see, but we’ve still got to be careful, but the indicators here are clearly bullish on the Aussie, but again, the yearly opening price, 0.6817. The good news is again, this yellow tool right here, which is the quarterly, the current quarterly opening price, is going to shift down to 0.6434. So, 0.6434, your new quarterly opening price. I believe we can hold above that, and again, a quick way of looking at seasonal patterns is again, you can see that basically all of these currencies and gold bottomed out by October the 14th. I don’t count silly waves. I don’t get into Fibonacci. I trade what I see. I trade based on inner-market correlations. These are, this is science, guys, right?
So again, seasonal patterns combined with AI technology is some of the two of the most powerful trading tools that I have seen. And again, I’m not overlaying a sequence of numbers on things. I am not at all interested in tracking impulse buying and selling. These are the worst traders. Again, retail traders, no offense. We want to follow institutional funds. When are they buying dollars? When are they selling dollars? When are they buying gold? When are they buying oil? And that leads to other multiple, multiple other trades.
New Zealand Dollar versus U.S. Dollar
We can see that the New Zealand is basically the same trade as the Aussie, and it’s moving up too. So again, these two currencies are warning that potentially stocks are getting to rise, the dollar is getting ready to move lower, gold‘s getting ready to go higher, Bitcoin‘s getting ready to go higher. So again, we’ve got opportunity here, guys. We just need to make sure that we’re getting out in front of it. We have a plan, and we let the market come to us. So with that said, this is the Vantage Point AI Market Outlook for the week of October the 1st, 2023.


