


Welcome to the Artificial Intelligence Outlook for Forex trading.
VIDEO TRANSCRIPT
Hello everyone and welcome back. My name is Greg Firman and this is the VantagePoint AI Market Outlook for the week of October the ninth, 2023.
U.S. Dollar Index
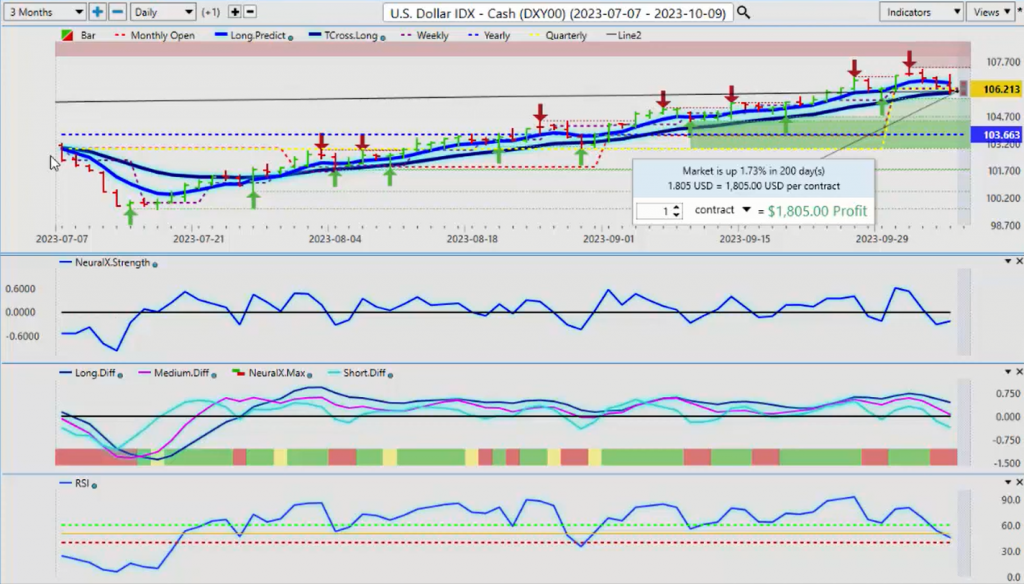
Now, to get started this week, we’ll begin with the US dollar Index. Now, we’re coming off the non-Farm payroll number, which I’ll elaborate again in my respectful opinion only of that labor report, was actually not a great number. Again, I’ll talk more about that in a minute, but let’s look where the dollar is on the calendar year. Now, right now, again, we want to make sure that we’re not getting involved with chasing markets with rolling performance. We want to look at where we’re at from a seasonal standpoint and where we are in the calendar year, the dollar is up a mere 1.73%. So again, guys, when we look at this, that tells me the dollar, again, is nowhere near as strong as what they’re suggesting.
But I don’t want to get involved with the last five days, the last 30 days, the last 90 days. I want to look at where I am in the calendar year and then I can apply my seasonal patterns to that. The seasonal pattern here, as I’ve discussed over the last few weeks or the last few months for that matter in the VantagePoint live training room, is that this is probably one of the worst times of the year for the dollar going into the calendar year in which usually the other markets benefit from. So when we look closer at the unemployment number from Friday, the dollar, initially out of the gate, rallied; but it rallied based on a household survey number, the U-3 number, which basically looks at essentially the last four weeks. That’s it. So when we look at the U-6 number and we do a comparative, which again confuses me why the Fed is not looking at the same thing.
If we go back to September 2022, we’re at 6.7%, but if we look at August 23, we’re at 7%. This is actually going the wrong way because we’re looking at the real unemployment, as you can read, total unemployment plus all persons marginally attached to the labor force plus total unemployment, part-time for economic reasons as part of the civilian labor force, plus all persons marginally attached to the labor force. So we get a better insight into what this labor report really is. Now, the unemployment rate did not go down, the numbers from August were revised up, but again, based on a household survey number, and if the situation was as strong, is what the Fed is trying to spin here, then these numbers would look very different. So again, in my respectful opinion, looking at the labor rate, participation rate, average hourly earnings, it was not a great labor report at all.
And the U-6 is the way, at least, I will look at this and say, “Okay, are things moving in the right direction? The answer is no, they’re not.” So again, that’s something we want to look at. So when we do that in comparative analysis to the dollar index and the seasonal pattern that I’ve discussed over the last, well, throughout this calendar year, that the dollar is always strong in the first week of the new month, then mysteriously, regardless what that payroll number is, the dollar very often sells off mysteriously. So we are in a holiday short week next week, it’s Thanksgiving in Canada. I believe it’s Columbus Day on Monday in the US. So by midweek we would be looking to see if this seasonal pattern will take hold and the dollar will sink once the market has had more time to actually digest that number.
So when we look at it right now, again, this really does matter that the dollar is really almost flat on the year, and I would argue we were in a very similar situation in March of this year where they said, “Only buy dollars, don’t buy Bitcoin, don’t buy oil, don’t buy gold, don’t buy stocks.” All of which was horrifically wrong. So again, we want to remember what happened back in March and apply the data. So if we look at the indicators, in VantagePoint right now, we are moving lower. Our neural index strength is somewhat sideways. I do anticipate initially, out of the gate, the dollar would be strong on Tuesday, but it’s Wednesday and Thursday of next week. We want to keep an eye on this because again, I think that once they look closer at this labor report, I’m certainly not betting on the US dollar based on the U3 number, on a household survey number or any revisions to that number.
I will always go and look to see if the unemployment rate went lower, it didn’t. Did the U-6 go lower? No, it’s going higher. It’s slightly lower from the previous month, but from September 22 to now, again, only in my respectful opinion, I feel it’s going the wrong way. So these indicators and VantagePoint are picking up on that. And again, when we look at the beginning of the week, you can see, right out of the gate, the dollar rallies. And then by the Monday, Tuesday reversal, long before that payroll or ADP report came out, the dollar was moving lower.
Magna International Stock ($MGA)
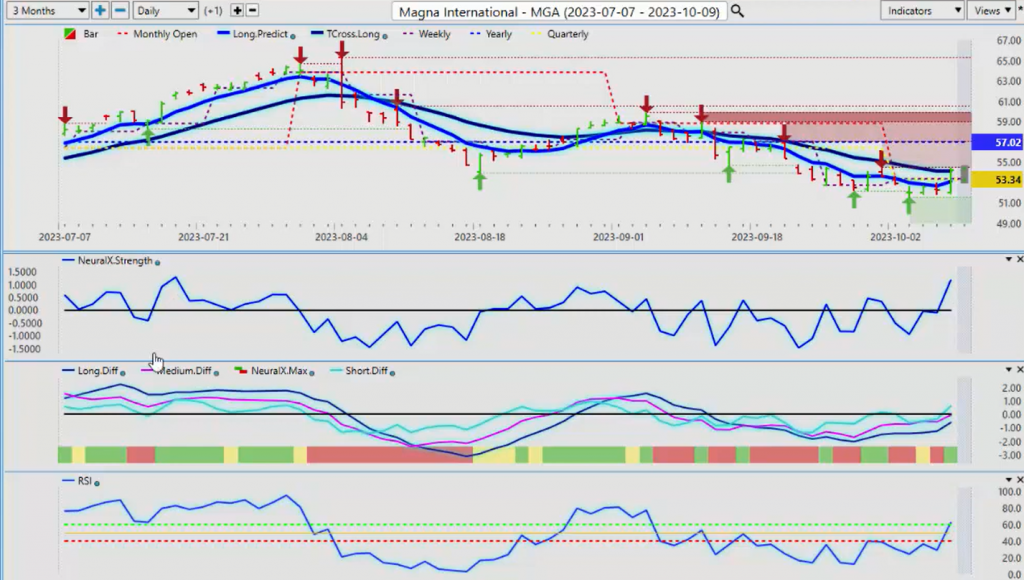
So again, one of the tools that I’ve used over the years using some of the additional indicators and VantagePoint to identify these intermarket correlations, I look at Magna International stock, there’s about a 92% inverse correlation. So I’ve been watching the Magna stock, the MGA stock, this particular week, and this is exactly what I’ve been looking for, for this stock to start rising.
The neural index strength confirmed what I already thought, that the dollar will likely not hold these gains, but I look to the VantagePoint indicators. Now, this is showing momentum on this particular stock. Now again, when we look at that, the neural networks are able to pick up on these inverse and positive correlations. And this inverse correlation, using the bull bear gauge in the VantagePoint software, I noticed this about two years ago and I’ve been monitoring it ever since as a reversal or a contrarian indicator. So as long as this stock is moving higher, then that tells me the dollar may not be what it appears to be. Now, the additional tool that we want to bring into this when we’re looking at the dollar index is an accurate quarterly opening price. So for the dollar to remain bullish, again, we’re starting a new quarter here, we don’t want to get involved with rolling performance guys.
It’s extremely misleading and it’s lagging. I’m a happy buyer of dollars, as long as we can hold above 106 21. If we can’t, it’s confirming that seasonal pattern in the dollar is that it’s going to weaken. I can’t remember any year on record, even last year, where I was buying dollars after the middle of basically October. And November was even worse, but December, again, is not a month I’m looking to buy in that US fiscal first quarter. Most people don’t realize that the US fiscal fourth quarter ended on October the first. So again, for next week, if we’re holding below 106 21, then that’s confirming that the dollar is likely peaked on the year just like it did last year, guys.
SPDR SPY ETF ($SPY)
When we do a comparative analysis looking at an accurate view of the performance of the SPYs, we’re up 12% on the year guys, and again, we get all caught up in this rolling performance.
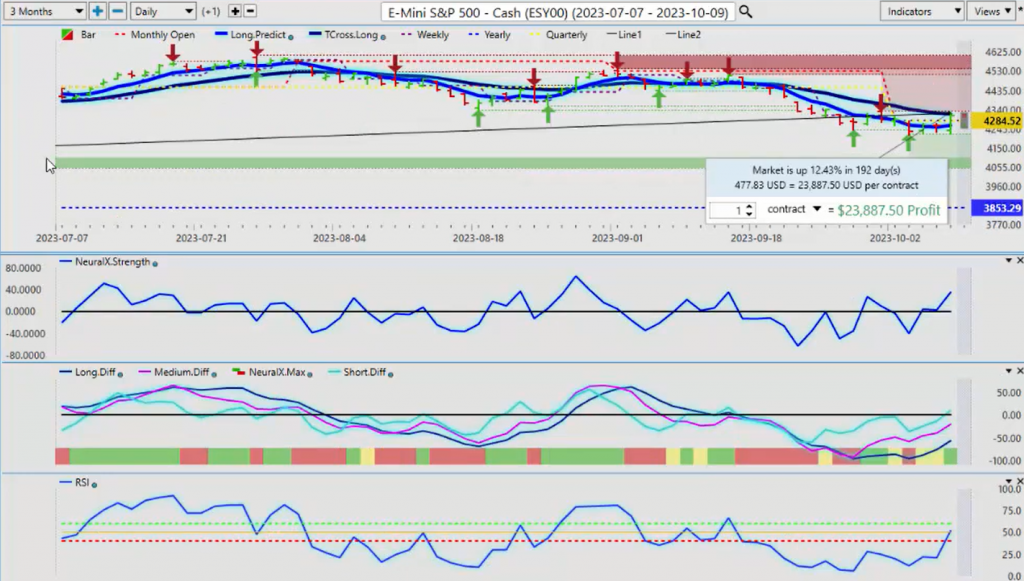
One week they’re saying, “We’ve got bullish momentum coming into the market.” The next week they’re saying, “We don’t have bullish momentum.” Well, pick one. Which one is it guys? Right? So when I look at it from a year-over-year perspective, to be clear, I fully endorse, I’m not interested in buying necessarily treasuries, but in Canada at least, we have high interest savings accounts that are not locked in and are paying for anywhere between four and 5% per year. Absolutely take the low hanging fruit guys, for sure, but always understand where we are in the stock market. And so the SPYs is up 12% still on the year. The S&P500 still up, 12.5% on the year that grossly outperforms T-bills and even high interest savings accounts. But again, it hasn’t been easy, let’s just say that, but I encourage to go where the money is going.
So right now, when we look closer at the S&P500, we are looking for the dollar to turn down. If it turns down, then I am absolutely still going to at least diversify some of the portfolio into the stock indices. It makes sense for me to do that. But for now, I’m also going to leverage that quarterly opening price using the point in time indicator from VantagePoint. That’s 4284. So I have a line in the sand that’s indiscriminate. I don’t care what the last five days or 30 days or 365 days in a rolling performance model because it’s not relevant to anything. It’s consistently produced false and lagging signals. So when I say I can definitively say, “Okay, I have no bias either way, but if I’m holding above the quarterly opening price on the S&P500 and I’m holding below the quarterly opening price on the dollar index, then I’m going to also take this particular low hanging fruit.”
But again, I am a happy seller of the S&P500, providing we can consistently hold below 4284. And on the SPYs, again, when we look at it from an accurate standpoint using the current yearly opening price and more specifically the current quarterly opening price, then we can identify this and say, “Okay, 426 62, we’ve closed moderately bullish at 429.” So as long as we’re holding above that level, then that gives us, again, a very simple methodology; is that, okay, we’re going into the fourth quarter. If we can hold above this, we’ve got upward momentum, right? So when we look at this right now, another example of using the current yearly opening price and avoiding lagging, rolling performance models is that there is no support here, guys, other than the yearly opening price.
Gold
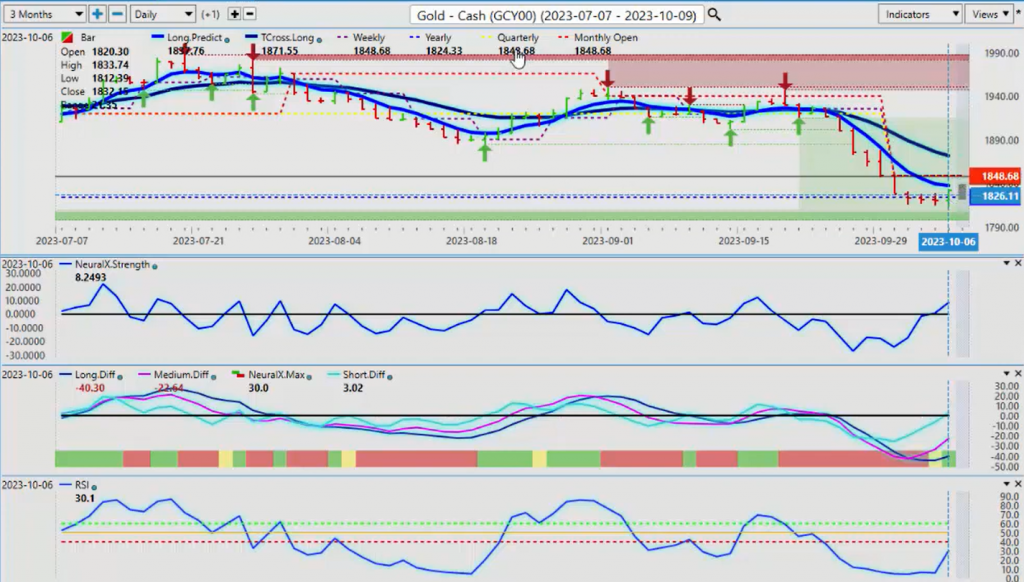
And again, gold is a slightly different animal here. The quarterly opening there is 18 48. So I could take the position that, okay, we’re holding above the yearly opening price if I can… Or I could say, okay, I’m going to stand down here for now and I’m going to put limit orders just above 18, the monthly opening or the quarterly opening at 1848, and I know that once I get above that, that will confirm that the dollar is moving lower, Magna International stock is moving higher, S&P500 is moving higher. So I can connect the dots between these inner market correlations, and I have no bias either way.
If you want to go long short, I’m all for it, but I need a plan, and it must be a plan based on price action, intermarket correlations and the current trend. The current trend, in gold has clearly been up in 2023. So this is a good corrective move that I saw basically the same thing last year, and that’s one of the arguments that I’ve made is that, well, we basically bottomed out on October the 20th of last year, and gold started to rise. Now, was the Fed hiking interest rates in January, February, March, April, may of this year? Yes, he was. So again, we can make that argument about the Fed and hiking rates. And again, looking at the labor report, I’ll look at a number of different tools here, guys. I look at the inverted yield curve. Strike one.
The economic data that’s coming out is clearly showing contraction. That’s strike two. And then we have a pending recession, I believe that’s strike three. So in that particular scenario, good, bad or indifferent, right? Or it’s not about being right or wrong here, guys, it’s just understanding that gold usually goes up in a recession. And when I look at the accurate labor report from Friday using the U-6 number, labor rate participation, average hourly earnings, I’m scratching my head saying, “How is that a bullish? How is that a good labor report when the U-6 is now at 7% versus 6.7 the year before?” So again, yes, the gold could crash lower, but the main thing is we need to identify these levels that in actual fact, one could argue that this is a premium long down here. But again, I’m a happy seller of gold provided we can stay below that yearly opening price at 1824, and very often this is what happens.
They flush the market out and then it’s about to turn. So when we look at the VantagePoint MA diff cross, I will respectfully submit that this is why I went long on Tuesday of this previous week because VantagePoint clearly identified that it, at least in the medium, short to medium term in this particular downtrend, current downtrend, it’s getting ready to turn back up. Now, you’ll remember in the previous weekly, because again, this is an outlook, guys, it’s not a recap of something that’s already happened. I’ve talked about this a month ago, that if gold is going to turn, it’s going to be around October the 14th. That’s what I would be looking for because that’s when the dollar is likely going to turn lower based on a five year, 10 year seasonal pattern.
The other thing with gold is, over the last 10 years, indisputably over 10 year period, it’s been bearish between October and year-end. However, over the last five years, 80%, this trend has shifted to the upside, and that is just clearly showing the depreciation of the US dollar, of the Canadian dollar, the Aussie dollar, the Euro, as the global governments continue to print money, this does not benefit any one of these currencies. But again, when we look at this right now, the angle of the neural index strength, and again, that forewarning sign that gold would likely rise after the non-farm payroll number. Again, I believe that this price that we see on Friday with this move up is accurate because somebody has looked closer at that labor report, and probably similar to me has been left scratching their head saying, “Well, wait a minute. We’re basing this strong labor report on A U 3 number based on the last four weeks. That doesn’t make a lot of sense, but so be it.”
So the signal here is that gold, if nothing else, we would likely see some kind of corrective move back to the T cross long at 1871. But again, we must cross over 18 48, that current quarterly opening price.
Crude Oil
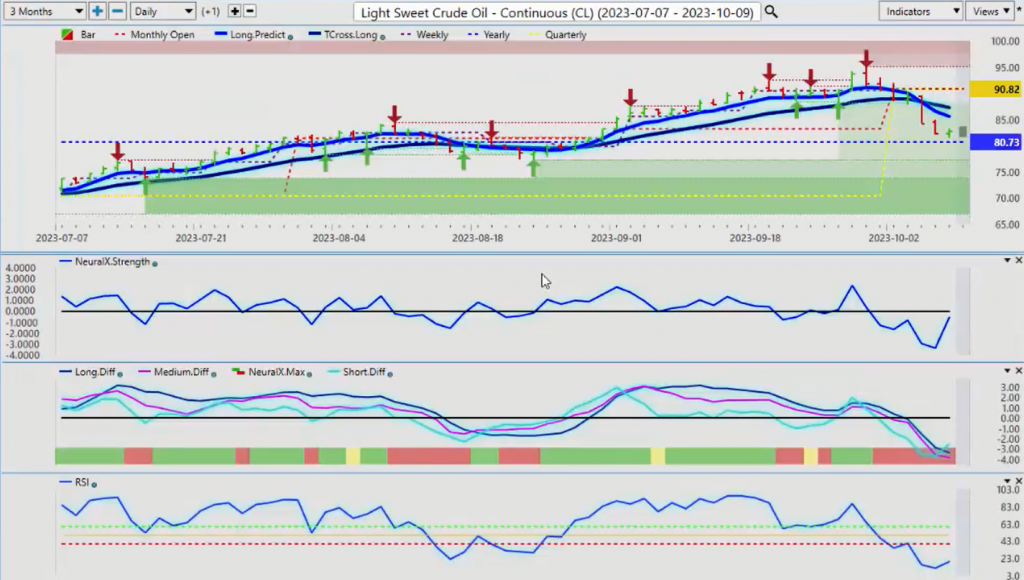
Now, when we look at oil contracts here, once again, oil contracts approaching that yearly opening price. This will be an interesting week because, again, there is a relatively high positive correlation between oil and the dollar index. As the dollar tanked, oil went down with it, but I believe that oil is the one that can break higher, not the dollar. Yes, I anticipate the Fed will try and hike one more time, but most of the Morgan Stanley and a number of larger firms are already betting on a March rate cut, and I would be in that camp too.
I don’t believe we should have ever hiked to 5% or more, but that’s not my decision to make. So when we look at this right now, the indicators, we have a strong neural index strength that is pointing straight up. The predicted differences, they look like they’re getting ready to cross. So again, for next week, 80 73, watch that level very, very closely. If we can hold above it, then this is nothing more than a corrective move because oil still remains bullish on the year.
Bitcoin
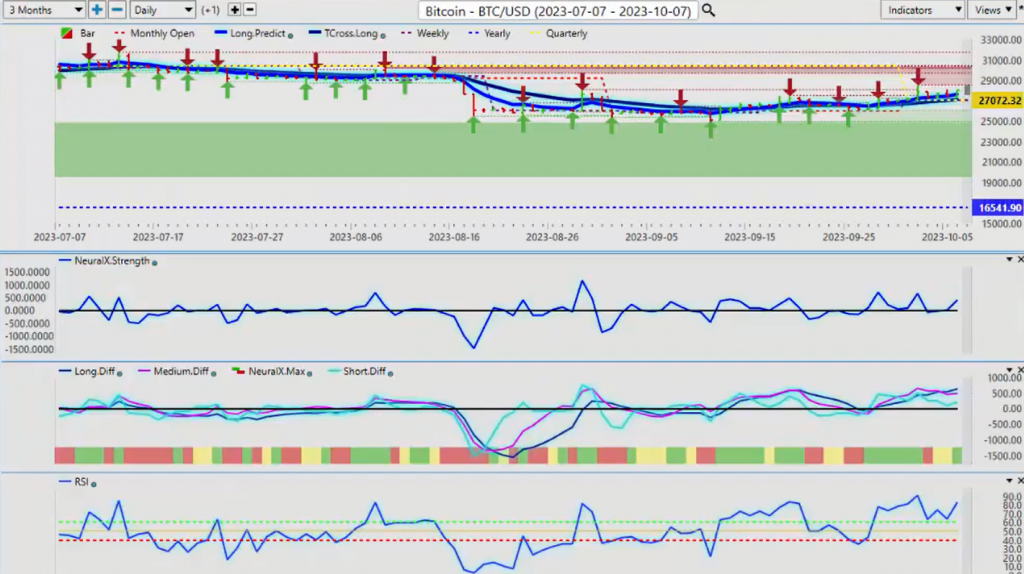
Now, my personal favorite in the month of, which I’m sure you guys already know, is Bitcoin. Every October, I’ve bought Bitcoin since 2018 where I refuse to listen to the media because again, I don’t believe the media is doing their job. They haven’t been doing their job in many years. The annualized returns on Bitcoin or I think around 150% per year always has a very strong October.
So good, bad or indifferent, I’m going to stick with what I’ve seen and I’m going to trade what I see, not what I hear. So right now, we are firmly holding above the quarterly opening price. That’s what makes this level so important. The point in time indicator and VantagePoint does not look into rolling performance models of the last five days, 30 days, 300, no, none of that, guys. It looks at the current quarter, the current yearly, the current monthly and weekly opening price because, again, we don’t want to get into using these lagging tools. So right now, the quarterly opening price on Bitcoin is 27,072. So I’m looking forward to hold above that. Yes, we have a mixed signal here. The MA diff cross is down, but the neural index strength, predicted RSI and we’re holding above. What I really like about this particular setup is the T cross long is coming in at 27,145, and it’s intersecting with the current quarterly opening price, and that’s provides a very strong level of support.
If you’re not in the camp of going along with that, I certainly respect that. Then have your sell limit orders ready to go below the quarterly opening price. But I think at this time as the global currencies devalue, Bitcoin becomes more and more attractive and the indicators and VantagePoint ultimately are supporting that.
Euro versus U.S. Dollar
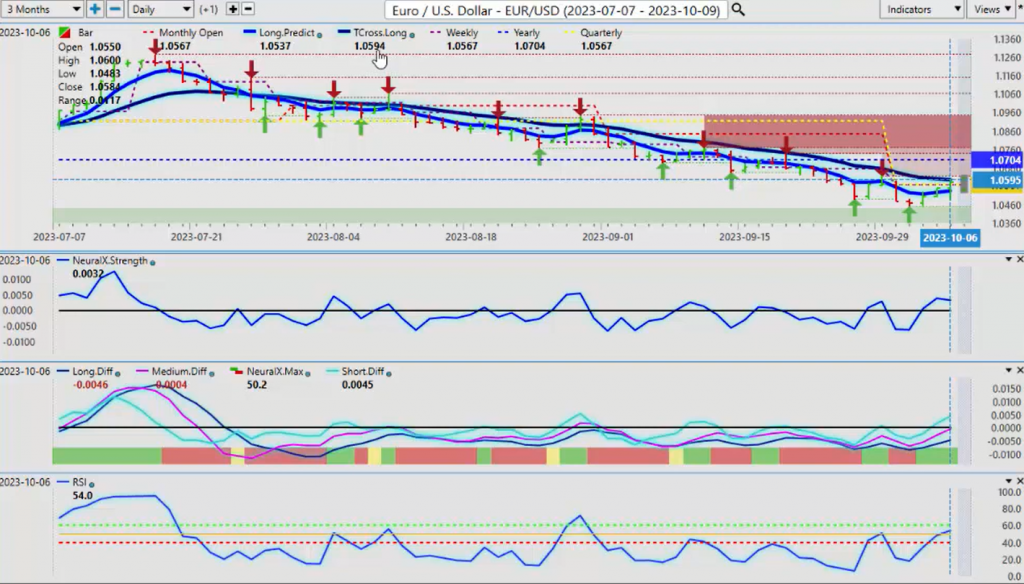
Now, as we look at some of the main players going into this week, Euro, US, once again, we were doing this one in the VantagePoint live training room this week, newly formed, verified support low that’s coming in at 104 49. My low for the month on the Euro is about 104 29. We got close to that, but then it shot out of there. So again, the rising predicted RSI, the rising predicted differences, the rising neural index, and we’ve got a newly formed verified support. Now, I could see it coming down and testing this, but of interest to us is again, 105 67.
We’re closing above that area at 105 84, that new quarterly opening price. This is a very simplistic methodology to apply to this. If we hold above 105 67, we break through the VantagePoint T cross long at 105 94, then we should easily be able to run up to 107. That could take a few days, it could take a month or it could be towards year-end, but I suspect it will be sooner rather than later because again, I don’t usually buy US dollars after the first week of November, and I’m already on the hunt for dollar shorts in mid-October. So we have that, another week of dollar strength in the first week of November. But again, this is something we have to be careful of.
U.S. Dollar versus Swiss Franc
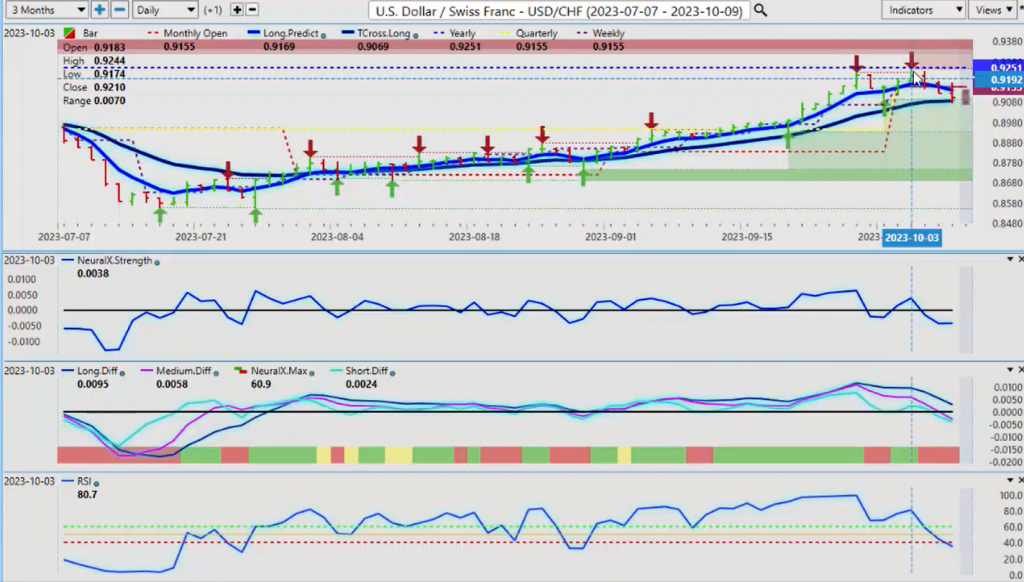
Now, again, we need to break through this particular level. If we look at the counterpart to the inverse correlation to Euro US is US Swiss Franc.
You can see this is the power of using accurate pivot points, yearly opening price, monthly, quarterly, weekly. This is invisible resistance to the average trader. The current yearly opening price, 92 51, we went up, kissed it, came down, came back off of it, went back up to it, hit it basically almost to the number and just collapsed. This is the easiest trade I had last week because I anticipate gold would rise, the correlation that the Swiss Franc has the gold, and either way, I anticipate the dollar would move lower in the coming week. So again, right now we’re at the T cross long, our quarterly opening, 91 55. We want to try and hold below this, but what I would like to see is a breakdown below the T cross long at 90 86 to accelerate this move to the downside, and I suspect by year-end, even with another rate hike, we’re still likely to push below the 89 mark.
British Pound versus U.S. Dollar
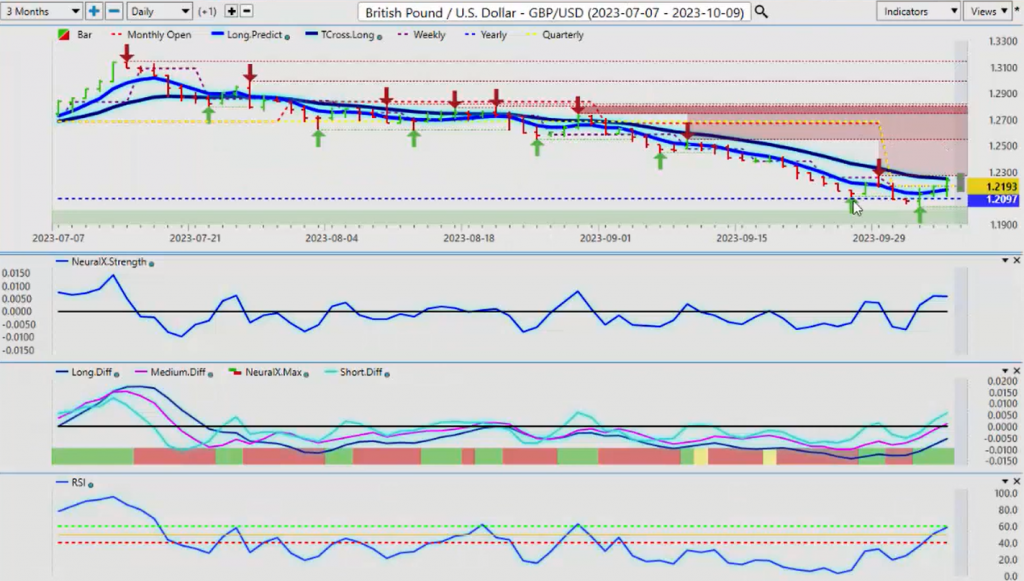
Now, the British pound, again, it’s impossible for me to script this guys because we know this level ahead of time. We don’t care what the last four or five days are, the last random 30 days. Again, this just simply evidence is what I’ve stated, that it’s a lagging tool. The yearly opening price produced a fantastic long right there. The T cross long has contained it. We’ve come down this past week, slipped below the weekly opening price for a couple of hours, that’s it, and then shot right back out of there. So going up 200 pips on a single contract, you’re talking $2,500. Excellent trade. The VantagePoint indicators clearly allowed me to start to get long on this. As the neural index started to rise, we move higher. We have a newly formed support low that’s coming in at 20 37. A classic bear trap here, guys, and this is what we really need to watch for.
But the average trader, the media was very, very, very dovish on the British pound, the Bank of England, all that stuff. But guys, it’s just media noise. If it’s a true move to the downside, we’re going to need to hold below the yearly opening price at 120 97, and we couldn’t. For this savvy trader, there’s been multiple longs here that have worked very well. And again, the immediate support we have is the quarterly opening 120 93. We’ve got to break through 122 49. We break through 122 49, it will confirm what we already suspect, that the dollar is bearish into the end of the year, and the dollar bullish for the pound. And that is also supported, I might add, by the current seasonality.
U.S. Dollar versus Japanese Yen
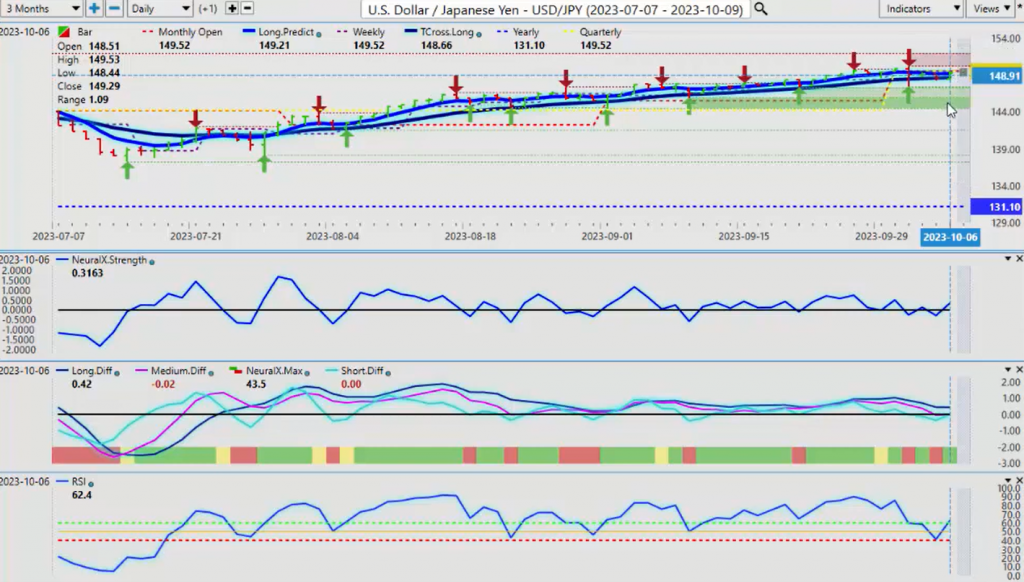
Now, when we look at the dollar, yen again at the beginning of the week in the VantagePoint live training room, we discussed this and I said, “Well, if the dollar is so strong, what the media is telling you, then why is it losing ground against all things the Japanese Ten?”
This by definition is the carry trade, meaning buy dollars, sell yen, the interest rate differential is the biggest between these two and the dollars still lost ground. Now again, there’s intervention worries, but again, only in my respectful opinion, this pair should have never got up here. But my opinion doesn’t matter just like everybody else’s opinion, it’s just an opinion. So I don’t want to fight the trend, but if we’re holding below the quarterly opening at 149 52, this is our focal point, guys, keeping an eye on this particular level will tell us on a price action based who’s in control of this, the bulls or the bears. I believe that the bears are going to take hold over the coming weeks, and I believe the Bank of Japan is thinking the same thing, and they’re going to use that to their advantage by putting out rumors of intervention.
That is what my concern here is. The primary trend is up indisputably, but if we’re not getting above the quarterly opening price and we know that the dollar struggles in its fiscal first quarter, then there could be a very good short here, but just be very, very cautious with this pair.
U.S. Dollar versus Canadian Dollar
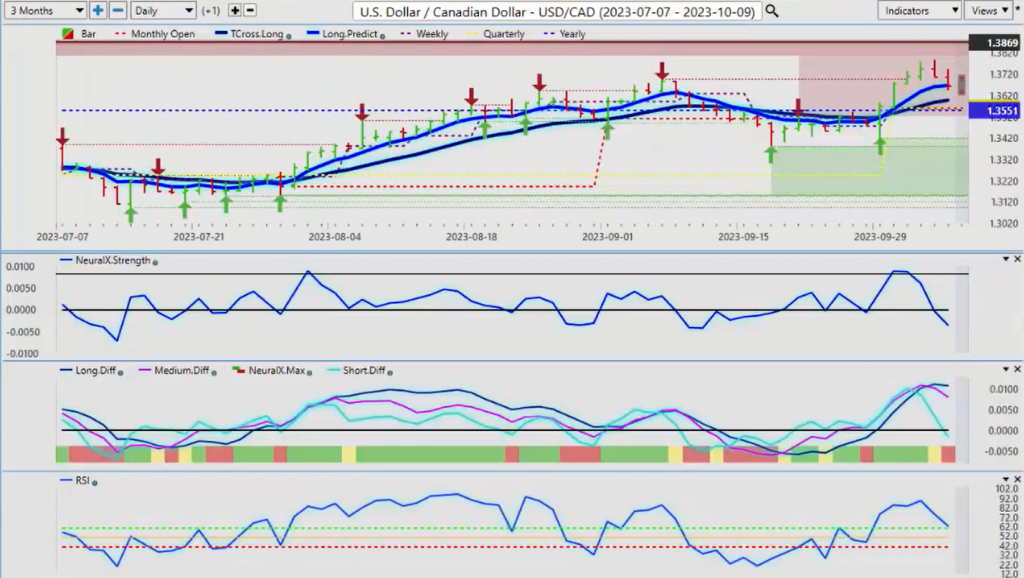
Now, the main equity base currencies, again, the second, the S&P500 turned and the dollar turned, the Canadian Dollar immediately benefited from that despite the fact that oil prices plummeted, the Canadian Dollar immediately reacted to a risk on scenario or a softer US Dollar. Again, even with those oil prices not really recovering, but again, the oil prices are still above their yearly opening price. They’re still positive on the year. So right now our quarterly opening price is a considerable distance away at 135 60. I anticipate this level will be tested next week.
If we break down below this, then that will open up the door to a deeper move on this particular pair, likely towards the 134, 133 81. But we must cross over the current yearly opening price, the current monthly opening price, and the current quarterly opening price. All of that resides around this 135 60 area, guys. So if you’re not sure, then you can just set up limit orders below the current quarterly opening. That is the advantage of using non-lagging, rolling performance models. We know exactly where this level is. If you don’t want to go long, you’re not sure what to do with it, then let it come down and test this area. If you believe it’s going to go higher, then you’re a buyer at 135 60. But if you’re a seller, then you set up just below the current yearly opening price and prepare for a move lower. The indicators and VantagePoint are saying, at the very least, sharp fall in the neural index strength.
The MA diff cross, the neural index is on board, and the predicted RSI is also falling. But again, for now, it’s corrective in nature until we break through the affirmation levels.
Australian Dollar versus U.S. Dollar
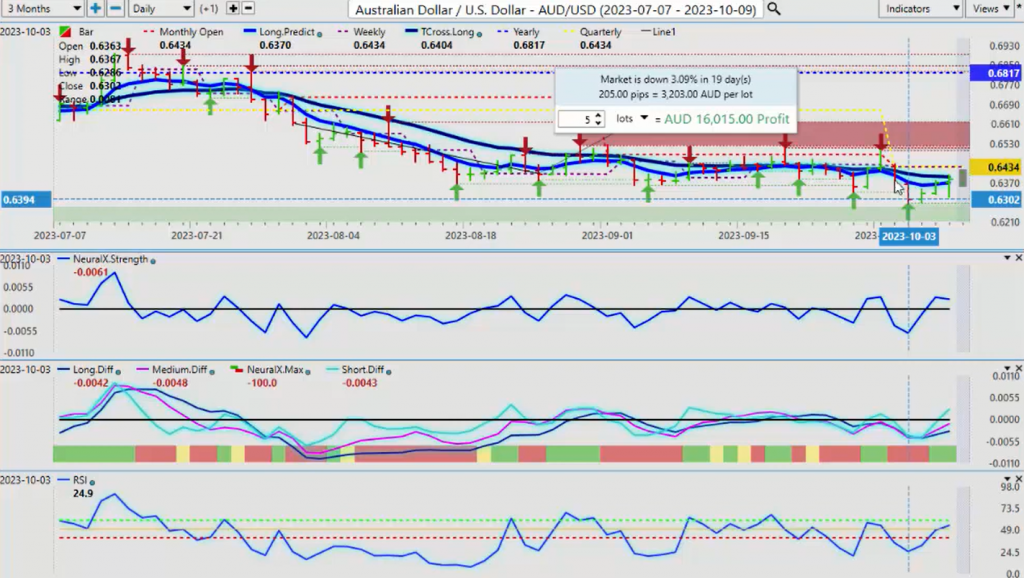
Now, the Aussie, as discussed last week, the week before, if the equity markets turn, the Aussie will turn with it, and that is something, it’s potentially in the cards. So if we look at this from the shorter term perspective, you can see that basically the Aussie has not made any moves to the downside since Tuesday of this previous week. We started to turn around on the Wednesday, Thursday, and the Friday. The quarterly opening here, 64 34, I think you know the drill by now, we need to get above that, but we also need to first clear the VantagePoint T cross long at 63 92. But if we get above our quarterly opening price at 64 34, that will confirm bearish sentiment on the dollar going into year-end, or at least for the next few weeks.
New Zealand Dollar versus U.S. Dollar
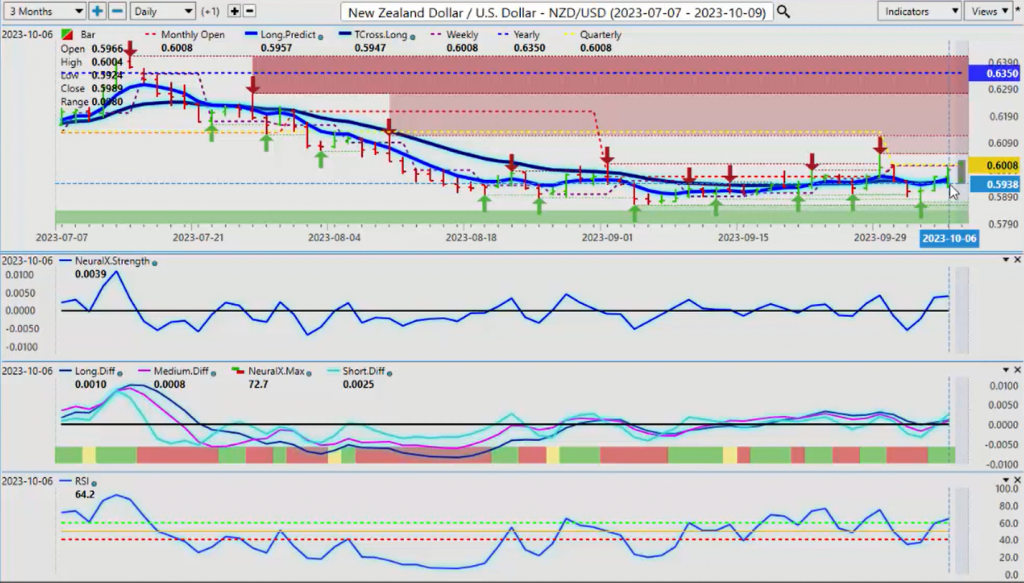
The same thing here, guys, would apply to the Kiwi, and I would argue the Kiwi is the stronger of these two. And again, for the Savvy Trader, in my direct trading group, we’re shorting Aussie New Zealand, we’re avoiding Aussie US and New Zealand US, and targeting the Aussie New Zealand cross pair. And again, when we look at the Aussie New Zealand cross pair, this is in a firm downward trend, and you can see, using accurate, powerful tools like the point in time, this provided excellent shorts every single day for me last week because the biased is the Kiwi is stronger in the month of October. So instead of, again, there’s many different ways to skin a cat here, guys, if I don’t want to short dollars on Aussie US or New Zealand US by buying those two pairs, I can bypass them and come here to Aussie New Zealand, a very, very powerful cross pair that is in a very nice trending move. And using that quarterly opening price, I’ll simply take 40 or 50 pips per day.
By the end of the week, that’s close to 200 pips on the week, just day trading using the VantagePoint T Cross long or long predicted and the VantagePoint in time and the additional indicators warning me that we’re still bearish on this particular pair. So with that said, this is the VantagePoint AI Market Outlook for the week of October, the ninth, 2023.


