


Welcome to the Artificial Intelligence Outlook for Forex trading.
VIDEO TRANSCRIPT
U.S. Dollar Index ($DXY)
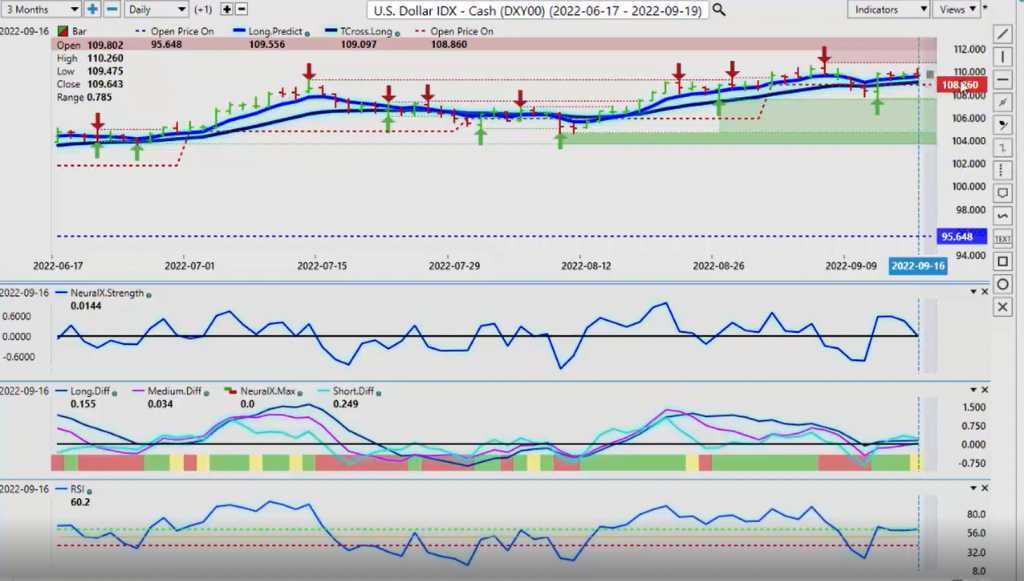
Hello everyone. Welcome back. My name is Greg Firman and this is the VantagePoint AI Market Outlook for the week of September the 19th, 2022. Now to get started this week, we’re going to begin where we always do, with that very important US dollar Index. Now once again, I’ve changed things up a little bit, added a few indicators to the screen using the point in time. So what I’ve got on here, the red outline is the monthly opening price at 108.86. The blue line is the yearly opening price at 95.64. I will apply all of this to the outlook this week so we get a better idea where things really sit in the markets. Now the dollar obviously remaining strong with the talk of the FED rate hikes. But next week will be extremely volatile. You’ve got the Swiss National Bank, the FOMC, and the Bank of England all in one week. And it is going to be extremely choppy in all markets.
But if we look at the dollar right now, the dollar is above its yearly opening price but the gains are maybe not as big as what some people think. Now we’ve had a good spike in the month of September, all the way up to the high of $110.78. And I anticipate the dollar will spike again. The question remains will the dollar hold gains after the Fed. The media is spinning things around saying that the Fed’s going to hike 1% or more. The FED has not said that. So again, I’m not even convinced the FED will hike 75 basis points, but more than likely he will based around the somewhat lagging CPI numbers. So again, when we look at our key VantagePoint levels we have our T-cross long intersecting with the monthly opening price, both at $108.86, $109.09. We would look for the dollar to remain above this level not just after the Fed, but also prior to the Fed.
The indicators here though, the neural index strength, you can see it’s losing momentum. The predicted differences are running sideways. The predicted RSI also not showing any kind of momentum. But again, what I’ve seen with these FED announcements very often is buy the rumors sell the facts. So we know where the current high on the dollar index is. If it’s a true dollar rally, then the dollar index, we would look for it to break above $110.78 this week, but it needs to stay above it. Now again, a lot of this is dependent on the Fed. I will never advocate for trading the news. I believe the dollar will be strong going into it. But come Thursday and Friday, regardless what the FED does, that will really be the test here, whether the dollar can maintain that momentum.
Gold
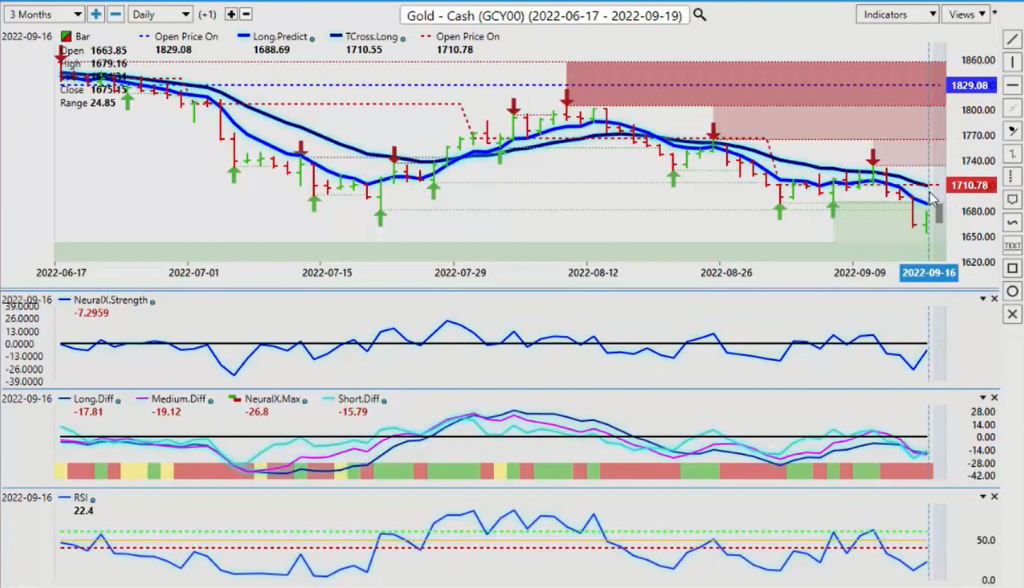
Now we can see clear as day that gold, anybody buying gold is bailing out of this prior to the Fed. Now when we look at gold, our yearly opening price, $1829, very bearish on the year. The monthly opening price, we can see price on open, you can see it’s identified by a red dash. And then the other one is identified, the yearly, is opening by a blue dash. Now in your VantagePoint software you can copy the indicators, which is pretty cool in my view. And then load the same indicator twice: one would be the monthly opening price, one will be the yearly opening price. But price action, guys, always tells us what the real trend is. If somebody were to argue that gold is bullish, well it’s below it’s monthly opening price and it’s been below it’s yearly opening price for the better part of the calendar year. So again, not overly bullish here. So right now, when we look at the same thing, we can see the VantagePoint T-cross long is actually intersecting with that monthly opening price.
What I’ve seen in the past, case and point over here, when the market crosses over the VantagePoint T-cross long and the monthly opening price, there is usually a significant move. And again, this is exactly what we saw this past week, so our critical levels are long predicted. I’ve brought them back in. $1688, T-cross long. $1710, we’re bearish on gold while we hold below the T-cross long and the monthly opening price. But even if we do go higher, you can see the yearly opening price is critical to get above that level if gold has any real chance of a rally.
Crude Oil
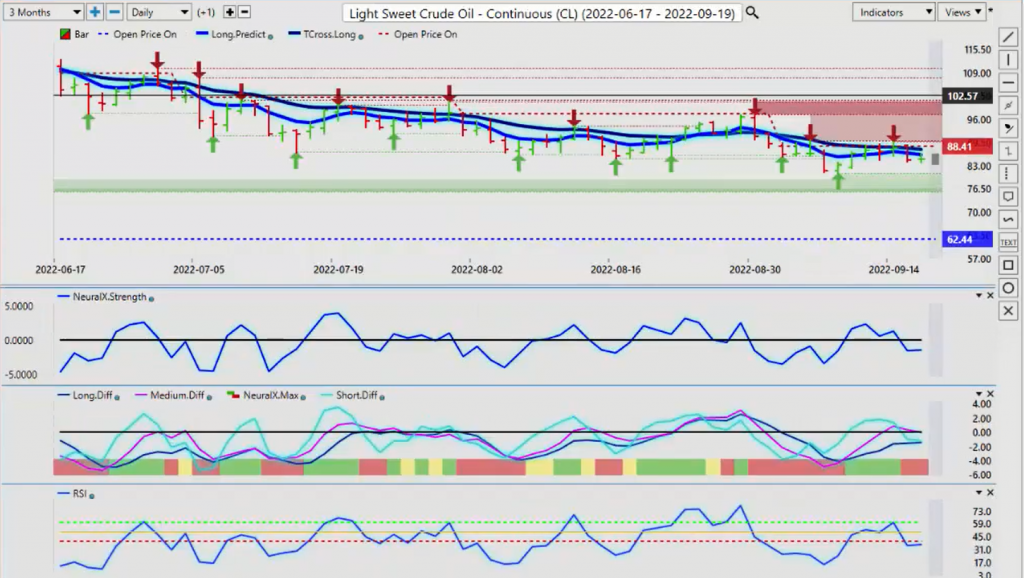
Now when we do a comparative on the energy side and we look at light Sweet crude oil, you can see that it too, it’s under pressure from the monthly opening price and the T-cross long. But we’re still above the yearly opening price on the oil contract, so that yearly opening price on the cash side is much higher than that.
But at any rate, you can see every single day this past week, we are banging into that T-cross long. This is a pivot level, guys. That’s why over the last several weeks I’ve only had the single blue line on the screen, the T-cross long, because you can see there is significant opportunity. This does not bode well for the energy sector because it’s struggling. So if I do a quick comparative, and if we look at the main indicators before I leave this chart, you can see that our neural index strength is down. Predicted differences are struggling to hold above the zero line. And the predicted RSI is below the 40 level. Now the slope of that predicted RSI, it is running sideways, so we’ll continue to monitor it. But there is still problems there.
Natural Gas
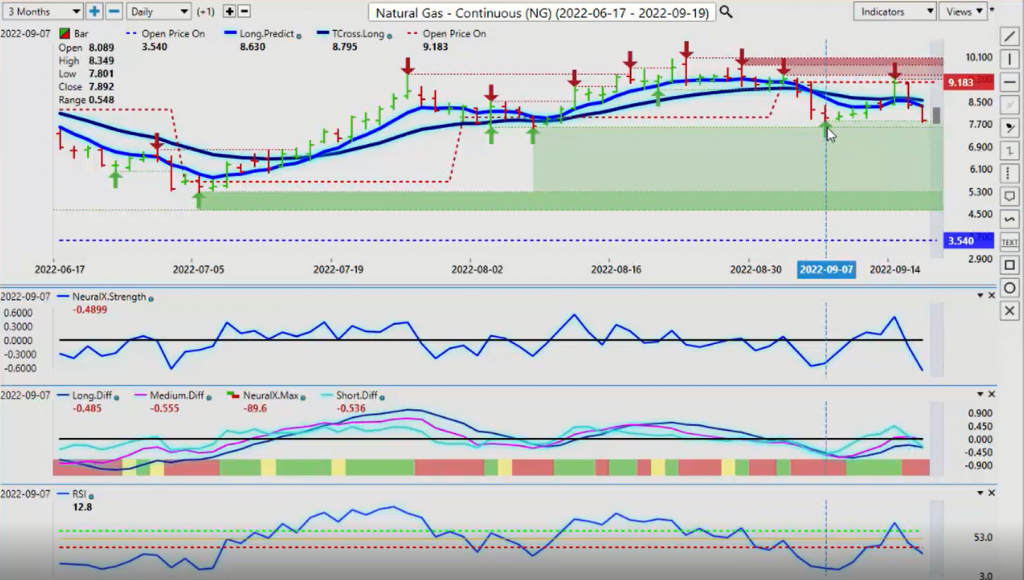
Now if we look at it from the natural gas side and the other alternative energy, once again, in my respectful opinion, this is not a coincidence that we fail at that monthly opening price. You can see we come up to it and then we firmly reject it. And we’ve moved lower. Now we have good verified support here in natural gas at two levels: $7.80, and then again over here at $7.56. So in my respectful opinion, if we break down below both of those two levels and close below them, then we would be looking at the additional verified support low potentially at $5.27. I don’t think that’s going to happen at this time because of what’s going on in Russia and the Ukraine. But again, anything’s possible.
Now just briefly, why I’m on here, I was asked a question that I wasn’t able to respond to last week. The red arrows and the green arrows. The red arrows, the large red arrows identify a failure point in the market and then a verified resistance zone is formed. The large green arrow does the same thing in the opposite direction. It identifies a failure on the downside and then draws a verified support low. So again, that becomes a pivot level or a support, and basically their support and resistance. So that support is holding for now, but the indicators are warning that natural gas is likely getting ready to make, potential, another move down.
S&P 500 Index
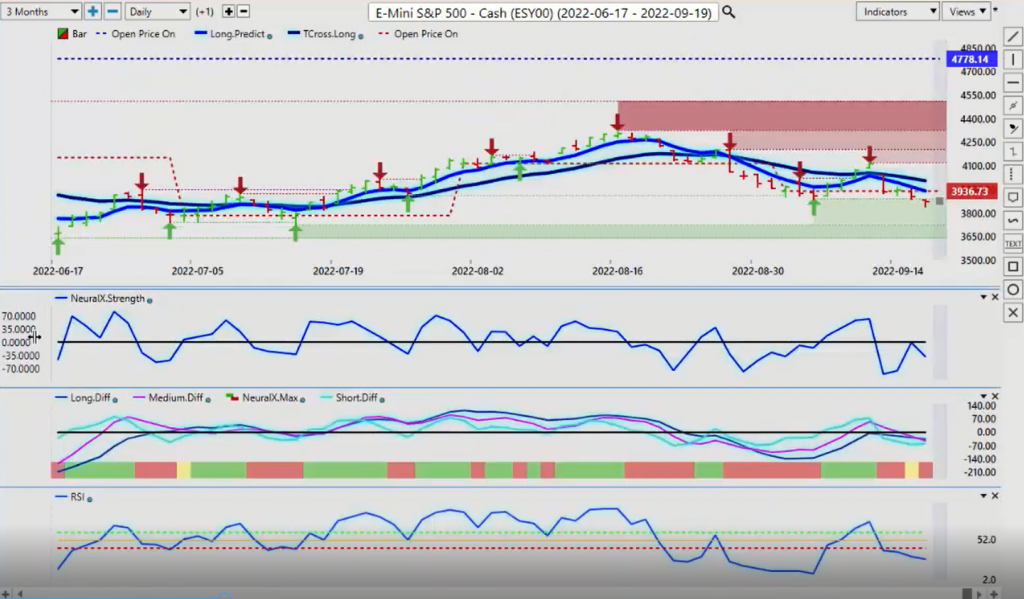
Now when we look at the market that pretty much all eyes are on, the S&P 500 and the dollar index. So when we look at the S&P 500, number one, we have never been above the yearly opening price this entire calendar year at $4778. The monthly opening price, we’ve been above it, we’ve been below it. On a month over month basis the S&P is still fair, decent, is the best I can say.
But now we’re breaking down below this again. So I would anticipate what would likely happen is a big push right out of the gate on Sunday night, tonight. This video, as you can see, is being done at 11:57 AM on Sunday morning, so again, before the markets open, not after. So what I would anticipate is another push down, equities to remain under pressure until we get past the Fed. Then possibly we could see a bit of a rebound, but this continues to be bearish here. If our T-cross long and our long predicted slip below that monthly opening price then that’s a very strong warning sign that a bigger move to the downside potentially is coming. But our upside resistance right now, $4001 and $3937. You lose $3937. Your next resistance point is your T-cross long, again at $4001. Then we have multiple verified zones identified just above that, starting at the first verified zone high, which would be $4119, and then concluding up at $4325. That is just an absolute pipe dream now, guys, to get to that particular level.
Bitcoin
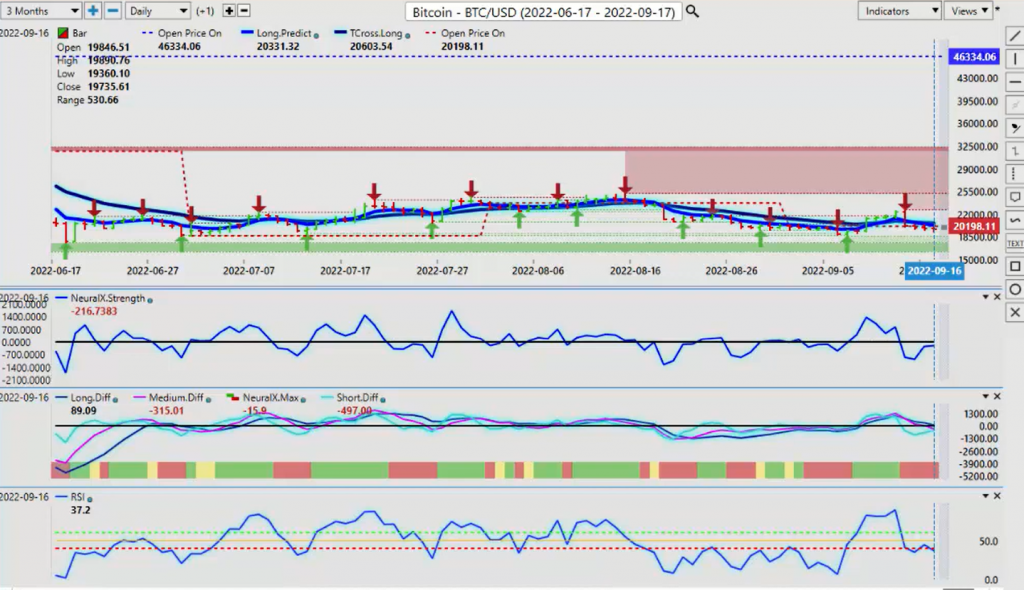
Now but again, in most cases equities and Bitcoin usually rally at the end of September or into the first part of October. But as you can see, Bitcoin remains under pressure here. But we’re still holding this line firmly below the yearly opening price this year. But we’re still struggling with this critical level here of that monthly opening price. We’re looking to see if this thing can get back above it. But I don’t think that’s going to be for a couple of more weeks here, guys. And maybe this seasonality in Bitcoin won’t even occur this year, but it’s been very, very consistent from late September to very, very early November, or the latter part of October, has been one of the strongest periods for Bitcoin. So our resistance point now $20,603. If we can get back up above that, then we have a shot to go higher. But I don’t think that’s going to be until, again, after the Fed.
Euro versus U.S. Dollar
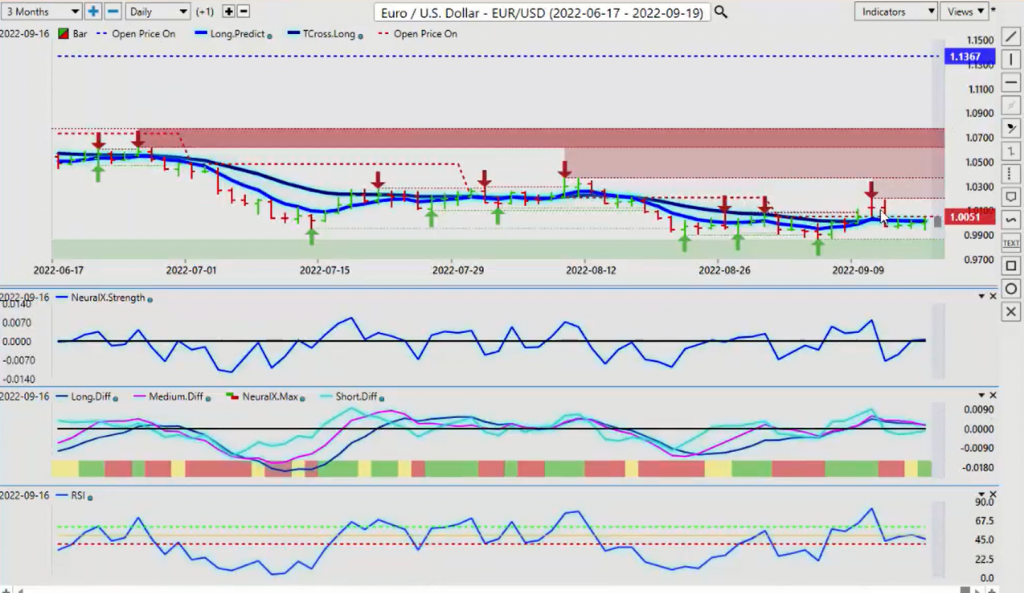
Now, as we look at some of the major Forex pairs going into next week, the Euro, again, looks very similar to the dollar index. Now, when we apply that monthly opening price then we can see that, again, that monthly opening price is coming in at just above parity at 1.0051. We’re closing the week here at 1.0013. So the Euro is not really that bearish, as bearish as some may lead you to believe on the month. But it is, I’ll absolutely concede that the dollar has the advantage here. But remember, as the ECB starts to ratchet up their rhetoric about raising rates, the interest rate differential between the Euro and the dollar starts to narrow, right? So that could lead to some Euro strength going into next month. It’s very unlikely ahead of the Fed. But as you can see, we’ve had a couple of very good spikes this past week all the way back up to the 1.03 levels. So just one single wrong word from the FED this coming week could easily cause a spike back up to the upside on this particular pair.
The indicators are a little mixed here. Our neural index strength is actually indirectly showing a little bit of strength in the Euro. The predicted differences, very, very mixed here. But once again, 1.0018 is the critical level you want to keep your eye on. With the US/Swiss franc, again, this is going to be, in my respectful opinion only, potentially a make or break week for the Swiss franc. We’ve got the Swiss National Bank, again, the media spinning things a little bit here, talking about over a 1% or more hike from the Swiss National Bank. I’m not in that camp, not one bit. I think that they’re going to calm things down a little bit because, remember, if they do hike, then that’s going to put pressure on Euro Swiss franc. And they don’t want that, so it’ll be a very interesting meeting. I believe it’s on Thursday. Don’t quote me on that, I’ll have to double check that. But I believe it’s Thursday this coming week.
U.S. Dollar versus Swiss Franc
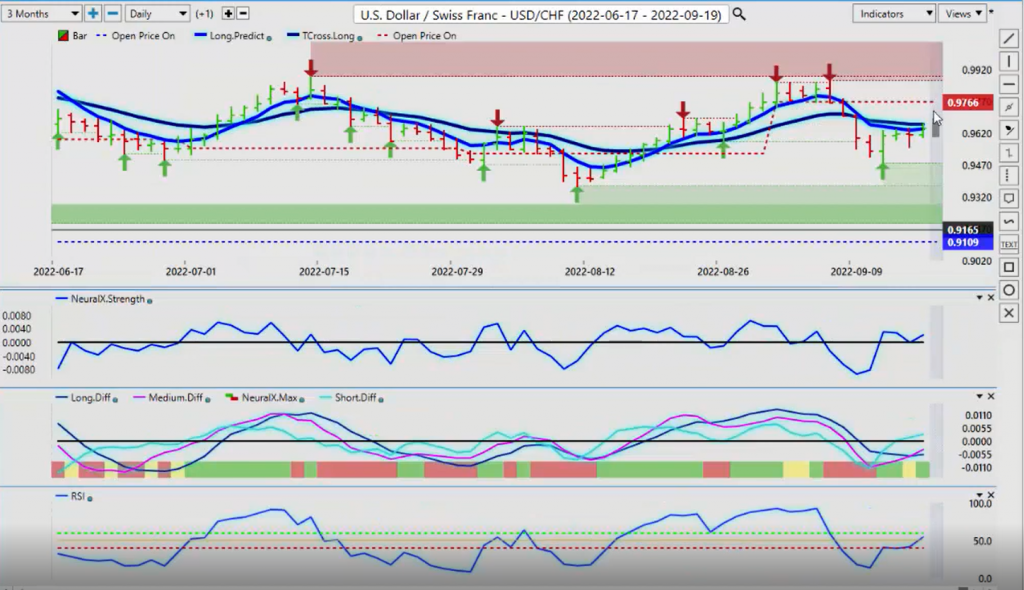
The US/Swiss franc has pushed all the way up to the T-cross long at 9662. If it’s going to fail, guys, this is where it’s going to be. I’m looking for it to continue to push higher towards the end of the month. I believe it can do that. We are above our yearly opening price at 9109. It is bullish on the year. We’ve just got to get back up above this monthly opening price. And more specifically, we need to get above the VantagePoint T-cross long to get this pair moving. But if it does fail, you’ll know why.
British Pound versus U.S. Dollar
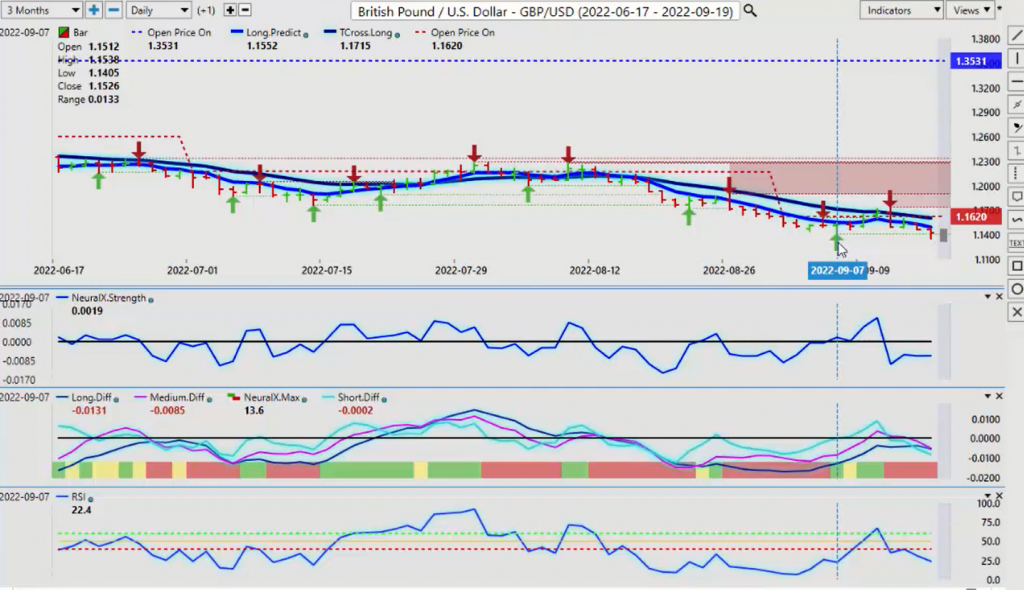
Now when we look at the pound/dollar, this one, you can see I’ve taken the chart back three years to that infamous day with the FED slashing rates, which sent the pound/dollar screaming higher over the next several years, months/years, whatever you want to call it. All the way up until February, or excuse me, May, of 2021. But then the pound resumed its down trend again. This support level is the one that I’m sure I’m not the only person that can see this guys. But be very, very cautious around this 1.14 level. I believe they’re going to try and run stops. In order to flush the market out they would have to push this thing down at least 200 to 300 pips in order to flush it out. Then it rebounds, or it may not rebound if we have this continued dollar strength. But remember we have the Bank of England this week. But that support level at 1.1411, which was actually breached on Friday, as you can see, we also have a verified support low there from the previous week at 1.1405, which was a fantastic long. But that long was based on the verified support low going back to 2020.
So once again, can the pound recover here? These indicators are saying, “No.” They’re saying it’s going lower. Our neural index strength is sideways. Our predicted differences are getting ready to cross back to the downside. And the predicted RSI is showing that momentum to the downside is building. But just remember, they could just run this down 40 or 50 pips, maybe 60 pips, maybe even 70 I’ll go as far as, and then you get a violent reversal back up. Just remember, Monday and Tuesday trade is very different. This Monday/Tuesday phenomenon of these reversals, you can see it. We rallied up on the pound dollar only to get crushed on Tuesday. Now in this particular case, of course, it was because of the CPI data. But it often does this anyway, so be very cautious with this one. And keep your eyes on the dollar index and the 1.14 level, because remember, if the euro is already at parity and the pound/dollar is a correlated currency, then it still has 15 cents to fall, right? And I’m not saying it will. I’m just saying be mindful that that could happen.
U.S. Dollar versus Japanese Yen
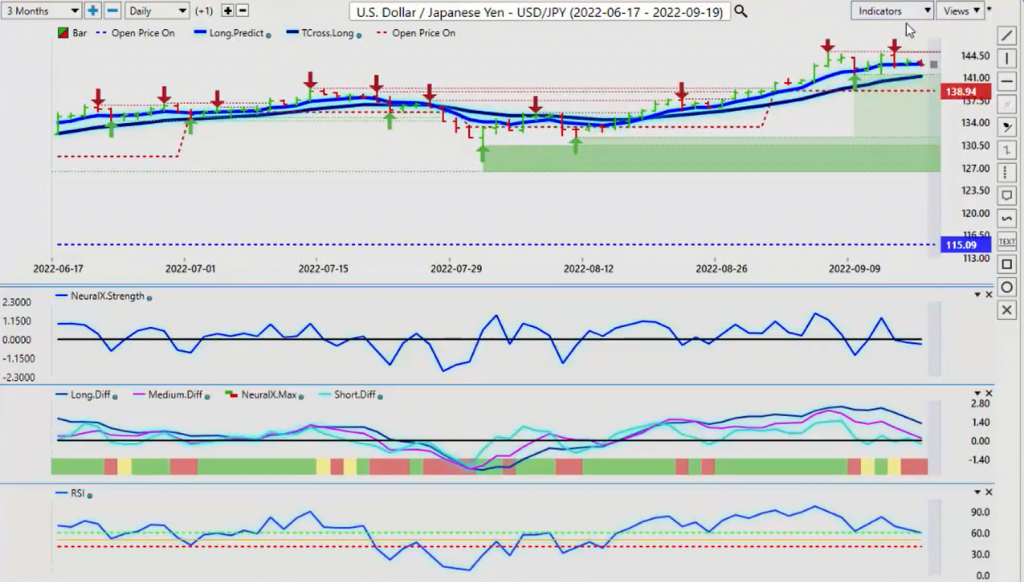
Now when we look at the dollar/yen, going into next week, once again stalling out up here with the US/Swiss franc. The Swiss franc and the Japanese yen have high correlations to the dollar in risk-off scenarios. So if the S&P 500 crashes, even on dollar strength it could still push this pair lower. It could still push US/Swiss franc lower, so be cautious with this one. But again, we’ve got significant verified resistance up at 144.99. That tells me probably there’s an option barrier at 145 and they’re protecting it. I don’t think we got to… No, we didn’t get to 145 there either. So again, exotic options could be tagged to the 145 level, and they’re going to try and push this thing through there. Once they do, that may go lower if the S&P, the indicators from VantagePoint are not overly bullish here. Neural index strength down, predicted differences down, and the predicted RSI is all falling. So there is not a lot of momentum up here, at least not ahead of the Fed. When we look at it on a year over year basis, 115.09, the yearly opening price. Monthly opening price, 138.94. I would argue we’re going to retrace to that. We are likely going to retrace to that either way.
U.S. Dollar versus Canadian Dollar
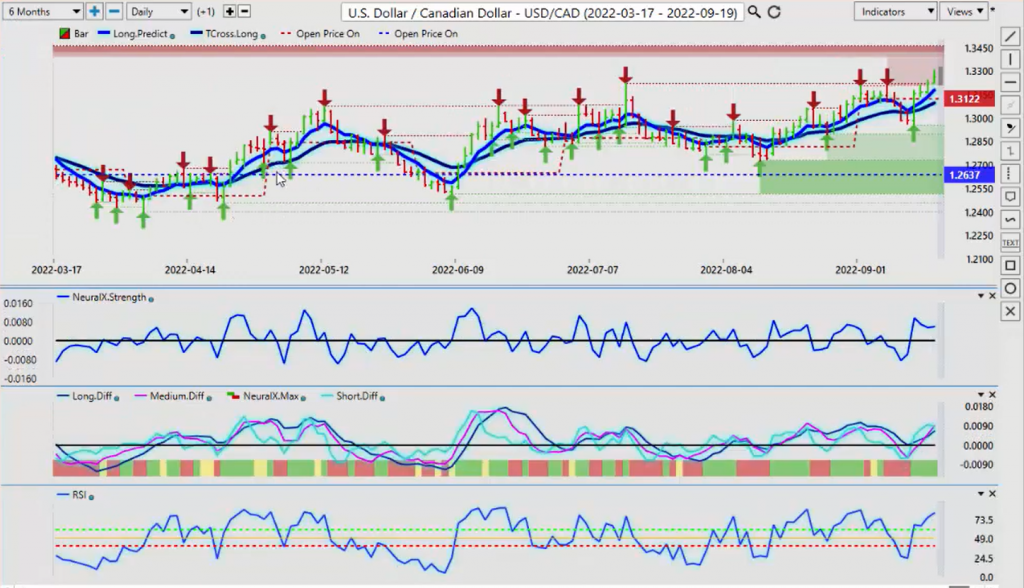
Now as we look at our three main equity currencies, the CAD, the Aussie, and the kiwi, they’re all basically a very similar trade. You can see that US/Canada is finally under pressure. This is all over the news in Canada here this weekend, with saying that the weakness in the Canadian dollar, that was inevitable if these equities continue to fall. And now energy is under pressure.
So I would be very cautious with this pair. I have a lot of resistance up around the 1.30, 1.33, 1.3770. Very, very, very small move above that level and then it pulled back. Now the indicators here, that’s an infamous. This is what some of the people here wrote to me that they call the death cross. And I’m not going to disagree with that terminology. When I see an MA diff cross like that, that usually is suggesting it could be an end for the Canadian dollar and we are going higher.
So I’m not convinced of that just yet, but I think that oil, and I think that energy may be able to turn around. It’s possible. I believe the S&P may turn around at the end of week once we get the Fed, whatever he’s going to do this time, it’s always a mystery. But for now, longs are the better play in my respectful opinion while above the T-cross long at 1.3096. And our price on open, the monthly open at 1.3122. And again, the yearly opening price here guys, 1.2637, that alone, when you look at it over the last several months, if we look at it over the last six months, every time we’ve dipped below the yearly opening price it’s come right back up again.
Australian Dollar versus U.S. Dollar
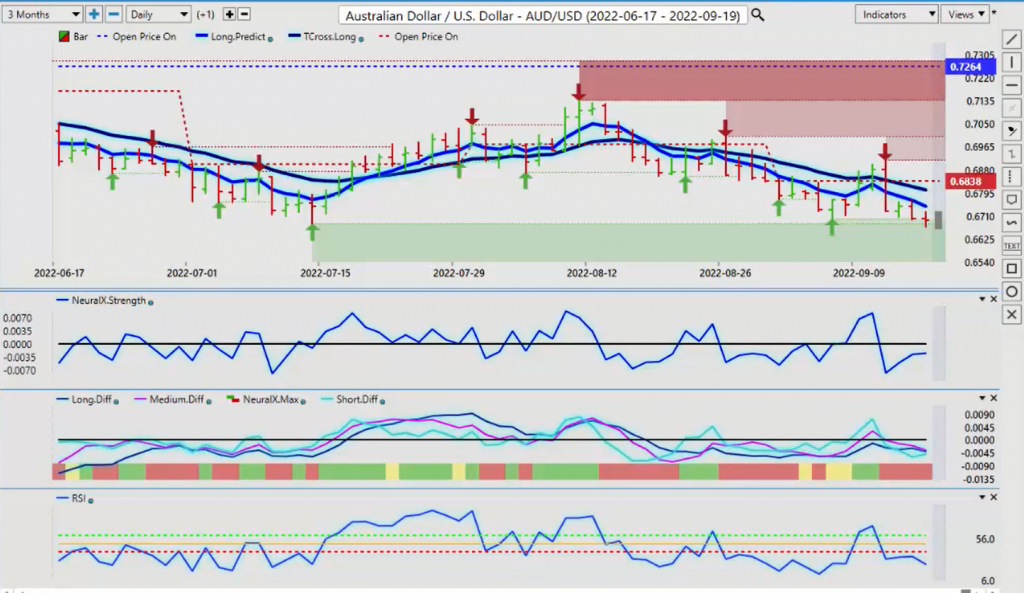
Now you will see very, very similar patterns. If the US Canada reverses to the downside then Aussie and New Zealand will try and reverse back to the upside. We have strong verified support at the low, at 6681. But you’re going into FED Week so I would expect volatility in all three of these pairs. But again, if we know our levels and we look at our indicators, there is some hope for the Aussie with the neural index strength. But the additional indicators are all pointing for further weakness on the Aussie. We just need a sustained break of that verified zone, that verified zone low, and that’s coming in at 6681.
New Zealand Dollar versus U.S. Dollar
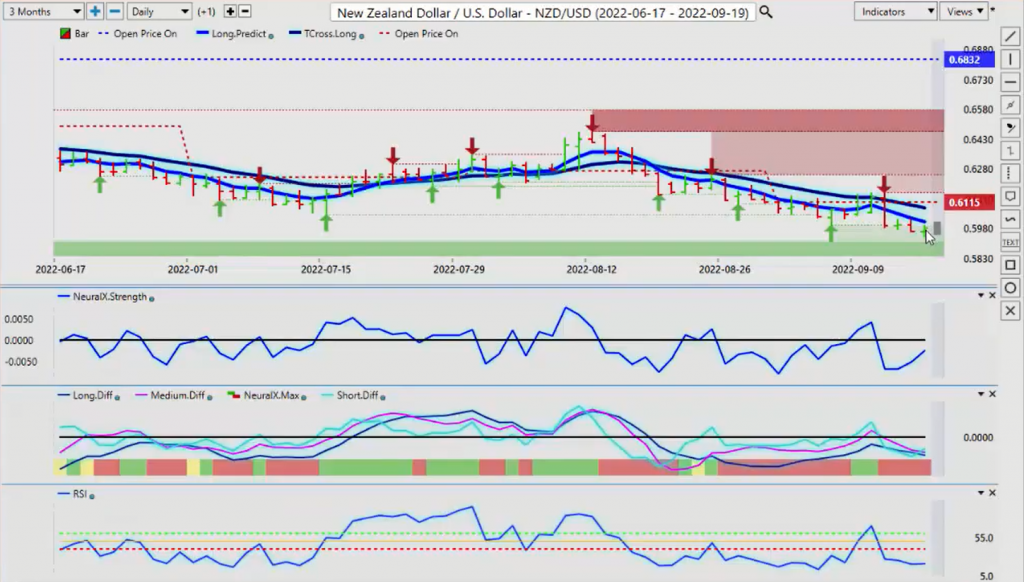
We will see something very similar with the kiwi. And with the kiwi, once again, it’s under pressure already. But the indicators, the neural index strength is showing there’s a bit of life there. But the additional indicators are saying we’re going lower. Both the Aussie/US, the New Zealand/US, are firmly below their yearly opening price. And on a side note, what I’ve seen over the many years of using this type of trade setup is that the further we move away from the yearly opening price on any trading instrument, the more likely it is there’s going to be some kind of retracement. That is not based on Fibonacci, not based on any of these types of things. It’s simply based on the fact that you have a large gap in price. And it’s telling me that, potentially, this, the Aussie, is grossly undervalued at these levels. So if the RBA starts hiking then that could turn things around, or if there is any type of wording from the FED that the market doesn’t like.
So expect a very volatile, choppy week. But with that, I’m sure there will be opportunity. So with that said, this is the VantagePoint AI Market Outlook for the week of September the 19th, 2022.


