


Welcome to the Artificial Intelligence Outlook for Forex trading.
VIDEO TRANSCRIPT
VantagePoint AI Market Outlook – September 22, 2025
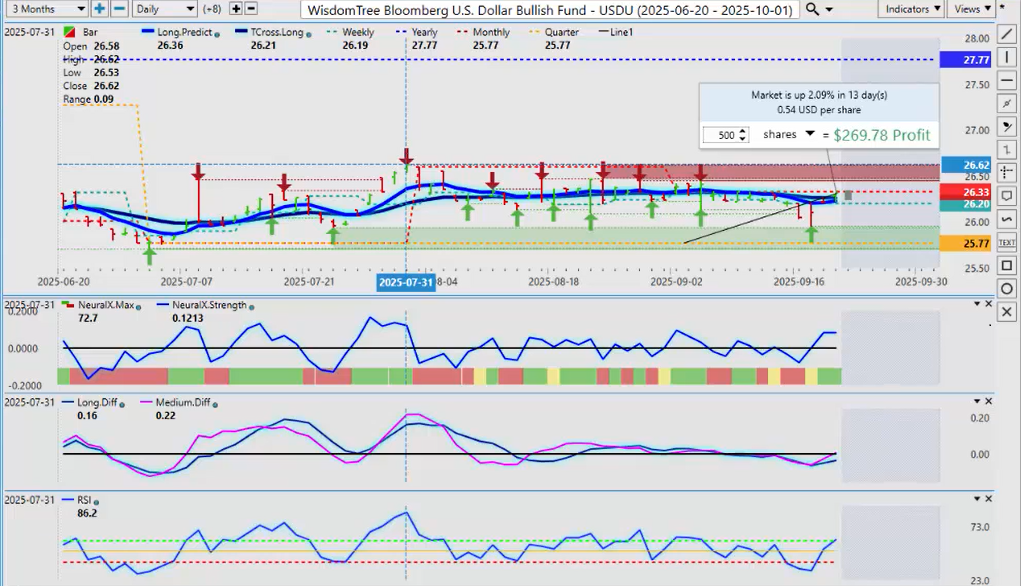
Wisdom Tree Bloomberg U.S. Dollar Bullish Fund ($USDU)
Okay, hello everyone, and welcome back.
My name is Greg Firman, and this is the Vantage Point AI market outlook for the week of September the 22nd, 2025.
Now, to get started this week, we’ll begin where we always do with that very important US Dollar Index. Now, coming off a very choppy week with the Fed. The Fed, in my respectful opinion, only did not give the market the dopamine it was looking for by saying 50 basis point cut, multiple cuts coming. Uh, he really didn’t say any of that. I took it as somewhat, actually, a hawkish rate cut.
So, needless to say, the dollar recovered the losses from earlier in the week on Tuesday and Wednesday. At that time, we had an MA diff cross in the VP software. Now, again, this is an outlook, guys, not a recap of something that’s already taken place, but I do want to point out how powerful this indicator actually is—the pink line over the blue line warning us that basically the dollar was going to turn back up, which it did.
Now, we’re still negative on the month, but what I will point out here is this is one of the only quarters in the entire year where the dollar has been positive for the entire quarter. Going back to July the 1st, you can see we’ve basically been running in a channel from that quarterly opening price, hitting a high on July 31st, and then we’ve kind of moved sideways back and forth since then. But again, there is some momentum building here.
So, we have some fresh data coming out this week, but I don’t think it’s going to alter anything for now anyway. In most cases, the dollar does do fairly well in the fiscal fourth quarter, which ends on October the 1st. So, the indicators in VP are somewhat bullish on the dollar here going in. I don’t think too many people would make that call after the Fed or even before the Fed, but I don’t think the dollar is quite done yet.
We do need to get above 2633. You can see that I am using the WisdomTree USDU. Now, if I look at the UUP, to be fair, you can see a very similar signal here. On either one of these two, they’re both showing the dollar is still in pretty good shape.
So, again, in most cases, the dollar can hold these gains in the month of September, but we will revisit it in October.
Gold ($XAU/USD)
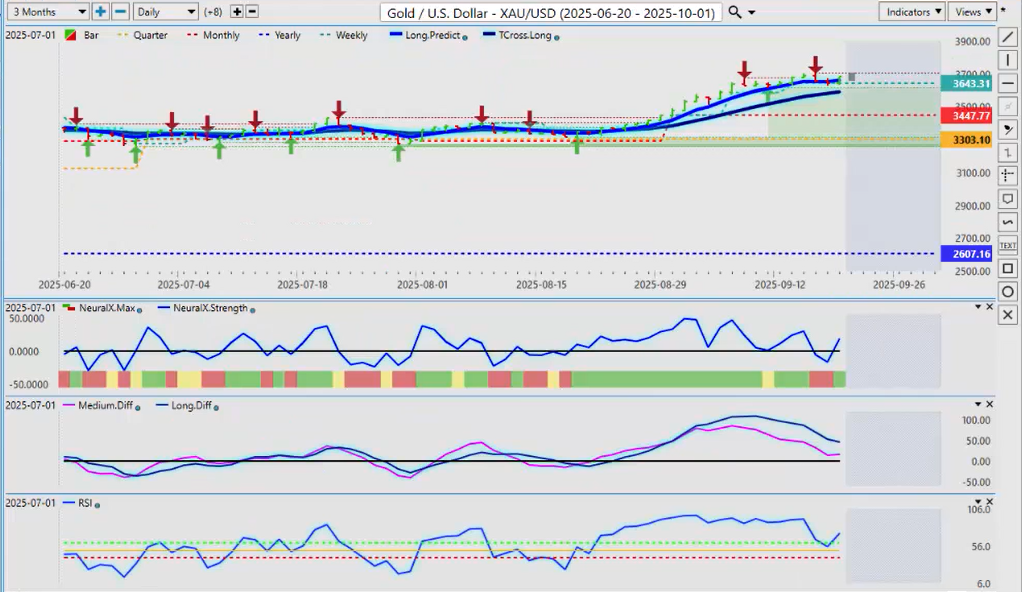
Now, when we look at gold once again, gold was getting very toppy before the Fed announcement. We hit a high of 3673, revisited that, made a new high of 3707, but very little momentum up here to keep it going.
Now, what I am seeing in the VP software going into trading on Monday: the neural index strength is turning bullish, a reverse check mark on the predicted RSI, and no breakdown below the 50 level. Usually, a signal like this suggests that it was just corrective in nature.
Now, in most cases, regardless of how good gold has done in the course of any given month, very often it sells off at the end of the month, as we know that period of known US Dollar strength. So, again, we’ll monitor it. But structurally speaking, gold is doing very good above its yearly, quarterly, monthly, and even the weekly opening price.
Last week did very well. But remember, on October 1st, we’re going to get not only a new monthly opening price, but a new quarterly opening price. And that’s where it’s going to get very interesting.
For now, this slight move lower in gold does appear to be corrective in nature, but I would definitely say that there’s a high probability that gold moves lower into October 1st.
SPDR SPY ETF ($SPY)
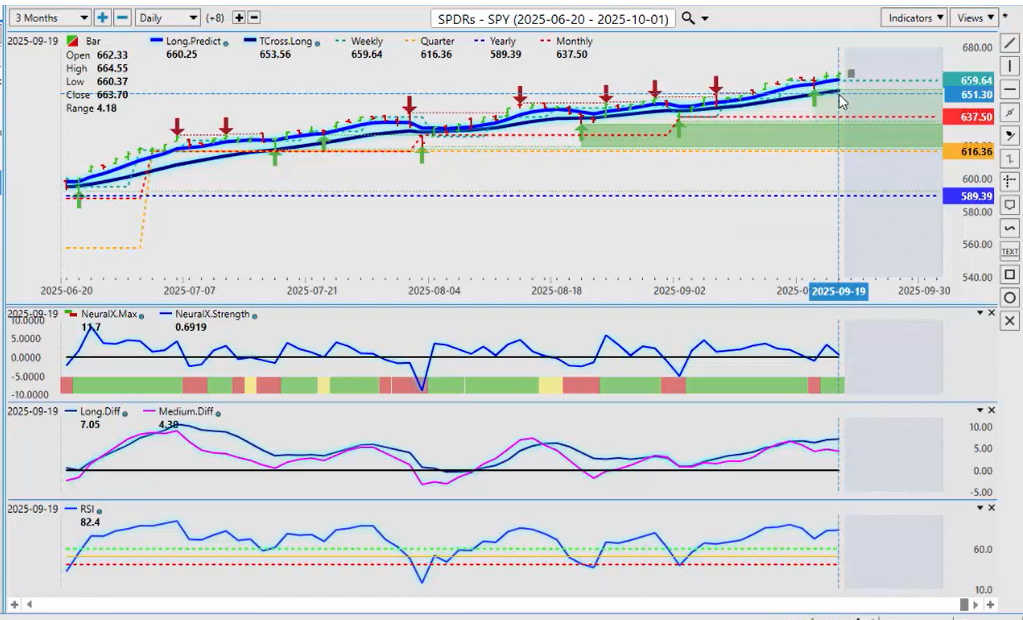
Now, looking at the SPY, the SPY is performing very well. The global equity markets—or at least the US markets, anyway—are performing very well, despite the fact that they didn’t really get what they wanted from the Fed on the 50 basis point cut.
But structurally speaking, we’re above the yearly, the quarterly, and the monthly. A very strong trend in the equity markets this year.
So, the key levels: 660 and 653, the long-predicted T-cross long. I do anticipate a test of that particular level this coming week, and we’ll see if that can hold.
The indicators in VP are mixed. We’ve got an MA diff cross to the downside. Now, to clarify, it would be corrective in nature while above the T-cross long and the monthly opening price. But I think it will be a very, very interesting week for stocks next week to see how the market digests the Fed comments.
I believe the Fed does have a speech next week also. The market will definitely be watching for any follow-up from him. So, keep an eye on that. But for now, equities are holding above that critical T-cross long.
DAX
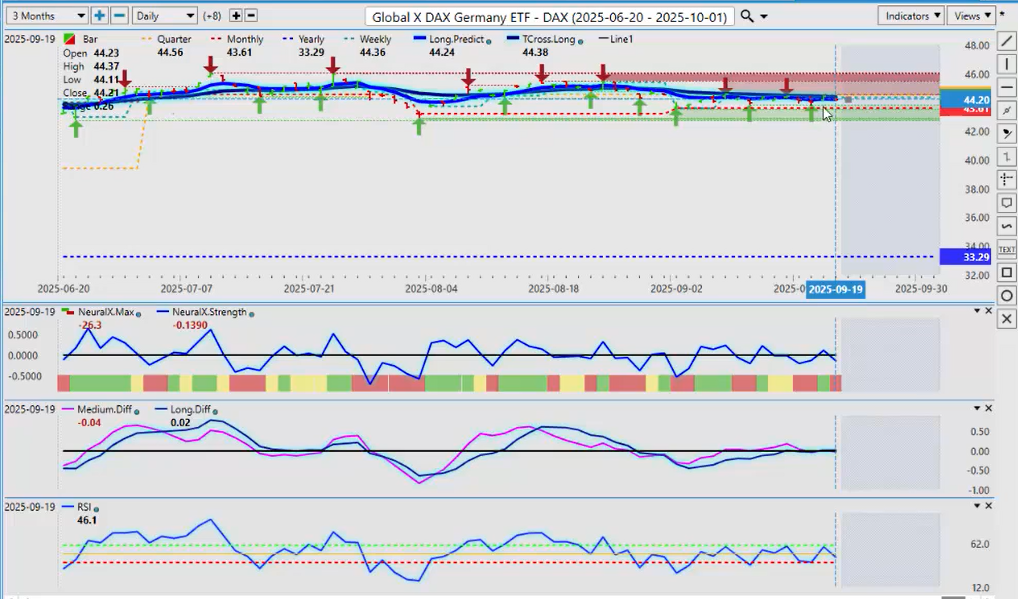
Now, looking at the German markets, the DAX ETF—again, not a great week for the euro. As I had stated earlier, there’s been a relatively high correlation between the euro and the DAX.
And you can see that the DAX had trouble getting going all week here, but we’re holding above that critical monthly opening price at 4361. We remain long while above that. But again, basically the DAX is moving sideways, watching the euro very closely for the next trigger.
The Eurozone has its own set of issues, like every other country on the planet, and things in France, etc., are dragging the DAX down. We’ll see if things can settle down this coming week.
But the T-cross long at 4438—we have to break up above that if this has any chance of moving higher.
VIX
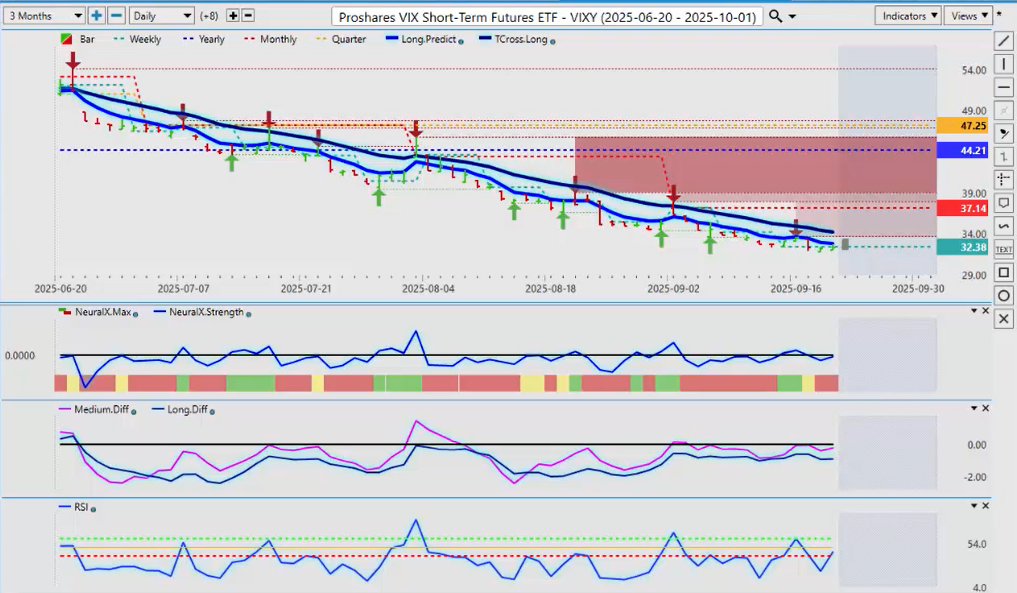
So, we definitely want to make sure we’re looking at that VIX to see if there’s any warning sign here that there could be a problem. And sure enough, there is—that reverse check mark on the predicted RSI. It’s starting to come back up. Our medium-term predicted difference is above our long-term predicted difference.
Again, any move up in the VIX would be corrective in nature while below that T-cross long at 3422. But I would look for a potential retracement back up to that level probably by Wednesday of this coming week.
United States Oil ($USO)
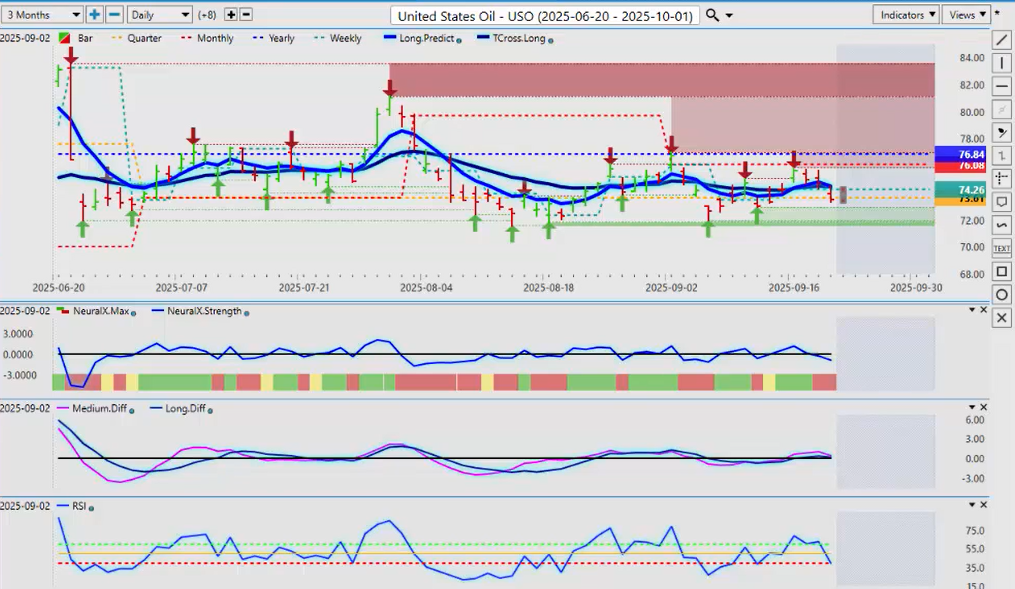
Now, where does this leave oil? With oil prices here, a lot of different people have different viewpoints on oil, natural gas, and the different commodities.
But the reality here, guys, is that oil does very well in July, right in the third quarter, but then it always tends to taper off once we get out of summer driving season. And again, this past week, another false signal coming up here.
This is why we use the yearly, monthly, and quarterly opening prices to make sure we understand what the primary trend is. And as you can see by this chart, oil spiked up higher back in June. We came back down, took another run up at the end of July, but we’ve been moving lower ever since.
Another shallow retracement this week, and we’ve fallen hard. Breaking down below the quarterly opening price at 73.61—keep an eye on that area next week. The indicators are bearish on oil, to say the least. But again, I think you will see some buyers down at the bottom end of this range, but that would be all the way down at 71.81.
So, again, if you’re buying oil to start the week, it appears to be a bullish signal on Monday and Tuesday, and then by the end of the week, all of those small gains are given back.
In most cases, you will see natural gas starting to build longs into contracts as we get into October, November, December—those heating months—and oil usually falls off at that time.
Bitcoin
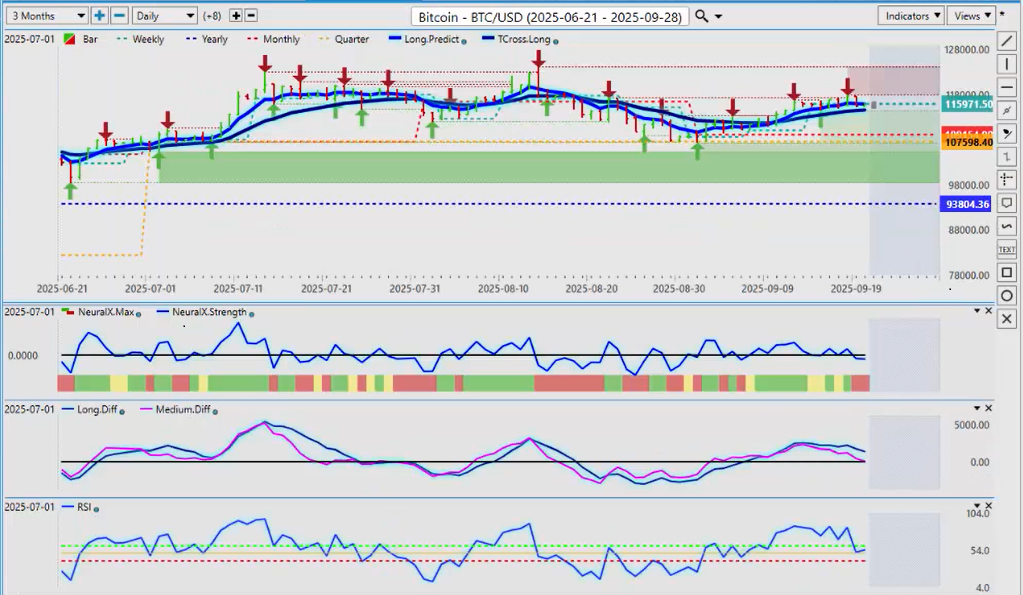
Now, when we look at Bitcoin, we are getting dangerously close to a potential significant rally in Bitcoin. But again, we’re in the third year of a three-year rally. If you go back and look at Bitcoin, we have three years up, then a significant down year. Three years up, another significant down year.
Well, guys, this is the third year of that same cycle. So, it suggests that Bitcoin would move significantly lower next year. It’s not a trend reversal. Bitcoin‘s not going away. It’s just the cycle this asset class is following.
So, the question I have is: is this the final rally? We’ve already had it? It’s possible. But in most cases, Bitcoin rallies strong at the end of September and into October. Structurally, it looks very good. We’re above the yearly, quarterly, and monthly.
But it needs to get moving quick, guys. We need to get back above 124,000 if this is the final rally on Bitcoin for 2025, and potentially a down year in 2026.
For now, we’re holding above that T-cross long at 114,683. If we can hold above that, we’re good. But these predicted differences are concerning me, as they’re clearly pointing down.
Again, we are coming into another period of known US Dollar strength at the very end of the month into the first week of the new month. Then I would potentially be looking for that bigger rally out of Bitcoin.
Euro versus U.S. Dollar ($EUR/USD)
Now, looking at some of our main forex pairs—all eyes again will be on the EUR/USD next week. You can see that, like the DAX, the euro is under pressure here.
So, we’re basically at a make-or-break area. After the Fed announcement, we had a big spike up on the euro, but you can see the VP indicators wanted no part of that long trade at those levels.
If the euro can rebound, it will have to be next week. If it doesn’t, it’s in much bigger trouble. Our monthly opening price there: 1.1695. Our T-cross long: 1.1734. Those are your support zones to start the week.
If we lose them, the euro is likely moving significantly lower, probably down into the 1.1574 area by the end of the week or the end of the month. If we can hold that T-cross long and the US Dollar Index comes under selling pressure, then that would be the only thing to send the euro higher.
U.S. Dollar versus Swiss Franc ($USD/CHF)
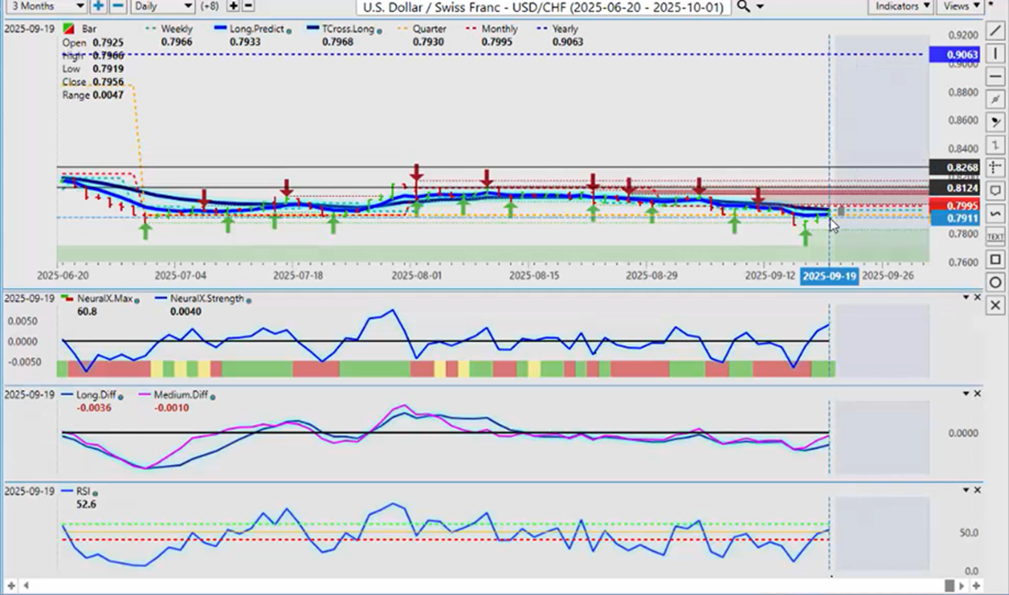
Now, USD/CHF is very highly correlated to the US Dollar Index. I would keep a close eye on this pair. If the dollar continues to advance, so will this pair.
The level you need to watch for next week is 0.7995, the monthly opening price. If we can break through and close above it, that confirms dollar strength. The indicators in VP are bullish on this pair.
British Pound versus U.S. Dollar ($GBP/USD)
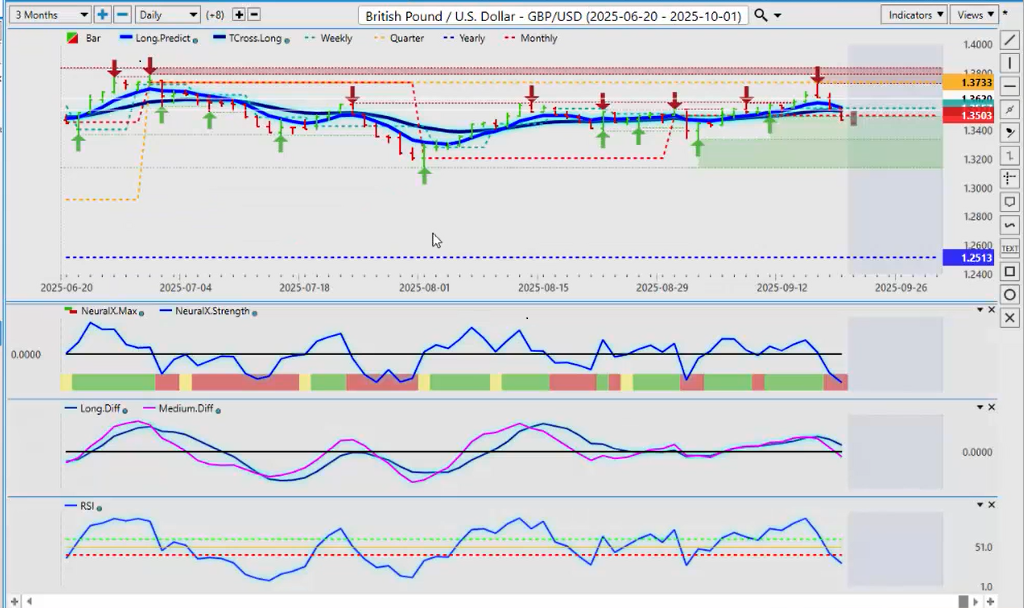
The GBP/USD for next week is basically a euro/US trade. The pound is already breaking back down below its monthly opening price.
The pound rallied right up exactly to the quarterly opening price at 1.3733 and literally hit a brick wall. That’s the importance of using these opening prices. Above it, long; below it, short.
So, the pound could be giving an early warning sign of what’s about to happen to the euro. Keep an eye on the monthly opening price at 1.3503. We’ve got to retake it quickly. If not, it confirms continued dollar strength.
U.S. Dollar versus Japanese Yen ($USD/JPY)
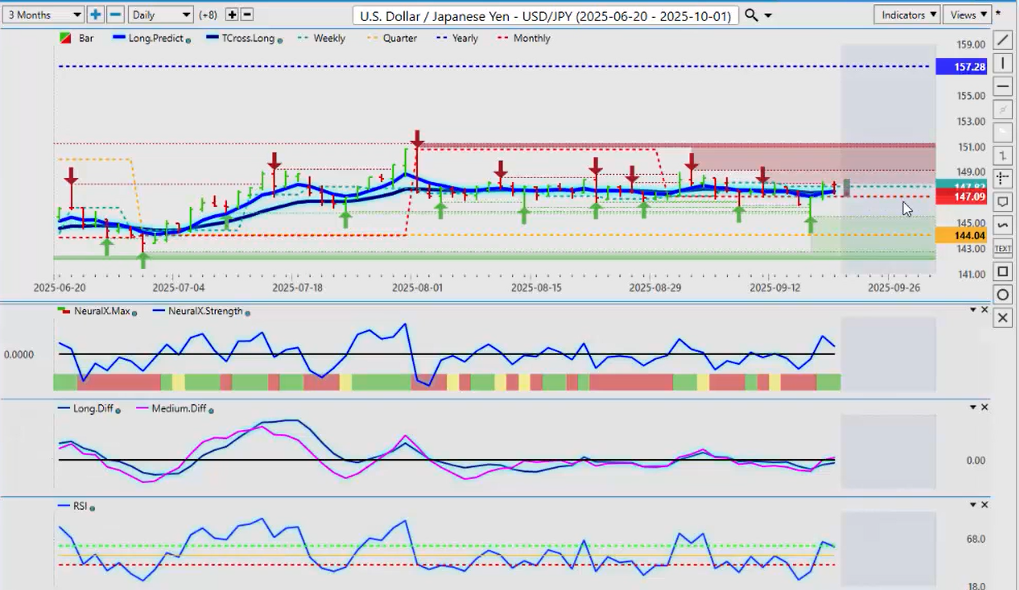
Now, the USD/JPY is recovering. I remain in the camp to sell rallies on this pair. The interest rate differential between the BOJ and the Fed will change slowly, but the carry trade is likely getting a little nervous.
For now, VP indicators are moderately bullish. We’re above the quarterly and monthly openings. Key levels: 147.09 and 147.44. We closed the week at 140.97.
So, right at the start of the week, you know your key support levels.
U.S. Dollar versus Canadian Dollar ($USD/CAD)
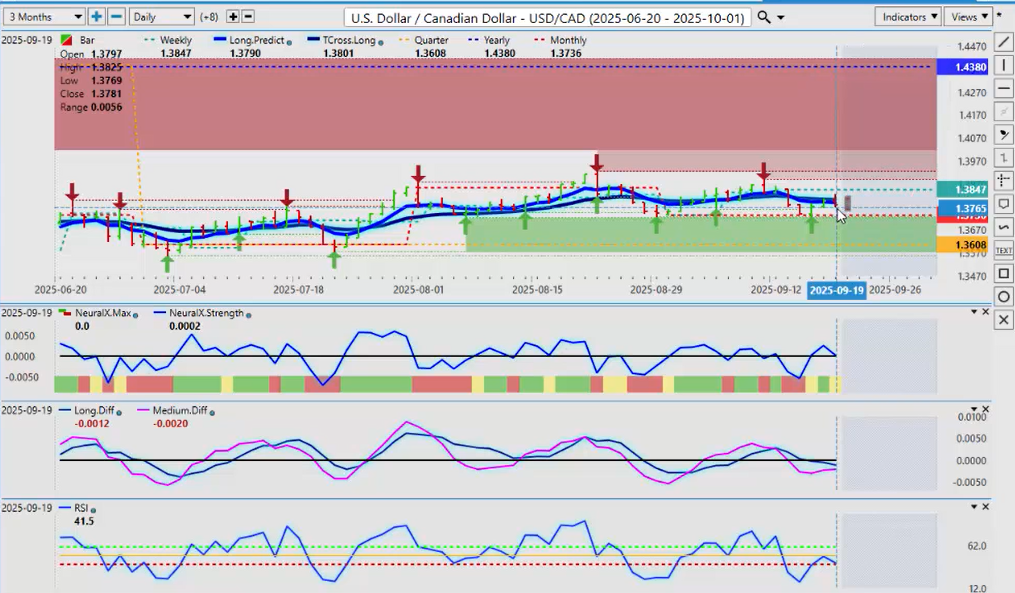
Now, with the US Canadian dollar, uh, uh, once again, uh, very, very little reason to be buying the Canadian dollar. Uh, oil price—uh, prices—coming under pressure. Uh, gold prices a little shaky. Equities— we could see a significant correction. Still no trade deal between Canada and the US. Um, the, the, the most recent prime minister that’s been elected. Uh, policy is not going very well at all. There’s more money flowing out of Canada than into Canada. So, again, do we want to be buyers of the Canadian dollar, and based on—around the, uh, inner market correlations? Uh, there aren’t—there are not a lot of reasons at the current time, uh, to be buying the Canadian dollar. So, again, as long as we can hold above 1.3736, and you can see we came down and touched that monthly opening price on Wednesday of last week, and there was a rebound. Now, it’s still a little bit soft here. I believe that the Canadian dollar can strengthen if we get that trade deal, if some of the things in some of the policies are changed in the, in the current administration in Canada. But I’m, I’m—my optimism on that remains heavily guarded at this time. And I believe that longs on this particular pair is the better play while above that critical, uh, monthly opening price. But if we can hold above the VPT cross long at 1.3801, we could see a bigger rally to the upside. Uh, definitely.
Australian Dollar versus U.S. Dollar ($AUD/USD)
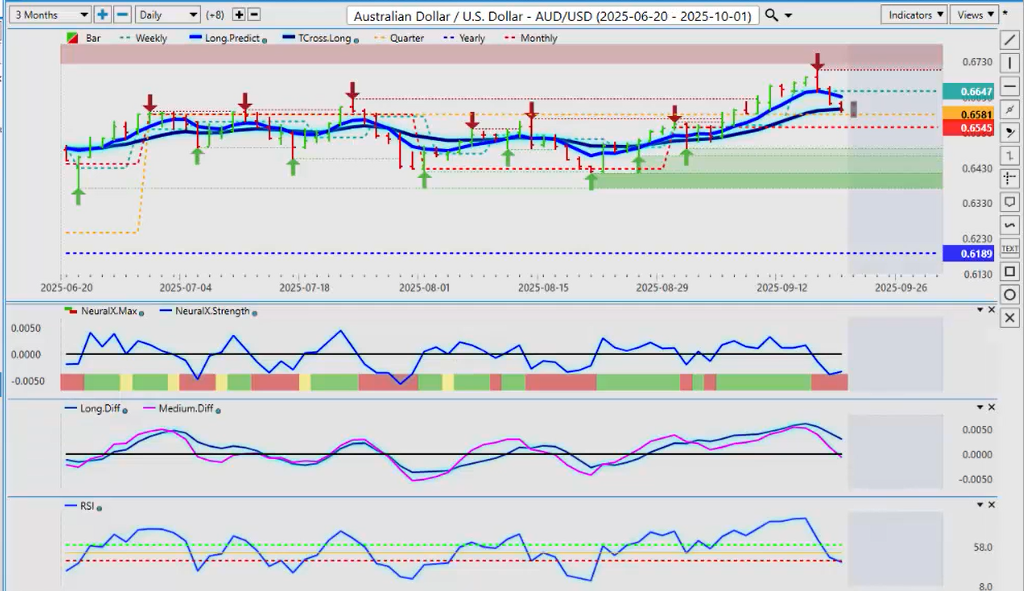
Now, the Aussie and the Kiwi giving a little bit back this week, particularly the Kiwi. We’ve had a full retracement again. The market having to rethink—uh, do they want to be long or short the US dollar? And you can see that, uh, closing out positions, profit-taking— that could be all this is, guys. And I will stress that the euro could fully rebound next week. The Aussie could rebound, but there’s a lot of things that have to happen, uh, to support that. So, we need to hold above the VPT cross long, 0.6595. And you can see, between the weekly opening price and the monthly opening price, the quarterly opening price is sitting right there, 0.6581. So, again, if we can’t hold above these levels—and the VP indicators are basically saying it’s not going to be easy to hold, to hold up here. We’ve got a medium-term crossover. The pink line has crossed over the zero line. Predicted RSI is moving into bearish territory. Now, again, this could be just profit-taking. So, again, as long as you know your levels, based on what you see on this chart, you’ll be just fine, and you’ll know how to react to that. But 0.6545 is likely going to be tested right at the start of the week. Let’s see how it reacts to that, and we can go from there. But if it holds, then we still have a long trade here.
New Zealand Dollar versus U.S. Dollar ($NZD/USD)
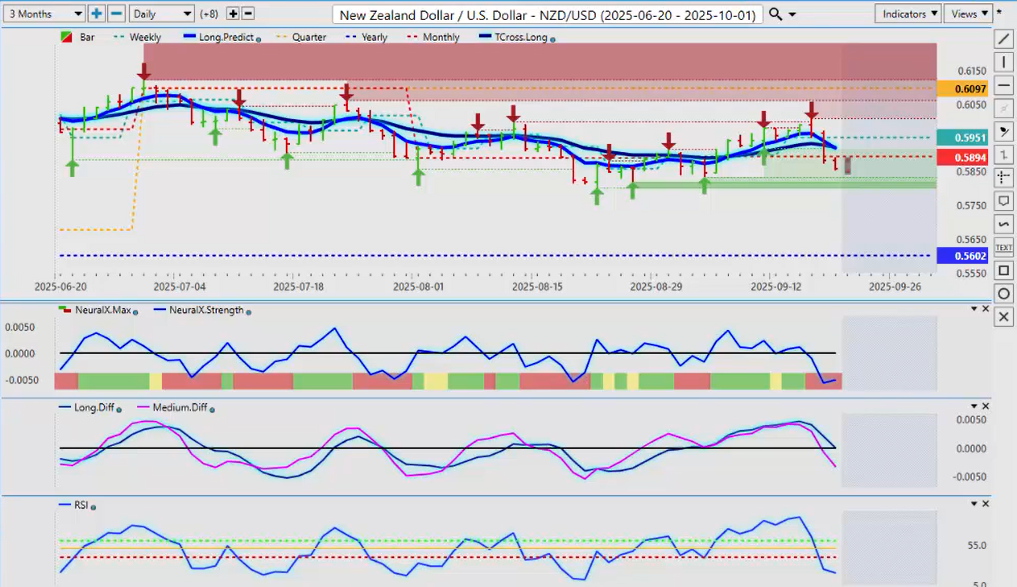
Now, the Kiwi—I’m not sure it can be quite as supportive as that. Uh, the market is interpreting that the, uh, the Bank of New Zealand is becoming ultra-dovish, and there’s going to be multiple, multiple cuts going forward, which may very well happen. But we saw how that worked out for them when they believed that about the Fed. And the media is really winding people up here. So be careful of that, too. But for now, the Kiwi is likely to move into the bottom end of these verified zones, down around 0.5818. I anticipate, at least at the first test, that that 0.5818—maybe a hair lower at 0.58. Uh, but I anticipate that area could hold at least for next week. But the market’s becoming very, very dovish on the Kiwi, and I’m not convinced that that’s what they should be doing going into year end, as the dollar—I would anticipate the dollar weakening, either way, into November and December. So, we, we do have another choppy, volatile week ahead, but with that—provided you know your levels—opportunity will come with that. So, with that said, this is the Vantage Point AI market outlook for the week of September the 22nd.

