


Welcome to the Artificial Intelligence Outlook for Forex trading.
VIDEO TRANSCRIPT
Hello everyone, and welcome back. My name is Greg Firman, and this is the Vantage Point AI Market Outlook for the week of September 25th, 2023.
S&P 500 Index CASH
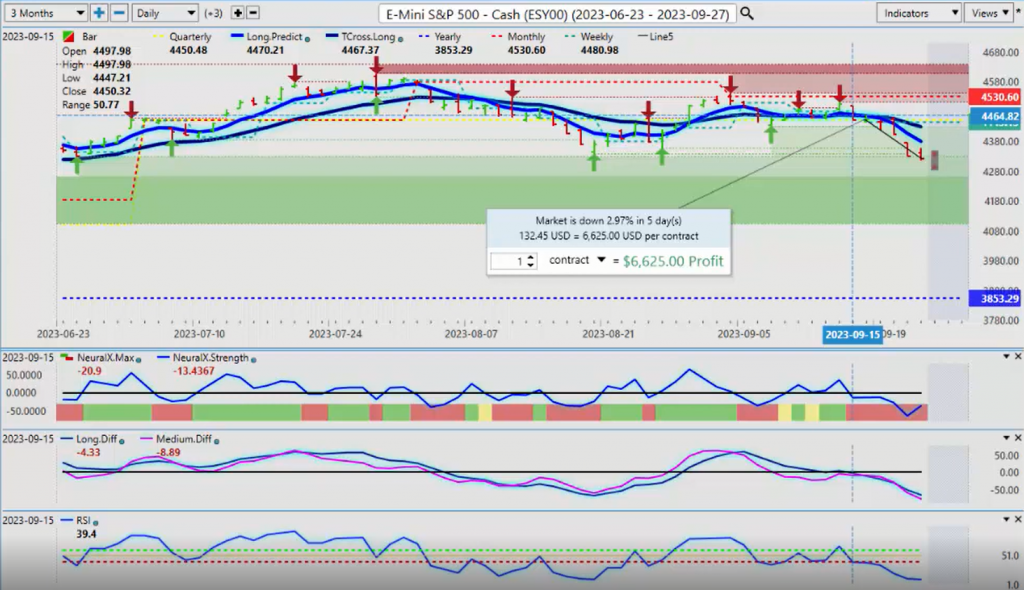
Now, to get started this week, we’ll do an accurate view of the mark your tier. Again, we really do want to stay away from the rolling performance model and stick with our current monthly, weekly, yearly opening prices. So we can see that the SPYs or the S&P 500, which is the same thing, turned bearish a week ago Friday. We’ve closed down below the VantagePoint TCross Long, but more specifically as per last week’s outlook, we could not hold above 4450 to keep that bullish momentum to the upside and subsequently have fallen about 3% on the particular week.
Now, the indicators from VantagePoint warned about that. On Friday’s update, we can see our neural index strength breaking down below the zero line, the predicted differences breaking below the zero line, and of course losing or gaining momentum to the downside with the predicted RSI.
So it’s very important that we measure the markets from the current monthly opening, the current weekly opening, and the current quarter and yearly opening, so we know exactly where we are.
Now in that discussion with the SPYs, again, we’re looking for the SPYs potentially, or I’m looking for them to turn around probably around mid-October. What we do often see at month end flows like we did in August, you can see that that also tricked the retail trader into buying this and holding this only for it to drop substantially with that seasonal pattern at the beginning of September.
Now, the seasonality in stocks, usually they turn when the dollar turns after the US fiscal fourth quarter ends, which is October the 1st. So I am looking for some strength in the equity markets, but not until we get potentially real strength until we get past the middle of October.
The indicators here for next week, the for you stock traders, there is some sign of life here with a reverse check mark on that neural index, which is usually a warning sign that we’re going to see some sort of corrective move, higher or lower. In this case, it’s higher. But again, when we do a comparative analysis to this and we look at Tesla, which was discussed last week, that Tesla was unable to break above the quarterly opening price at the … And again, using the accurate third quarter pricing, that price coming in at or about 276 on Tesla, we couldn’t maintain that. And subsequently we’ve dropped almost 10% in less than a week.
The trader gets stuck because again, that rolling performance, random five days, random 30 days often leads to pricing that is not accurate because again, when we look at the S&P 500 more closely, we can actually see that there hasn’t been bullish momentum in this particular market since late July. August was a terrible month. But the main thing we need to understand is the high positive correlation that the Tesla has to the S&P 500.
So again, the condition to buy this, we would need Tesla stock breaking above the quarterly opening price, but we would also need the S&P 500, as I stated, holding above its quarterly opening price. And again, as soon as the S&P went down, it pulled Tesla down with it. But this is all basically related to the dollar index, the strength in the dollar.
U.S. Dollar Index
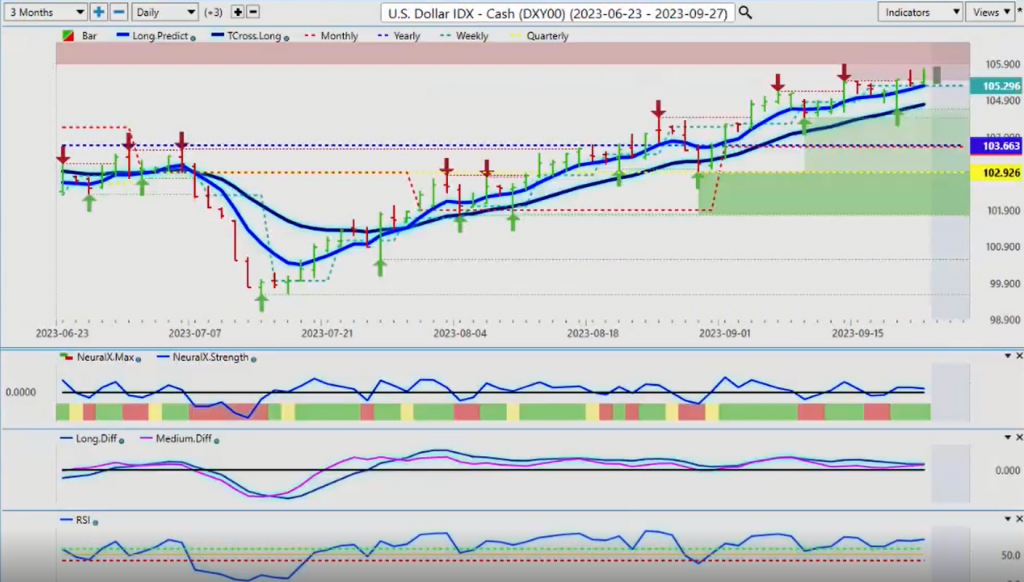
Now the Fed is coming off hawkish again, but in my respectful opinion only, he’s got this wrong, and Morgan Stanley, a few of them are coming out now saying, “No, we fully expect a cut by March.” I’m in that camp too. I don’t believe that the hike, any further hikes are warranted, but I don’t work for the Fed.
But as we can see, as the dollar moves higher, it pushes the stock markets down, it pushes the stock indexes down. So right now, the dollar, again, if we look at the seasonal pattern of this, the dollar usually starts to lose ground in about the second week of October. So I don’t think that anything has changed here.
Last year with those excessive rate hikes, the dollar still didn’t make any gains past October. So I would look for that seasonal pattern to repeat itself and the dollar start to soften a little bit. But for now, we still have that dollar cycle at the beginning of the month. I’m not expecting any significant weakness in the dollar until after October the 8th, but that could come early. So we look to the VantagePoint indicators to see if we can find that. And right now they’re still bullish, but again, our TCross Long is 104.78. The further we move away from this price, the more likely it is we’re going to retrace to it. But as you can see, using that accurate quarterly opening, monthly opening, yearly opening price, they’re all stacked below creating that support level. But I do anticipate, again, some dollar weakness starting in mid-October.
Gold
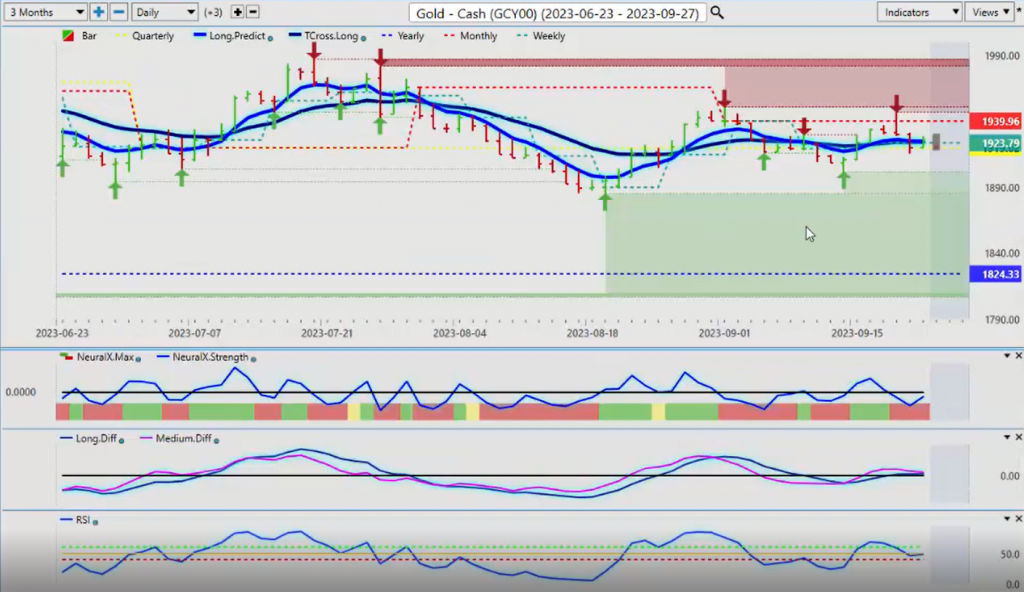
Now when we look at gold prices here, gold again, another strong week for gold, as was suggested in last week’s weekly outlook. And again, any third party comments that come in for other services are automatically deleted by VantagePoint. Once again, I focus primarily on intermarket correlations, seasonal patterns, predictive indicators, and again, I don’t get involved with some of the other lagging methodologies. But right now we can see we have a reverse check mark here, the same one that I’ve shown you on the S&P 500 suggesting we’re getting ready to move higher.
But when we look at this from last week, when we go back five days from the start of the week, once again, wherever gold goes from here, again, this is a weekly presentation, guys, not a long-term presentation. Each week the markets are updated. So again, all the indicators in the VantagePoint software last week said that gold was going higher, which it did, and subsequently we still remain flat.
But what I’ll point out here is that even with that hawkish Fed, it brought gold back slightly from the high of 1947, but a very minor retracement, and we’re still sitting here for the most part. We have no downward momentum here on the predicted RSI, the predicted differences. Now, the neural index strength, which takes the correlation of 31 other markets in its forecast. But to give you a better idea, in the science of intermarket analysis, what we want to look at is the correlations both positively and inversely that drive gold. Not silly wave theories, this kind of stuff. This is 1800s, early 1900s technology, you can compliment it intermarket analysis with your wave, but it’s certainly not a standalone system.
When we look at this right now, this is what’s driving gold. If we look at gold on a yearly basis, these are all the positive correlations. If I look at it on the quarter, you can see that we get a different set of intermarket correlations. So again, the point of these presentations each week is to assist traders understanding how important what these correlations are and that they are actually what drives the market. The last thing we want to be doing is tracking impulse buying and selling. That’s the retail trader. We saw what happened with that, with the SPYs, the S&P 500 and Tesla. Without the proper setup, you could get a misleading price.
And again, what I’ve said with gold is gold over the last 10 years was absolutely bearish between September 28th and the end of the year, but over the last five years, it’s been up 80% of the time with a 21.54% annualized returns. So again, when we look at statistically, gold has bottomed out between September and October, and it’s risen from that price. And when we look closer at this, these intermarket correlations drive that. So whether you’re a gold buyer or seller, that’s your call, but again, the science of this does not support gold shorts this particular month, even with again, a very, very hawkish Fed still is not convincing people to leave that gold trade, not as of yet. And again, a very strong buy this past. Week while you’re sitting there waiting to short this thing, you could be making money on the long side. That’s the whole point.
So these intermarket correlations are measured on a monthly, quarterly, and yearly basis. So if gold does go down, then this gives the opportunity to buy something like US Singapore dollar, HF Sinclair, RBOB gasoline, heating oil. But these inverse correlations tell us that we’re at the end of the cycle on heating oil. We’re likely going to see that rise.
So again, when we look at this for now, we have good, strong verified support at the 1900 mark. And again, from a factual standpoint, what I’ve stated, gold usually bottoms out at the end of September. The month of September is a terrible month to buy gold, but October, November, December are some of the best months. So again, we’re always looking forward. And should the dollar seasonality remain the same, then we would see gold move higher, not lower by probably as early as September the 28th, but I think it will be closer to the October 10th mark.
So hopefully that clears some of the things up with gold. But again, any third party comments pointing towards other services will be immediately deleted.
Bitcoin
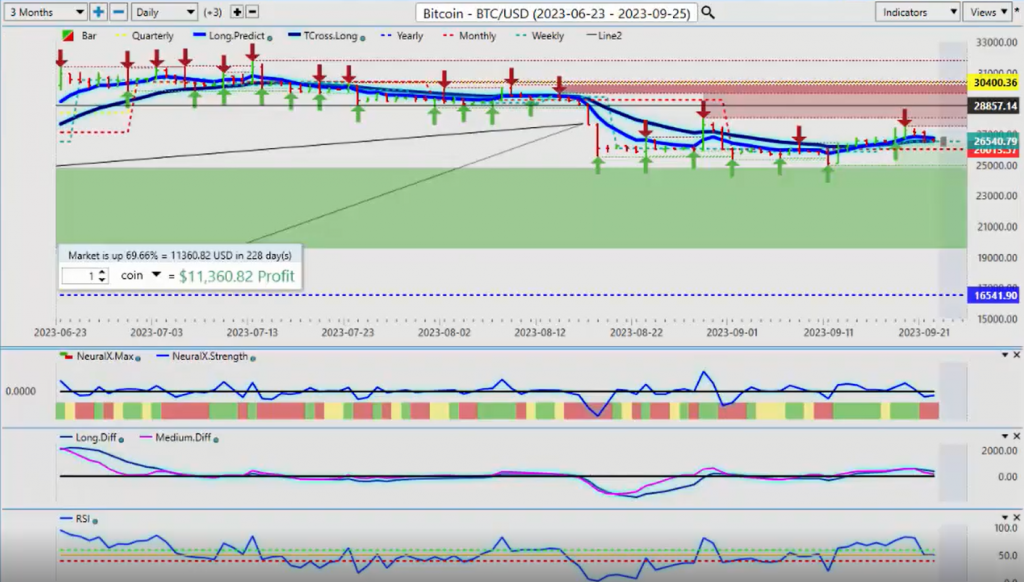
Now, when we look at Bitcoin, again, Bitcoin coming into a strong seasonal pattern in the early parts second week of October. So we want to watch this one very closely. We’re holding above that very important monthly opening price at 26,013. Keep a very close eye on this. I imagine they’re going to try one more move to flush the markets out like what they’ve done with the S&P, the SPYs, some of your stocks this past week. They’re likely going to try this with Bitcoin too, but be on the hunt here, guys, for potential longs.
A very strong seasonal pattern in Bitcoin forms, usually in the first or second week in October, and at some years as early as September the 28th at the end of that US fiscal fourth quarter. Again, we must use some fundamentals when we’re looking at our trading, but for now, the indicators on VantagePoint are sideways, but they are showing no significant downward momentum.
Crude Oil
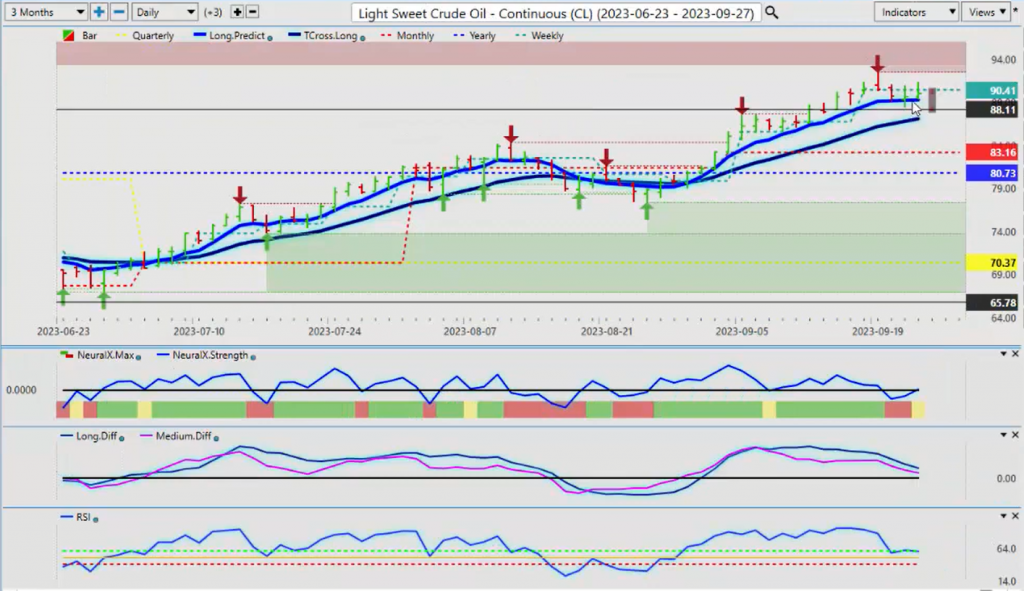
Now, when we look at light sweet crude oil for next week, once again, this verified resistance high. We’ve had a big spike up this past week, but we’re not getting a lot. When we look at it from a weekly opening, an accurate weekly opening, not a random five days here, guys, 90.41, not a lot of buyers up here. We’re closing the week here at 90.03, and again, a very mixed bag here with the indicators, but not a lot of downward momentum at this particular time, but I believe we will see that come mid-October. But for now, it’s still mildly bullish, but I would be very surprised if we can get backup over this newly formed verified resistance high, which is coming in at 92.43.
I think potentially there’s a very good short here. We just have to be cautious. Again, we don’t want to fight the trend. We’re above the yearly, the monthly opening price and firmly above the quarterly at 70.37. So when we look at it from the standpoint, while it is surprising oil has gone up at this time of year by the charts and by the VantagePoint software, this call started back here. I don’t like to do this because this is an outlook, not a recap of something that already happened. But you can see where this started, which was the beginning of September.
So that strengthened the dollar where they keep saying the inverse correlation between oil and the dollar, I would respectfully submit the two have been highly correlated in the month of September. So again, that theory one up, one down, I’m not really buying into that guys because you can see the oil and the dollar index are both moving up and down actually together. So any crack in the dam in oil could actually be the confirmation we need that the dollar is getting ready to sell off in that first second week of October.
Euro versus U.S. Dollar
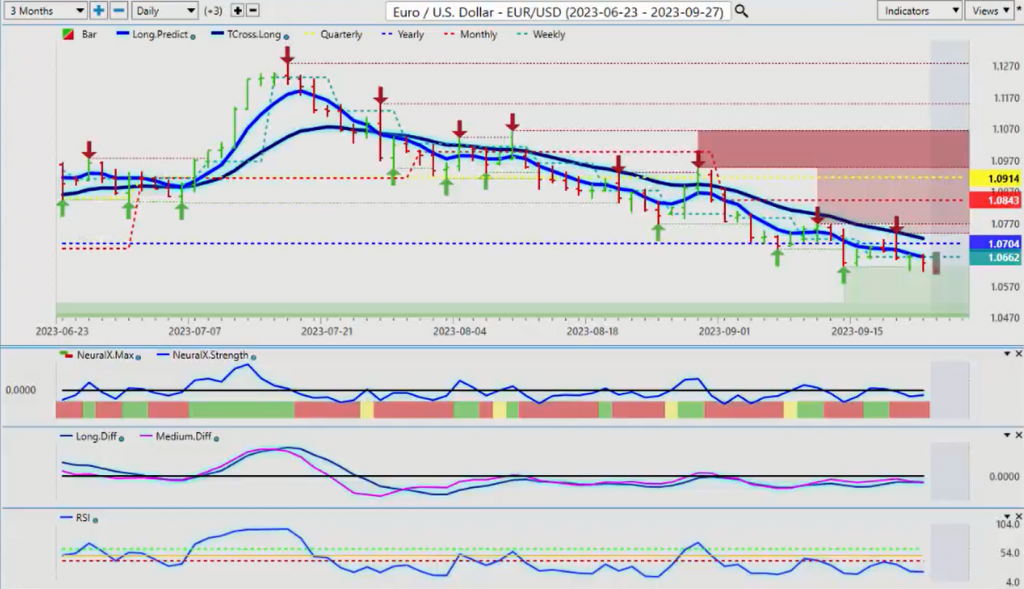
So when we look at, again, some of our main Forex pairs, the Euro really taken a beating again this past week on this dollar strength. But the probability that we’re getting near the end of this based around that dollar seasonal pattern, most traders don’t see that seasonal coming around that mid to early October point. And now I’m not saying the Euro’s going to go into a new trend, but I’m saying that predominantly the dollar does not do well in its fiscal first quarter, which is October through January 1. So again, right now we’ve got a verified support low 1.0632. Watch out for one more move to the downside that flushes this all out, anybody who’s long on the Euro and then we go higher.
That’s just a personal side note that I can warn you that I’ve seen many times at this time of year where the Euro looks terrible in September, but then in October it turns around. So we’ll be watching that very closely. But for now, we’ve got support down here. The indicators are dead flat based around the Fed this past week.
U.S. Dollar versus Swiss Franc
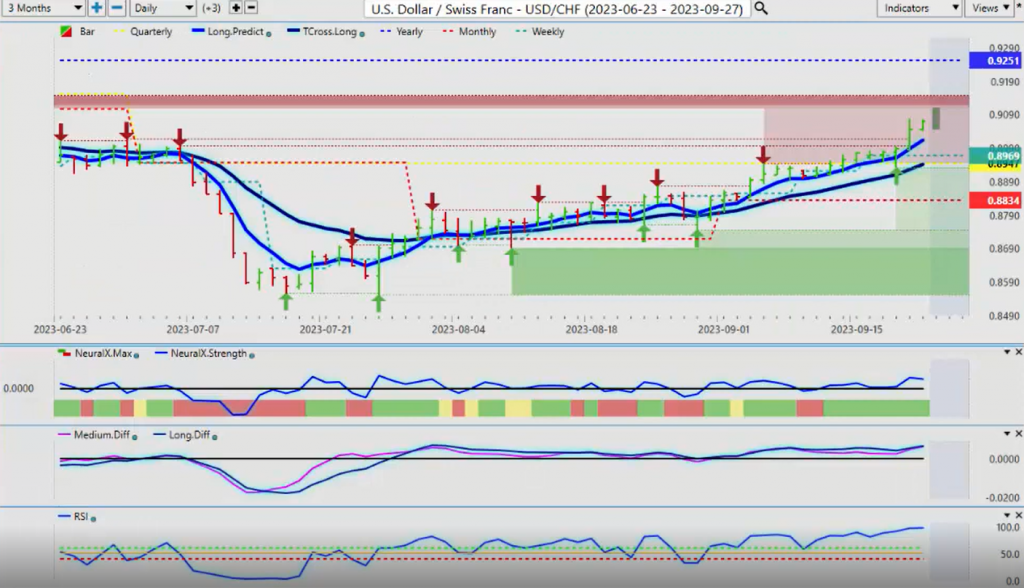
That’s pushed US-Swiss Franc. We’ve talked about this one over the entire month of September that soon as we clear that quarterly opening price and that verified resistance high at 8945, we’re likely going to see this thing accelerate to the upside, which we’ve now done. But we’re still bearish on the year, guys. That’s an indisputable fact using proper anchor points. The January 1st yearly opening price, 9251, technically it’s still in a downtrend. If you bought this on January 1st, you’re still losing money on that short. So I don’t anticipate we will overtake 9251 regardless of what this Fed does.
We’ve got numerous things going on globally that could lead to a risk-off scenario, which would again push gold higher, the Swiss Franc higher, and maybe even the Japanese Yen. But for now, we just need to understand that at any time after September the 28th, shorts on this pair are definitely viable, and that’s where we look to our VantagePoint software to point us in that particular direction.
British Pound versus U.S. Dollar
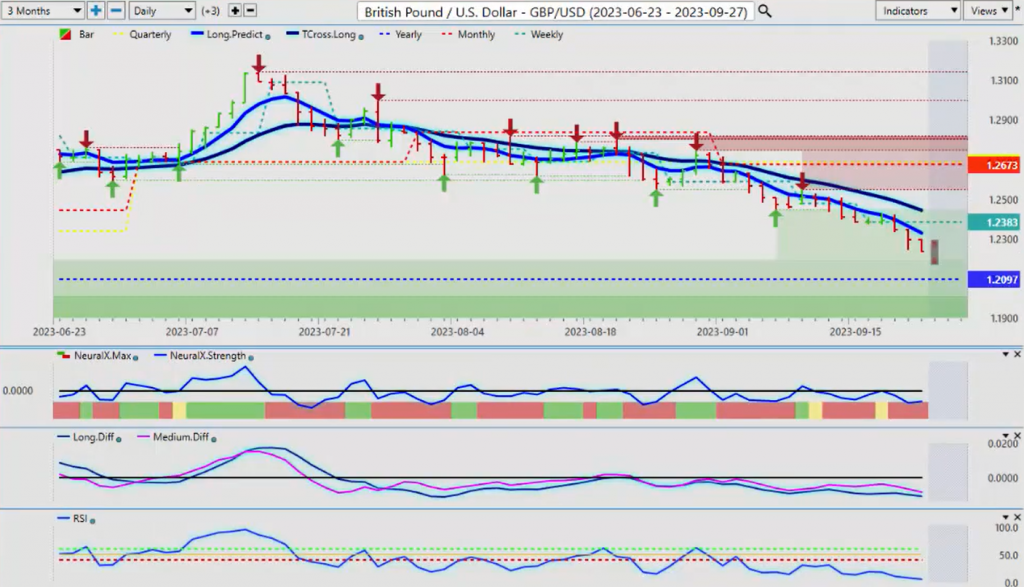
Now, the pound-dollar, again, these trades have one thing that are all in common here, and that’s that they’re all based on the US dollar. You’ve got pound, dollar, Euro, US, US Canada, Aussie US, US Japan. They’re all G7 currency pairs. So the pound is again, for the savvy trader that is using the proper performance measurements, we can see that the pound is actually still positive on the year. If you sold the pound-dollar at the beginning of the year, you’re still losing money here, guys. If you bought it, you’re still technically up. So 1.2097, watch for a reversal around this particular area. And that could come sooner.
Now, the UK has certainly got their issues, but again guys, we look past this and say, “Okay, if they start selling dollars across the board, could that benefit the pound?” The answer is yes. Stocks go higher. Gold goes higher. All of that helps these currency pairs. So watch this area very closely. We are at 5.9 on the predicted RSI. Not exactly the best place to short in my respectful opinion, but that doesn’t mean it can’t go lower if the Fed comes out. The Fed is speaking, I think next Thursday or Friday. So just be a little bit cautious with this. But look around just after the beginning of October for again, potential reversal countertrend longs.
U.S. Dollar versus Japanese Yen
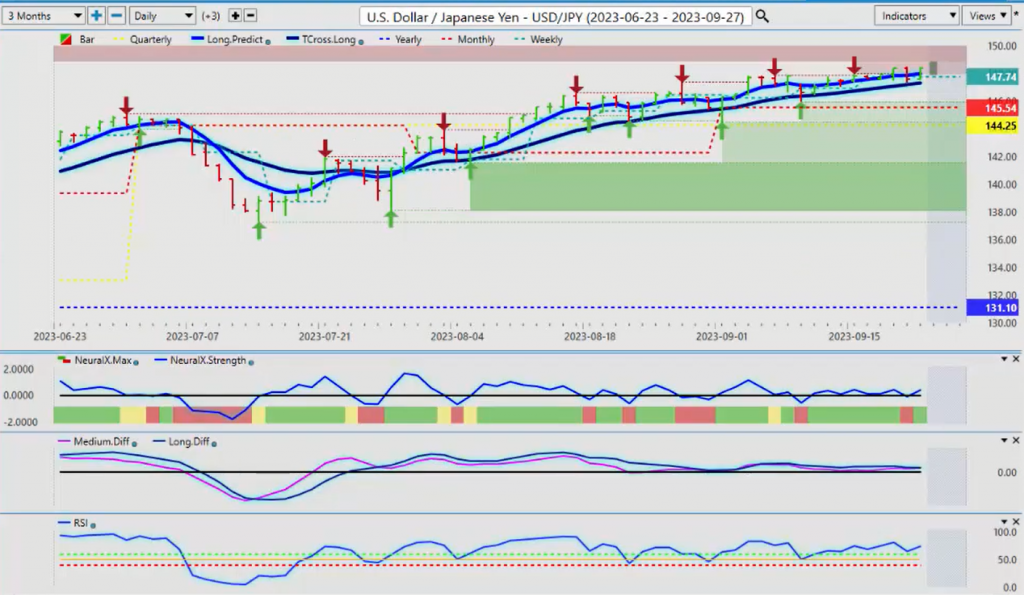
Now when we look at the dollar-Yen again, you can see that we’ve come right down to the VantagePoint TCross Long, hit that level and gone back up again. Again, this is by definition the carry trade guy. So we’ve got to … I know it looks like such a great short, and I can tell you every short I’ve taken on this has struggled or lost money. So again, I’m not saying that a short isn’t coming, but I don’t think that’s going to be until again, mid-October, maybe even November.
So again, we’ll watch that very, very closely. But the indicators in VantagePoint are saying we’re still going higher. So how much further can we go? Well, when we look at this over the last little while here, even going back into October 2021, you can see that that’s when the dollar’s index stopped making any gains. The Fed was hiking equally, was hiking more last year than it is this year. So the potential that if the dollar seasonal pattern comes to fruition in mid-October, it could be one heck of a short on this pair, but it’s just not there yet, guys.
So again, we’ll monitor it next week and the week after as we go into this. But for now, be very, very cautious with countertrend shorts because it is not supported at this particular time by way of the carry trade or by the VantagePoint indicators, and that’s what’s guiding us through this.
U.S. Dollar versus Canadian Dollar
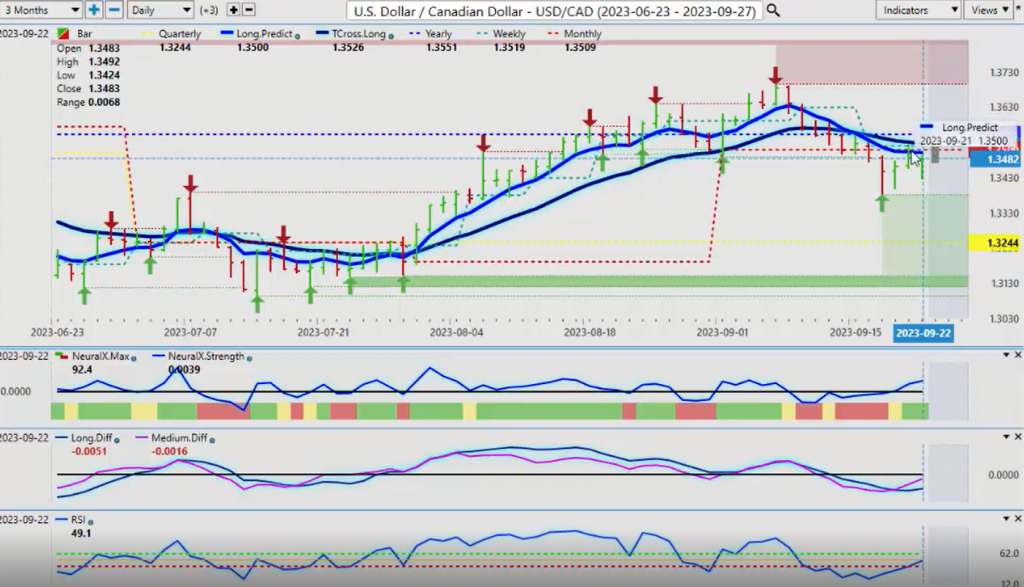
Now, the US Canadian pair, a very choppy, choppy week here. But again, as you can see when we approach that VantagePoint TCross Long, we’ve got the monthly opening there, the yearly opening, the weekly opening, all stacked in that particular area. But these are current, the current weekly opening price. If you’re below it, shorts are good. Above it, you’re long.
The same thing applies to the yearly and the monthly and the quarterly, but the quarterly is still very bullish at 1.3244 on this. So again, if the equity markets come under more pressure and oil turns lower, then US Canada moves higher. But again, as we get into mid-October, you can tell and hopefully you can pick and read between the lines here that I’m warning you to be careful. Volatility is very high between mid-September and mid-October. I would argue it’s one of the highest volatility periods of the year, and this payer could get caught up in it. But I think that it’s going to be difficult either way for the Canadian dollar to strengthen because of a number of fundamental factors. The Bank of Canada is, I feel, is going to be on hold permanently now. I believe the Canadian economy will go into recession, so it doesn’t really benefit the Canadian dollar.
And then if oil prices fall, even if you get a weaker dollar, usually when the US dollar weakens, the Canadian dollar weakens with it because Canada and the US, the two biggest trading partners. So for now, for next week, in order to get really bullish on this thing, we would need to break above 1.3551. But the TCross Long at 1.3526, that’s the first level we need to break. But be careful. There’s significant resistance at 1.3551, and we have a newly formed verified support zone that’s coming in at or about the 1.3381 area, which was my projected low for last week.
Now, the indicators here in VantagePoint, this one is a more defined outlook here. We can see that our neural index strength is broke above the zero line with the neural index. We’ve got an MA diff cross suggesting that this move lower at the current time was simply corrective in nature and we are going higher. So if you’re not sure about this, the other way you can play this, put your buy limit order above 1.3551 or above 1.3526, and wait for this thing to clear this. And then we would likely be targeting back towards the 1.36, 1.37 area. But my optimism on that is a little guarded because I feel that those equity markets could turn, and if they do, that’ll benefit the CAD.
Australian Dollar versus U.S. Dollar
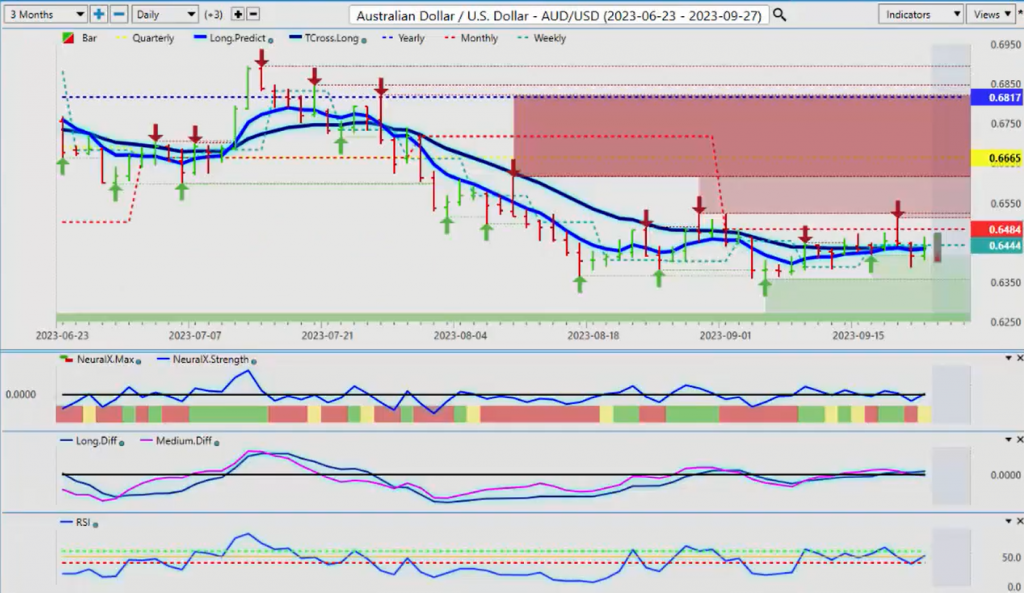
It will also benefit the Aussie and the Kiwi. So if we look at the Aussie this past week, you can see the accurate levels 6817, 6665, on the current quarter, 6481, 6439. But here’s the deal, guys, on October 1, that quarterly opening price when we go into the fourth quarter is going to move all the way down here, which I believe will provide us with very strong buying opportunity.
And the VantagePoint indicators, the second we get that confirmation, and I could argue that that’s to some degree there is starting already. We have no further downward momentum. Our predicted differences are above the zero line. The neural index strength, the reverse check mark and above the zero line, but it’s still cautionary yellow. It’s right on the line. So for now, if we can turn positive on the month, the monthly opening price, 6484, then that would set us up for potentially a rally in this pair in the month of October and November and December.
New Zealand Dollar versus U.S. Dollar
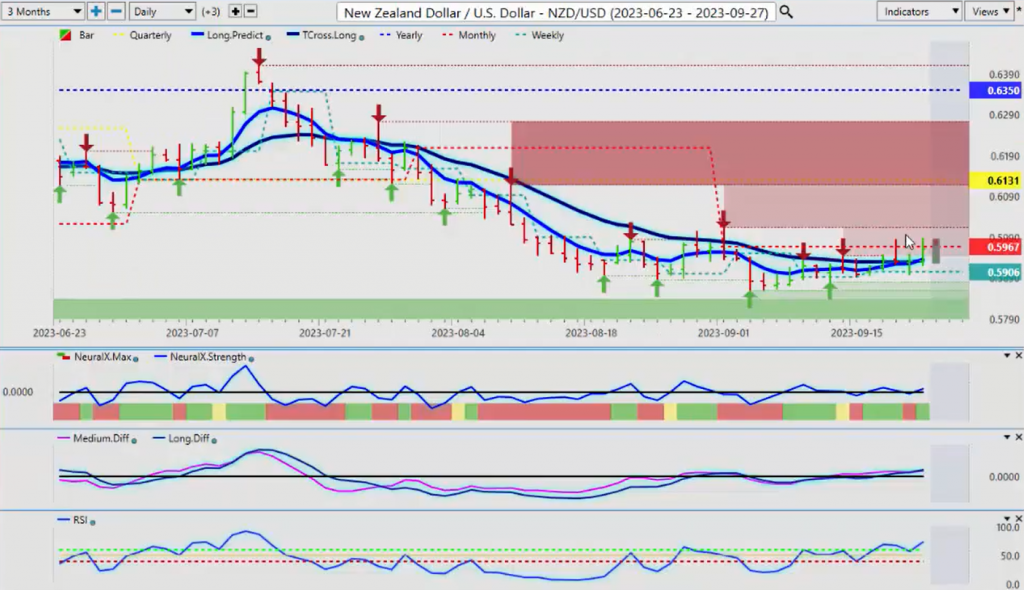
And the same thing would be applicable to the Kiwi. But you can see that the Kiwi is very pronounced at the current monthly opening price at 5967. So if I took a random 30 days and moved it back here, you wouldn’t even see that level. It would be like the S&P or the Tesla. You would get caught on the wrong side of that trade. And the benefit, again, it’s not about being right or wrong in trading and investing. It’s about pointing towards these levels to make sure you don’t get caught in a bull trap or a bear trap. And I believe there’s a number of traps being set up right this very minute.
So with that said, this is the VantagePoint AI market outlook for the week of September the 25th, 2023.


