


Register for a Free Live Training
The Hot Stocks Outlook uses VantagePoint’s market forecasts that are up to 87.4% accurate, demonstrating how traders can improve their timing and direction. In this week’s video, VantagePoint Software reviews forecasts for SPDR SPY($SPY), Spotify($SPOT), Trip Advisor($TRIP), Raytheon Technologies($RTX), Freeport-McMoran($FCX), Shell($SHEL), Occidental Petroleum($OXY)
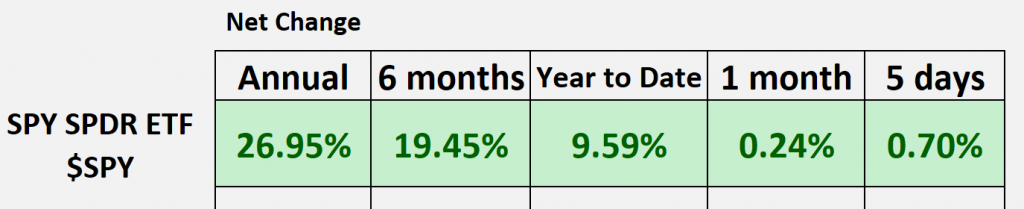
SPDR SPY ETF ($SPY)
Hello again, traders, and welcome back to the Hot Stocks Outlook for April 12th, 2024.
Hope you all had a nice week out there in the financial markets. As always, we’re going to take a look at the most recent VantagePoint predictive forecast.
So, if you haven’t already, make sure you go ahead and click on that link in the description below and you can get yourself signed up for a live demonstration to learn all the specifics about how these predictive tools can help you make better trading decisions in the marketplace.
Now, as we typically do, we can take a look at the Spy ETF, and what we see with the VantagePoint predictive indicators is we actually see that predicted moving average crossing to the bearish side. The predicted neural index is getting bearish, bullish, and moving back to the bearish side, and it just highlights the very mixed nature throughout the equity space and why you really want to be positioned in the right things. What we’re currently seeing is again those inner-market relationships really weighing on equity prices and determining where you’re seeing the most momentum pick up in the marketplace. As we look back at the longer term here, well, we can see that year to date, we’re still up about 10%, but we’ve had a pretty choppy and sideways period where we’ve seen that sector rotation throughout the marketplace.
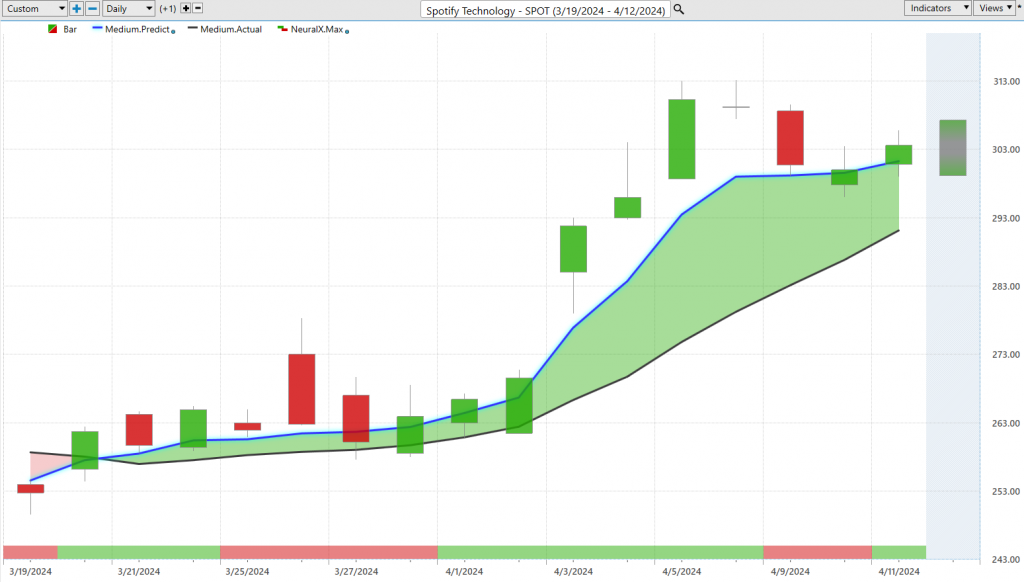
So, this is where we have some really great examples of how VantagePoint predictive indicators can Spotify Technology ($SPOT) be used together here. In Spotify, what we have here is daily price action where each one of these candles represents a full and complete trading day, and it’s right up against that price data that you’ll notice that there is a black line and a blue line value. Now the black line value that you see there, well, that is a simple moving average, a very common technical indicator. In this case, it’s a 10 period simple moving average, and so what it does is it just looks back over the past 10 closes, adds all those days together, and then divides by 10, but really the weakness there is that all that data comes from the past, so it really just lags behind what’s already occurred. VantagePoint traders obviously want to be ahead of that next move and know where market prices are going next, and so what we’re able to do is compare that actual moving average to this proprietary predicted moving average and for this number, essentially a prediction of future prices for that to get calculated and plotted moving forward. This is where the technology of artificial neural networks is performing what we would call intermarket analysis and so specifically for Spotify, there’s going to be known market relationships again driven via the ETF groups, via individual stocks, but also things like those important markets like currency prices, broader interest rates, and as we’re seeing now, again even individual commodities that are certainly going to weigh on particular asset prices. So specifically in Spotify again, it’s going to look at dozens of these individual markets and understand how those are affecting future price movements and what we can do is when we see that blue line cross above the black line, understand that the overall trend is up, and so as we see here, we’ve got about a 16% move in the market. But traders need to solve different problems depending on your time frame and trading approach, and so as we look down at the very bottom of the chart, you’ll see this bar that goes from green to red and back to green, and this is really tuned to solve a different problem again leaning on that inner-market analysis and that neural network technology but looking ahead just 48 hours so you can think of it as two trading days, 48 hours really just a couple of candles of short-term strength or weakness and also momentum in the marketplace. And lastly here, of course, we look at the VantagePoint predicted high and low range, and so that’s what this shadow candle has, all the way on the right-hand side of the chart, and what we can do is actually compare how accurate are those levels relative to the actual market performance. And so as we look back, we can find markets where the overall trend is up, and of course, look to potentially accumulate a position down near these VantagePoint predicted lows in this case, you see about four or five potential entries towards the lower part of that range as we start to accelerate in prices for that 16% advance.
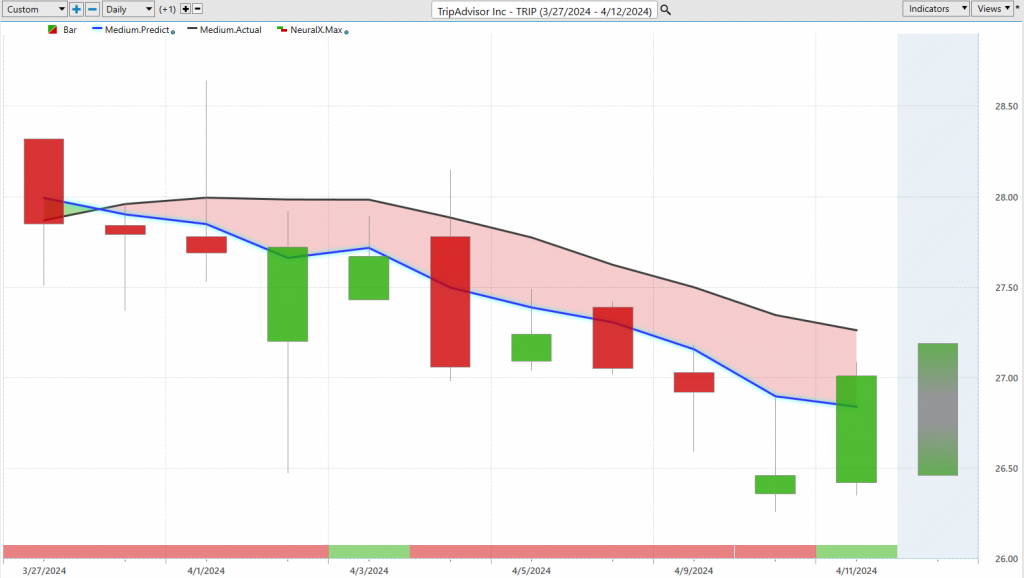
Now again, another great Trip Advisor ($TRIP) example here is Trip Advisor, so last week, really identify a lot of markets that start to turn lower and are likely going to see some price declines. Here we see the VantagePoint predicted moving average getting bearish, neural index getting bearish, bullish but reallying again that only offering up a short-term pop in prices which actually identify some again levels to short take profits on short positions. So this is actually last Friday, and you get about a 4% move lower before you get any sort of a bounce higher here. So again, we’ve seen that choppiness via the Spy ETF, certainly not a straight move higher for all equities, and so we want to understand well where are market prices being driven here, and this may be by again some of the things going on in the world right.
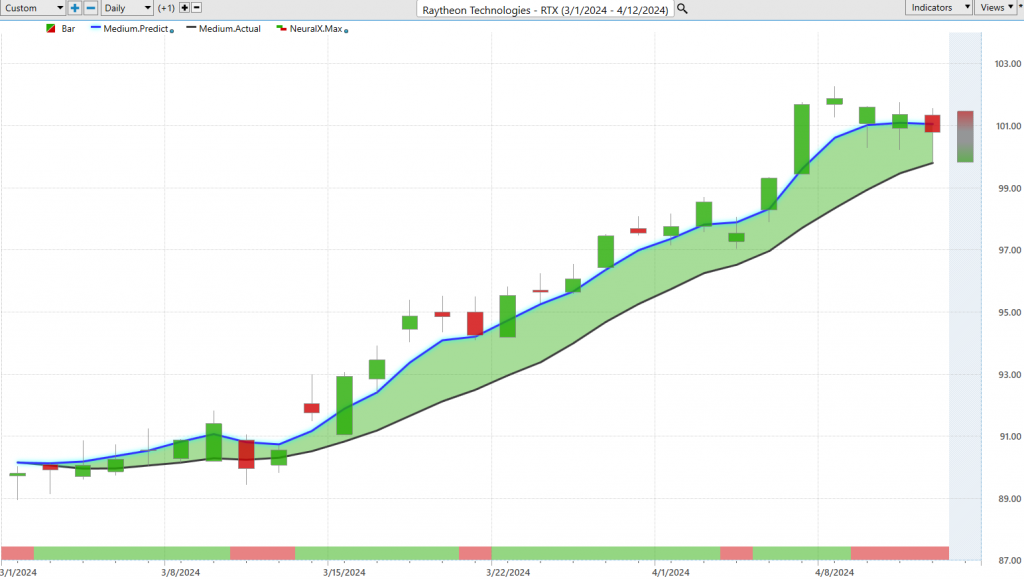
So here we have Raytheon Technologies starting to see our predicted moving averages skew quite bullish, seeing a lot of separation between these values, and again of course, we can look at those VantagePoint predicted highs and lows for potential entries along the way for Trend Traders or again short-term traders who identify that okay, well here’s an area of interest in the marketplace where a position could be accumulated, you can take some profit, and potentially reset those positions at lower prices. So really nice opportunity there in Raytheon overall here, we’ve got about a 12% rally just in the past 27 trading days.
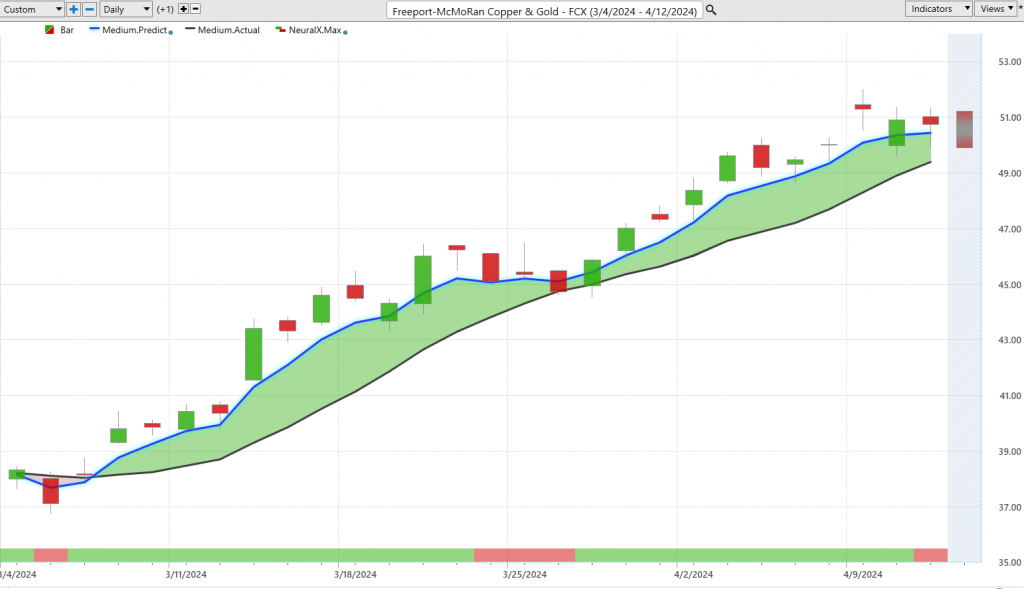
Now where we’re really seeing a lot of Freeport-McMoran Copper and Gold ($FCX) momentum pick up is in gold and energy prices and really just those raw materials here. So Freeport is another example of these predicted levels acting as really great opportunities to add to this trending position here, and more recently just over the past week, it’s interesting where you see on this trading day here, we can actually take a look at that predicted low level and what was the actual level hit on this next trading day here, you see the predicted low of 49.60, the actual low of the trading day was 49.59, and then we start to see gold prices advance once again here. So really nice opportunity, um and it’s a very similar case throughout a lot of the you know just mining companies here, here you see about a 28% rally over the past 24 trading days.
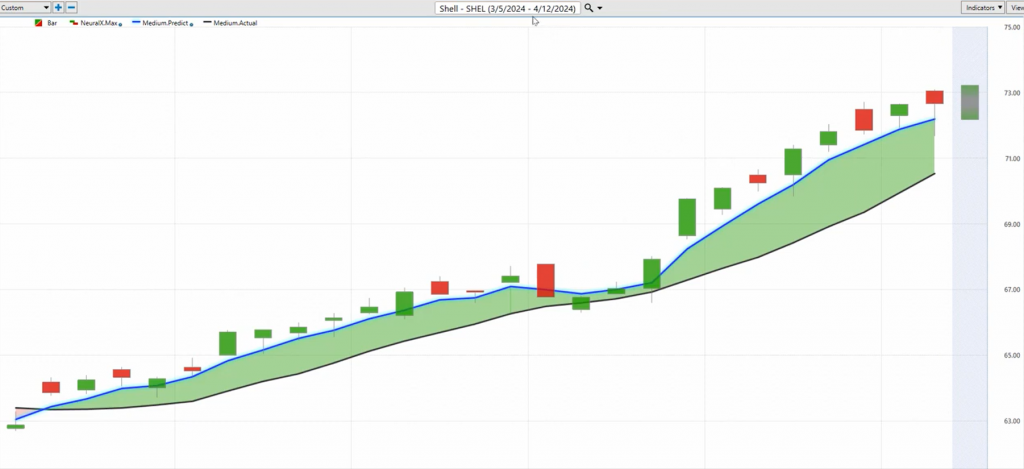
Lastly here, all the Shell ($SHEL) energy stocks right. So we looked at Exxon Mobil and this is where when you see that momentum picking up, this is where these short-term levels can be pretty advantageous if you want to accumulate a position throughout the space here in Shell, seeing from last week these predicted lows getting hit see a nice acceleration in the stock price, and again about a 4 and a half% acceleration to the upside rather than a decline like you see where these VantagePoint indicators are starting to skew to the bearish side.
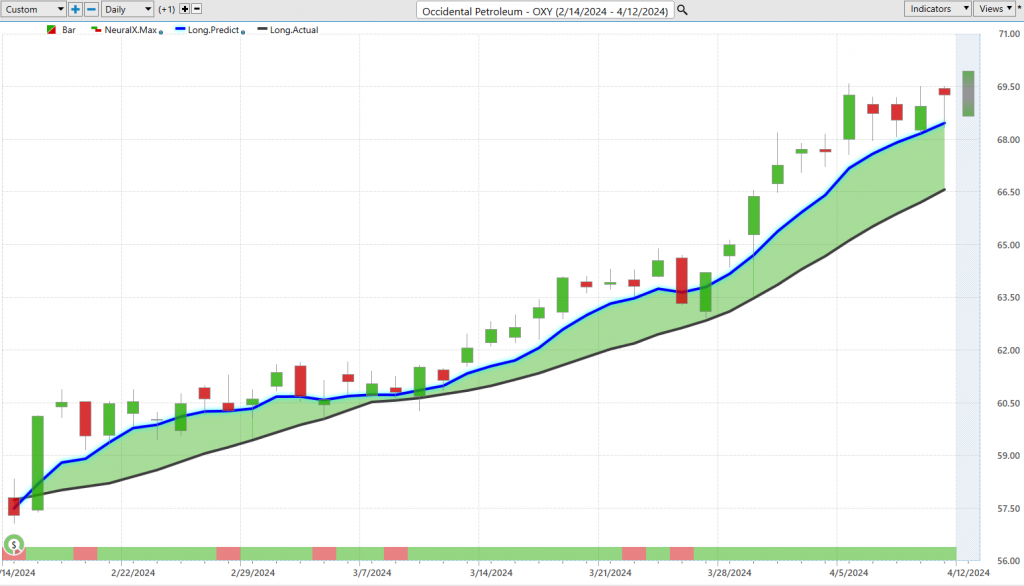
Lastly Occidental Petroleum ($OXY) here Occidental Petroleum again just highlighting these areas where you’re seeing the overall trend very much to the bullish side about a 133% rally and again more recently just seeing these predicted high and low ranges offer some really great levels to take those pieces out of the market and then potentially reestablish a position. So I’ll just go ahead and leave it there, not a lot has changed with those broader themes, and this is where it gets very straightforward to just say okay well where should that attention be in the portfolio, where are these VantagePoint predictive indicators getting the most bullish, and that can really guide you moving forward week to week as you add and remove things from your portfolio. Once again, this has been our Hot Stocks Outlook for April 12th, 2024. Thank you all for watching, best of luck, and bye for now.


