


The Hot Stocks Outlook uses VantagePoint’s market forecasts that are up to 87.4% accurate, demonstrating how traders can improve their timing and direction. In this week’s video, VantagePoint Software reviews forecasts for Alliant Energy($LNT), Duke Energy(DUK), American States Water(AWR), Lockheed-Martin(LMT) and Franco Nevada(FNV).
Register for a Free Live Training
Hello again, traders and welcome back to the Hot Stocks Outlook for April 16th, 2021. Hope y’all are having an excellent week out there in the financial markets and as always, plenty of opportunities to cover here today. So we’re going to be doing things a little bit differently today. Really going to look closely at the very short-term predictive tools like the Vantagepoint predicted high and low that you see at the very right-hand side of the chart. So we’re going to go through a few charts in many of these we’ve looked at over the past several weeks. You can see how these forecasts get updated as every single trading day and week go by.
So we’ve got Alliant Energy, American States Water and Duke Energy. These are all utilities. And what I just want to highlight here as we go through these examples is regardless of the markets you’re trading, they’re all going to have their unique nuances to them of how they’re going to trade and how they’re going to be reacting and responding day-to-day. And that’s where you can use these tools to identify an area where, okay, you’ve identified that this is where you might want to be long or short a particular market. But then having those tools that specifically for that market are going to look at those intermarket relationships and generate some very accurate predictions to help you manage those opportunities and really pull the most out of them.
So we’ll move on. We got Franco-Nevada. We talked quite a bit about the gold mining stocks starting to turn higher, that being another opportunity. And lastly, Lockheed Martin, which we looked at really about several weeks ago, maybe a month ago or so, but also an opportunity to the bullish side as well there. But you got to be careful out there. There’s a lot of warning signs that you really want to pick your spots. And this is where Vantagepoint is going to be extremely helpful to identify, well, which spots as far as sectors of the market and individual opportunities do you want to be focused on?
Alliant Energy($LNT)
So what we have here with Alliant Energy here is daily price action. So this is daily bars going all the way back we can see to the beginning of March. And what you have right up against those daily bars and candles is there’s a black line and also a blue line there. So the black line is a regular simple moving average. So a very common technical indicator just looks back at previous close prices, adds those all together and then divides by that number. And the problem with tools like that is that they’re completely lagging. They just look at what’s already occurred in the market, respond to the most recent closed price and act as a good measure of where market prices have already been.
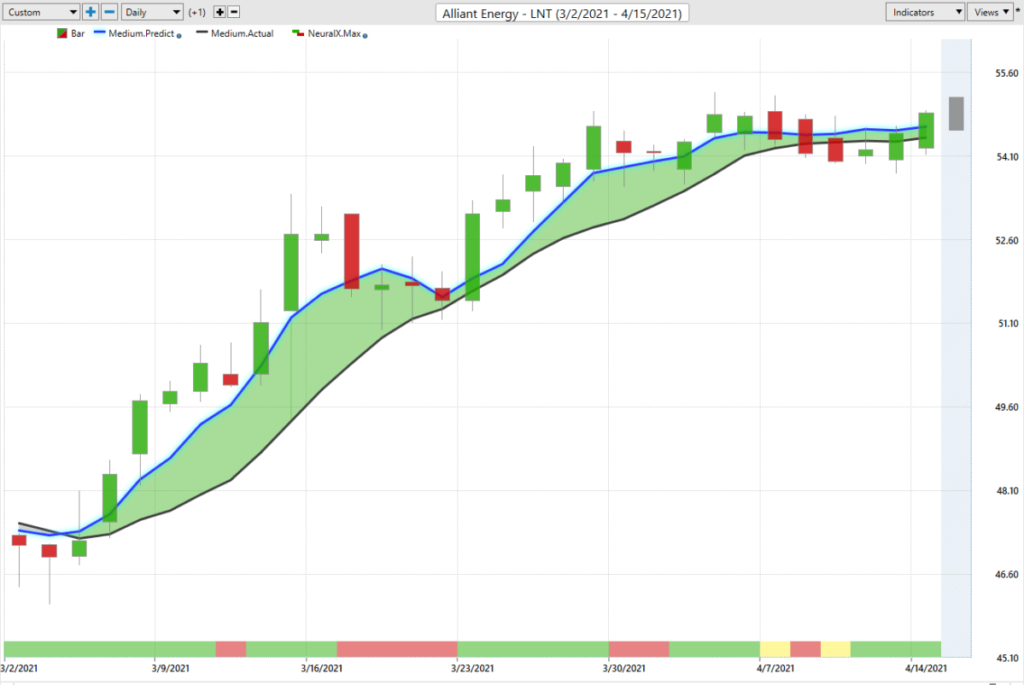
But of course, traders need to understand, “Well, where’s this market going moving forward so I can be ahead of any market movement?” So what we want to do to get that overall determination of trend direction is compare this black value on the chart so where prices have been to this blue value. And for that value to get calculated and then plotted against these charts, Vantagepoint is utilizing its technology of artificial neural networks to do what’s called intermarket analysis. So what that means is specifically for Alliant Energy, Vantagepoint has identified a very large number of what’s called intermarket. So markets that are known to drive an influence and affect the future price of this target market, Alliant Energy.
This can be effects over the short-term, longer-term, positive, inverse correlations. And that’s the benefit of a technology like artificial intelligence that can understand those market relationships, learn from them and then utilize that information to forecast true price predictions. So that’s what’s going on here is it’s using that intermarket data of what’s going on in the utilities ETF. What’s going on in potentially some of these other utility stocks. What’s going on in oil and commodity markets and currencies and it’s able to use that information to actually generate future price predictions. And it’s those price predictions that are used to actually calculate this value and give you a good forward-looking overall, essentially a forecast using these different predictive indicators that are tuned to look at different timeframes. So you can really tie them into your trading style, your timeframe and your approach.
We’ve seen here over the past several weeks highlighting that we get a lot of these crossovers to the upside in utilities. Also, the consumer non-cyclicals. A lot more conservative areas in the market and we see the S&P move higher, but the Russell go lower. A lot of mixed messaging out there. So you really want to find spots where there’s a very clear picture as far as overall trend direction. And very clearly we have that in these utility stocks. But what I just want to highlight is how you can use the shorter-term forecast like the Vantagepoint Neural Index that you see at the bottom here and the predicted highs and lows.
So that once you identify that, “Okay, this may be an area where I want to be long or short or whatever it might be.” Then you get really the benefit of these tools adjusting and adapting each and every trading day to help you make the most of that opportunity. So what we can do is say, “Okay, well, first thing we need to understand is this Neural Index at the bottom.” This changes from green to red, back to green. And again, at the very right-hand side of the chart, this is what’s getting updated every single trading day. And it’s forecasted to look ahead just 48 hours. So you can think of that as two trading candles, but short-term strength or weakness in the market.
I like to think of it as just understanding that there’s going to be some higher highs or lower lows over that next 48-hour period, but keep the overall thesis of why you’re in that market or trend intact and keep trading there. So here with Alliant Energy, we get this crossover to the upside, Neural Index bullish, and you’ll get these periods where this Neural Index is extremely accurate, but you will get a day here or there where it’s off. You see the overall trend, very bullish here. Neural Index is bearish here, but we actually don’t get any weakness and the market moves higher.
But what you can see is that it’s absolutely correct, pretty much nine out of 10 times as far as that short-term strength or weakness and we can combine that with trend and our predicted high and low ranges again to help us out. You see Neural Index gets bearish here. We get a little bit of sideways price action. Again, lower lows over those subsequent 48-hour periods. But that blue line is still overall above the black line, the overall trend intact. Again, you see lower lows from that Neural Index, lower lows, but the overall trend is still to the upside.
So what we can do now is look at those predicted high and low values here. And this is the roadmap that you’re getting so that when you identify back here that, “Okay, something’s going on in utilities. Here’s an area where I might want to trade.” You see that every day you get this predicted high and low range before the trading day occurs. So what you’re seeing here is the actual prediction beforehand against the actual trading day that occurred. And so when you come back and understand that, “Okay, well, I know I want to be a buyer. Where do I want to go ahead and get involved to get a good intraday price level?” If that’s the timeframe that you’re working on.
And you see you get these levels that can come in and say, “Okay, well, if you want to be adding to the position, if you want to be getting involved, maybe start the trend down here and you can just put a position on and make sure that you have the position on,” but then understanding that, “Hey, maybe I should take some profit here, buy back the market here. Take some profit as the market moves higher, buy back at these lower levels.” And you can add to your position and get a little heavier as that pull back comes in. So as the trend continues, you make more money with that overall opportunity there.
So there we see Alliant Energy and we see what here? One, two, three, four, five, six, seven, eight, nine, 10, about 10 opportunities, nine or 10 entries over just the past month here as this market has moved higher. And it’s not the most exciting market here as far as a utility stock, but when you have those short-term levels that are going to help you, it’s going to be easier to come in and take a little day trade. Maybe take a few percent out of the market over a day or two. So you see about 15% rally.
American States Water(AWR)
Well, let’s take the same approach and here we have American States Water.
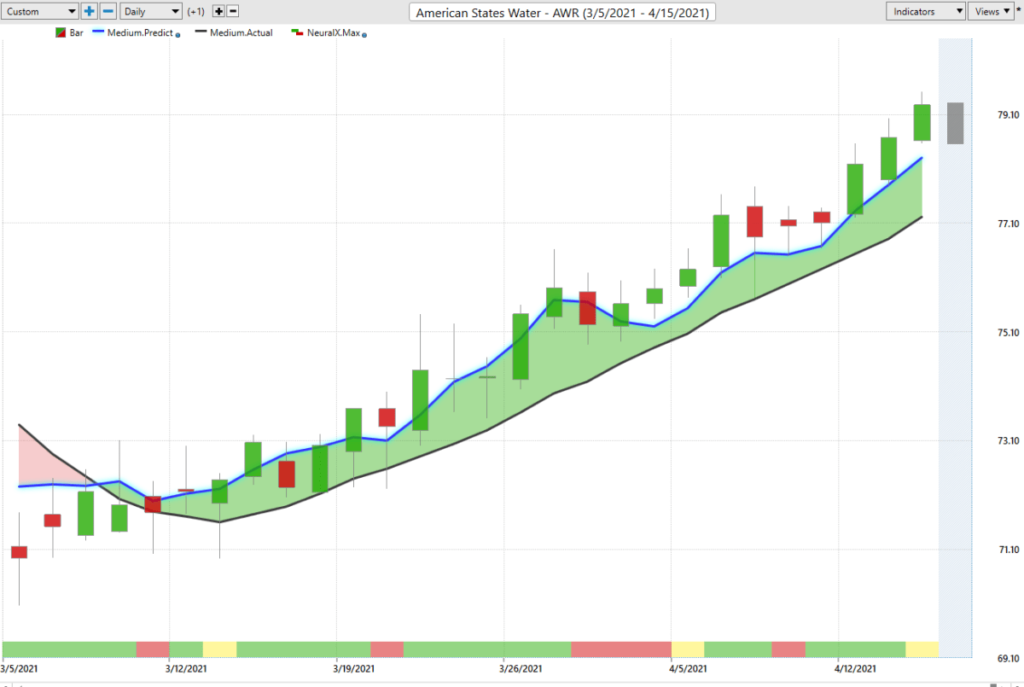
So again, a blue line over black line, we know utilities is an area of the market with some strength and we’ve got this roadmap, that’s going to say, “Okay, well, Neural Index will let us know potentially when there’s some weakness over these 48-hour periods, but the predicted high and low is going to be the main thing to help us as far as these intraday trading ranges.” Because we understand clearly the trend is up. We want to get the best price possible. And again, we can say, “Okay, well, if we’re not trading in this case, Alliant Energy, now we’re in a different stock.”
And this is the key is that every market has this unique pair of intermarket relationships that it’s using to make that unique price prediction. So where this really helps out is when volatility comes into the market and things start moving around, Vantagepoint is able to look at those market relationships and really recalibrate so that you have this tool that’s really adapting and shifting with what is really going on out there in the market. So if the trend is still to the upside, great. You can still be a buyer and still utilizing your predicted lows and predicted highs respectively to do the type of trading that you want to do.
But if that blue line crosses below the black line, you understand that the environment has shifted and you therefore need to stop that behavior of maybe adding to a position in an area of the market like utilities or wherever it might happen to be here. So again, you see one, two, three, four, five, six, seven entries into that market. A lot of those very early, but really great opportunities here as the market’s moved up about 10%. And what I really like to do as a trader is if I’ve added to my position here and the trends worked in my favor and it still looks strong, we can use those to add to your position as it continues and really accelerate how much money you can make out of that particular trade there.
Duke Energy(DUK)
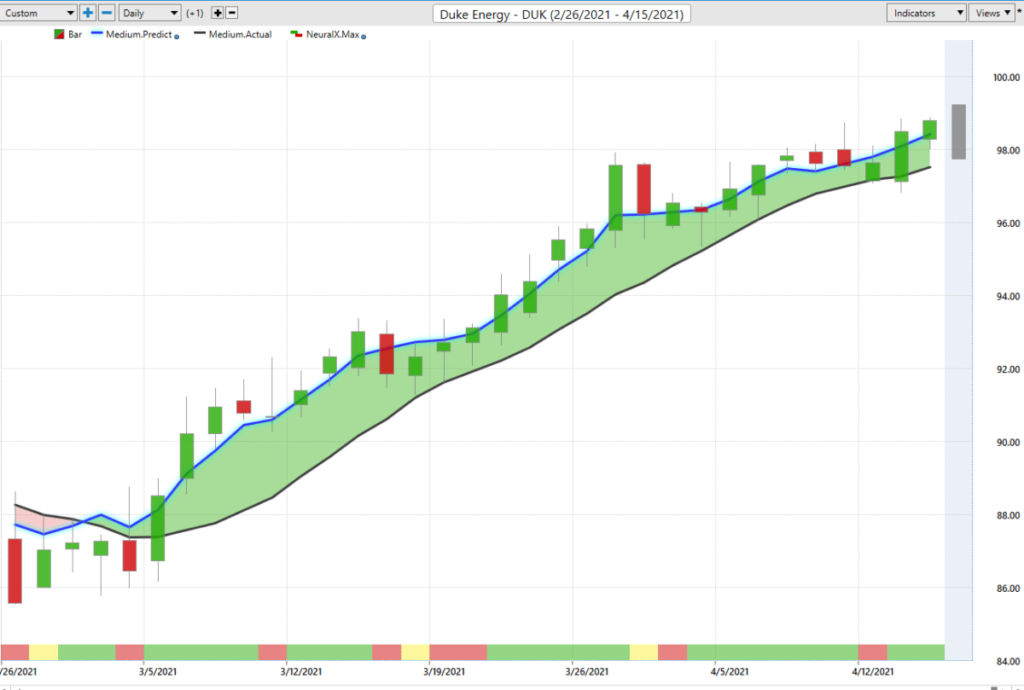
And here’s Duke Energy. So again, a completely different individual market, maybe a place where you identify some strengths, but then you can come in again with those unique levels for this particular market as far as the predicted lows. And every single market’s going to be a little bit different, which is why you need those tools that look specifically to not just utility as a whole, but Duke Energy. Where are those other sort of market relationships that make this market maybe want to trade down towards these predicted lows over a 24 or 48-hour period and potentially have implications for when the overall trend shifts? So affecting that blue line crossing below the black line when that time comes to get away from that particular trade.
So here we have about a 13%, very similar moves, but different forecasts for each to help you really get the best of each one of those different opportunities.
Franco Nevada(FNV)
Here’s Franco-Nevada and another just continuing on with this approach of clearly over the past several weeks identifying areas of the market to trade. Now that you’ve identified those areas of the market to trade, use the respective Vantagepoint tools. So your predicted highs and lows, your Neural Index, all those tools here. Franco-Nevada and the gold mining stocks have been for several weeks now in a very bullish sort of mode here. So you see here potentially an opportunity here, you get filled on the gap there and in the market immediately trading higher.
But the last week here, you see again, gap down. Well, exactly where you want to have a limit order waiting. And you see that if you’re going for a day trader or anything, that’s just probably within an hour or two taking that range out of the market and moving on. But then again, these predicted low levels coming in and saying, “Expect the market to trade down here.” But the overall trend is up and very clearly all we’d want to be doing is going long, taking profits on longs and that’s about it.
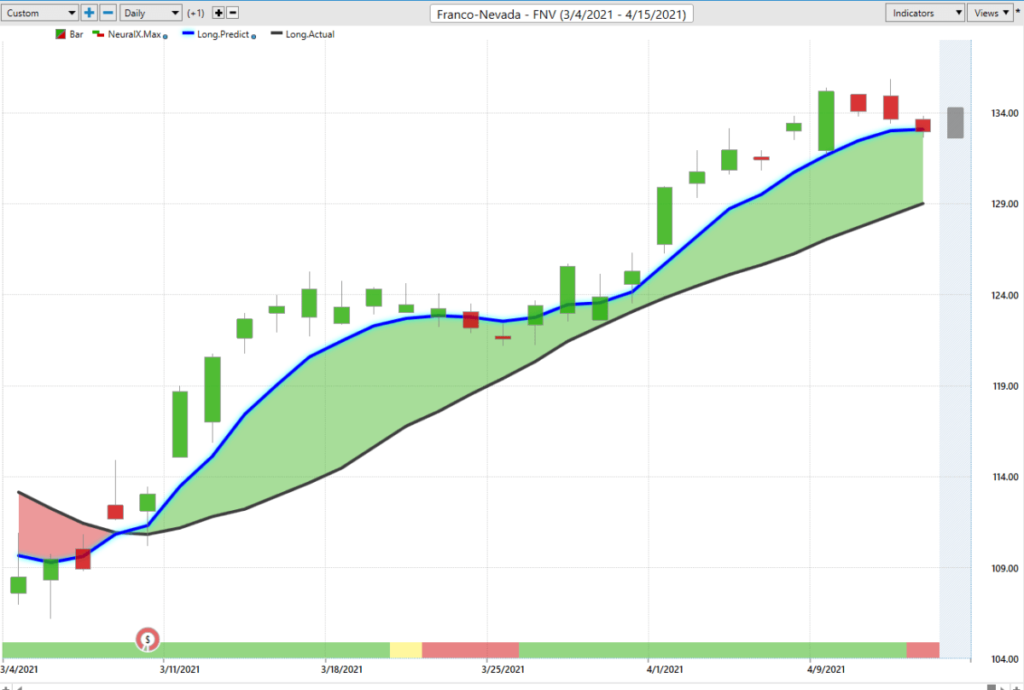
So I know gold today is starting to pop higher, but that’s something that we’ve identified for a while. And it’s helpful to think about these things when you think about a stock like Franco-Nevada, where you think of like Amazon or Microsoft and these other stocks and it’s hard to think of those intermarket relationships because they’re subtle and they’re happening in the ETFs, they’re happening in the individual stocks. When you trade something like a gold mining stock, it’s very easy to understand that, hey, gold, the commodity has implications here. The U.S. Dollar Index , the junior gold miner ETFs, and all those have an effect on how the future price of, in this case Franco-Nevada is likely to trade, but they’re going to have different effects as far as those predicted highs and lows and where this market’s likely to move.
Again, very short-term here. Has market up about 8%. Really got these clues several weeks ago and these markets are up about 20, 30% now as far as those bottoms setting in.
Lockheed-Martin(LMT)
Here’s Lockheed Martin and exact same approach is just identifying these areas of strength with overall trend. And then coming in with the help of the shorter-term predictive tools like the Neural Index, again, to help you with just that short-term strength or weakness in the market, and really those predicted highs and lows to help you add to the position and understand that if you want to be long in the market and you’re at an intraday predicted low, well, that’s a great place to potentially be maybe a little heavier on a position here.
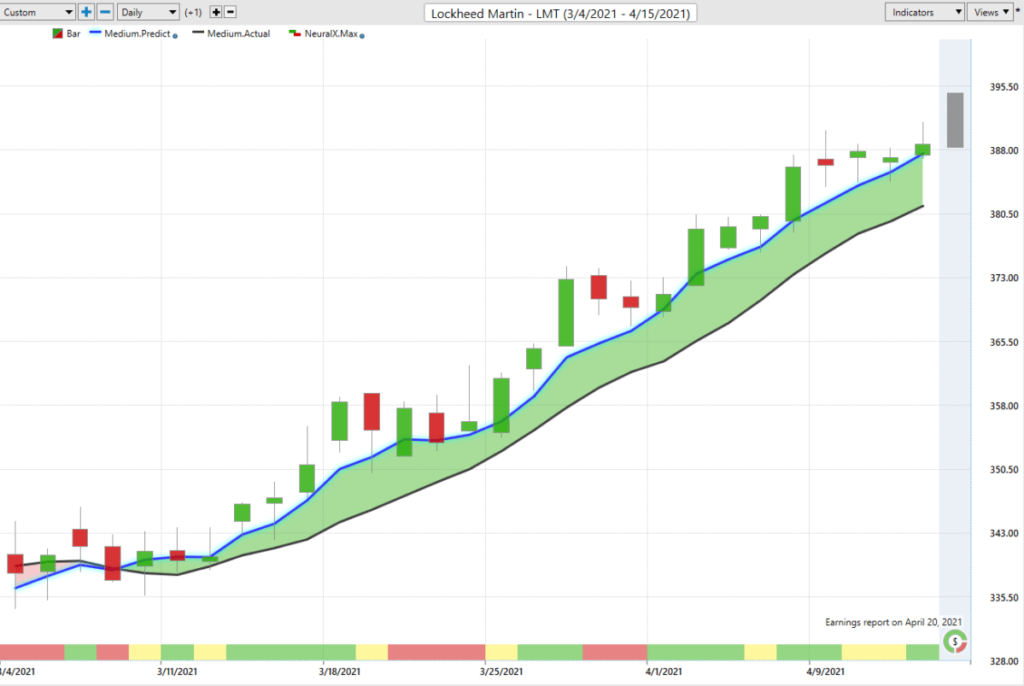
So again, we see this crossover coming through and just every few days getting a nice predicted low hit here at the lower part of the range before the next leg up in this trend. So one, two, three, four, five, six, seven and you see just this past week, a few more opportunities here, buying down here, hitting these predicted highs here. That overall trend still bullish there. So again, not going over some crazy sort of concept here. Just sort of continuing on with the Hot Stocks Outlooks over the past several weeks. And what happens is when you identify markets that are trending, well, there’s no reason to look for some new big shift or change in the market. You understand the overall trend. You’ve got these forecasts to help you like in some of these utilities and you just keep managing that trade. Maybe trade shorter-term or add to a position and do things like that.
But overall, keeping it quite simple and saying, “Look, just utilize the forecast, identify where you want to be long, where you want to be short, what sectors,” and then let Vantagepoint guide you for better or for worse. If you’re going to get involved, then the market’s going to trend great. Maybe it’ll trend for a while and tell you to get out of it and short the market later on.
So that’s where these tools really become effective and especially in things like, again, the gold mining stocks doing a great job of leveraging those intermarket relationships, leveraging the technology and getting you ahead of a lot of these important shifts that are happening in the marketplace. So once again, this has been our Hot Stocks Outlook for April 16th, 2021. Thank you all for watching. Best of luck out there and bye for now.

