Hot Stocks Outlook for the Week of
April 17, 2020
The Hot Stocks Outlook uses VantagePoint’s market forecasts that are up to 87.4% accurate, demonstrating how traders can improve their timing and direction. In this week’s video, VantagePoint Software reviews forecasts for Netflix(NFLX), Alexion Pharmaceuticals (ALXN), Electronic Arts (EA), Alexion Pharmaceuticals (ALXN) and Costco Wholesale (COST)
Register for a Free Live Training
This Week’s Hot Stocks Outlook
Hello again traders, and welcome back to the Hot Stocks Outlook for April 17th, 2020. Hope y’all are having an excellent week out in the financial markets, and as always, plenty to cover in this week’s outlook. So we’ve got a lot of great companies to take a look at. We’re going to go ahead start out with shares of Netflix. We’ve also got Alexion Pharmaceutical, EA, so Electronic Arts, Papa John’s, and lastly Costco Wholesale. So first thing though, let’s take a look at Netflix here, and what we have is daily price action here, so each one of these candles represents a full and complete trading day of shares of Netflix.
Netflix (NFLX)
We see this is going back about a month’s time, and right up against those daily candles, you have a black line and also a blue line. Now very important to understand that the black line that you see against the chart, that is a simple moving average. So very common technical indicator, we refer to it as the actual simple moving average, and indicators like that really only have the ability to look back over previous price action.
So if you wanted a 10 day simple moving average, you would just take the last 10 close prices, add them together, divide by 10, and you get that rolling number. Now the problem with a tool like that is that it’s only looking at past price data. So it’s reflexively going to just adjust based on the most recent price action and it gives you no predictive capacity to know where a price is moving forward.
And so what we want to compare that black line to, or that measure of where prices have been, is compare that to this blue value that you see against the chart. And for this number, this value to be calculated, VantagePoint is performing what’s called intermarket analysis and utilizing the technology of artificial neural networks, so artificial intelligence to actually forecast future prices.
So rather than looking at just past prices of Netflix, those neural networks are able to identify important market relationships that are known to drive and influence shares of Netflix, because we know markets share very important relationships. And so rather than just looking at Netflix, it’s going to look at other individual stocks, other tech stocks, most likely. It’s also going to look at things like ETFs that model big chunks of the overall market. It’s going to look at things like the global indices like the S&P 500. It’s going to look at global currencies, global commodity markets, also global interest rates. And so what it’s able to do is look at these important relationships between those markets and how they’re known to influence and drive, in this case the target market Netflix, and it uses that information to actually generate predictions. You can think of that predicted price that hasn’t yet occurred, and it’s using that data and actually incorporating it into creating this value, turning what was a lagging indicator that only reacts to past prices, to a forward looking predictive tool that is making predictions on where the market is likely to move going forward. So what this is is our predicted moving average, and whenever you have a situation where this blue line crosses above the black line, it’s suggesting that average prices are going to start moving higher relative to where they’ve been. Essentially, that the trend is now to the upside. So as long as that blue line remains above the black line, suggesting prices are expected to move higher. Now in addition to that indicator though, you’ll see at the very bottom of the chart you have this indicator that goes from green to red back to green, and this updates towards the right-hand side of the chart every single trading day, but what this indicator is doing is also utilizing that artificial intelligence to generate predictions, so that looking forward and price that hasn’t yet occurred, but it’s very short-term.
It’s only 48 hours as far as the prediction that it’s making, so it’s looking about two candles ahead, and it’s also short-term strength or weakness. So how I like to look at this is if you can set a directional bias to the market, and the Neural Index for instance, is bearish, it’s letting you know lower lows are going to set in over the next couple of days. Very valuable information for a trader to know, “Hey, well should I be holding onto this overall trend, or even looking for cheaper prices?”
Now to really round out the entirety of this predictive forecast, again, that artificial intelligence is used to generate predicted highs and predicted lows, so actually a predicted range for the next trading day, and that can be used to set limit orders, profit targets. Again, incorporating that into a shorter-term approach or management style for your overall trade, and we can actually see how effective all of these predictions were against the actual market data. So you see we have a shadow candle here with those predictions, well that’s going to fill in with the actual market data for today, and we’ll see exactly how accurate that forecast was. Well, we can look back and say, “Okay, well if we would’ve said, ‘Okay, well we want to trade shares of Netflix over the past month,'” well, this black line that you see that is the predicted low value is giving us a guide of, where should we be looking to accept prices on this daily level here? So how we can think of this is if you got this 48 hour tool that’s going to let you know short-term strength or weakness over the next 48 hours, you’ve got this predicted high and low, and you’ve got that overall trend direction, it makes it very easy to manage your overall position and say, “Okay, well here’s my game plan, here’s what I want to go ahead and do,” and make sure that you’re able to deal with the current volatility and sticking with that market.
But you see here that in shares of Netflix, this market, since these initial predicted lows has moved up over 20% within 48 hours, the market is higher from your entry, but more importantly is how these levels are adjusting each and every trading day. So you see you’re hitting these predicted lows, constantly moving up to the predicted highs or surpassing them because you’re in an uptrend. But we have one, two, three, four, five, six, seven opportunities to get long Netflix at the very bottom of that shorter-term range. So not only capturing that possible 20% on the overall move, but excellent areas to add to your position, and of course we want to understand as traders, when that market made a big move lower in February, where can we go ahead and get involved in the market but at a lower risk, really control how much risk we have to take to take those shots to the upside? And you see some fantastic recoveries, Netflix up over 20%.
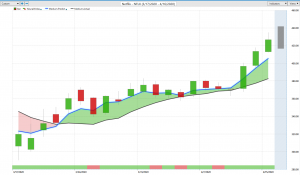
Alexion Pharmaceuticals (ALXN)
Same exact approach, whether you’re trading shares of Netflix or options market or however you want to approach the instrument that you want to use, or if you’re trading pharmaceutical stock. So here’s Alexion Pharmaceuticals and it’s the exact same thing, and one of the real great benefits of VantagePoint is that you can run some scans to actually identify if the market is shifting to an uptrend or a downtrend and actually point out these fresh crossovers. And so when you see over this period of time back at really the end of March, all of these markets starting to move to the upside and essentially forecasting that prices are going to start moving higher as long as they remain that way, let’s use these VantagePoint predictive tools to take positions on the market. And again, doing it from that lower risk perspective where you can get that long position, really get a nice asymmetry as far as this market so far has moved up, let’s see how much over this … 18% just over the past 15 trading days.
But also understanding, look, that if things start to verse to the downside, you’re going to get that updated forecast as well. And these tools are going to let you know, not only expect that weakness, but hey, the crossover has moved to the downside. The trend is now down. But if you don’t see that, you really understand what you should be doing. Look, the trend is up, you may get that short-term weakness. And a really helpful tool of of how I like to look at the Predicted Neural Index, that indicator at the bottom of your chart here, is just simply understanding that, look, if this is telling you weakness over the next 48 hours, you should really expect the market to trade below the predicted moving average. We have a predicted moving average, we can trade above or below that average level, but it’s a good forward looking tool.
So not only are you getting a lot of separation between that prediction and the actual moving average suggesting the trend is strong, but letting you know, “Hey, there may be some weakness over the next couple days,” you see the market runs sideways, and then presents those really nice opportunities to actually get involved in the market and buy at these predicted low levels. Again, really nice entry towards the bottom of that shorter-term range to get involved.
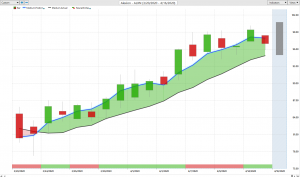
Electronic Arts (EA)
Here’s Electronic Arts again, 3/24, you see a lot of the market very correlated and you can understand when there’s a big shift coming in things like those broader indices like the S&P 500, but Electronic Arts getting this crossover back on 3/24, and what I want to point out here is markets are volatile. And we’ve got to understand is if we want to get a trade in, get a larger position size, we need to know where we should set our stop losses, where should we expect the market to trade?
And you see this big range of the market gapping up, trading lower, moving immediately higher. Well this blue line crossed above the black line on 3/24 and it remained that way. And so if you’re saying, “Okay, well where do I want to get involved in this market?” Well, use your predicted highs and lows. Use these levels to say, “Okay, well the market can very easily trade inside of these ranges, but the blue line is above the black line. I want to go ahead and be long.”
And again, you see multiple opportunities. So it’s not just about that crossover and getting into the market early, but how the software adapts. So it takes in all of that information day after day after day from those intermarket relationships and it’s updating these predicted highs and lows. It’s updating your Predicted Neural Index so that you can be very well prepared with an extremely high level of accuracy from things like the Neural Index on what should you be expecting in that market, and how’s it going to affect your trading style and your overall approach?
So again, Electronic Arts, we can take a look at the overall move here, but a nice move. Many of these markets moving up on average 20% or so since these crossovers moved to the upside, you see 23% move from Electronic Arts. You got 500 shares there, buy some option contracts, however you want to approach it, but you’ve got about a $10 thousand move there in just the past 15 trading days. So really significant move. That’s just three weeks of time.
Papa John’s (PZZA)
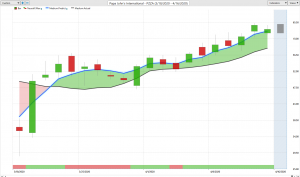
Here’s Papa John’s International. 3/23, so what you’re seeing by running this scan, so running this predictive technology on the broader markets, is that back in 3/23 is when the market started to shift, and therefore where you’re going to get that nice asymmetry. Much more to gain relative to how much you have to risk to get involved. But again, what we really need to appreciate here is the predictive and adaptive capacity here.
So looking at the separation between that predicted moving average and the actual suggesting, “Look, this trend is up,” but you see that conflict immediately here saying, “Look, there’s weakness over the next 48 hours.” Again, expect the market to trade below the predicted moving average, but you get that guidance as well from those predicted highs and lows. And with all that volatility, look how these levels perform. Excellent entries all the way down at these lower levels.
So getting just excellent entries on an interday basis to get involved in the market and not getting anywhere close to saying, “Okay, well this market’s still in an uptrend.” You’re not anywhere close to this blue line or predicted value being below the actual moving average, and that suggests average prices are still expected to be higher relative to where they’ve been from that predicted or from that actual moving average.
So we can see here from this crossover coming through, market up about 22%, but there were even entries at these predicted lows down on these trading days here, up over 30% from those levels.
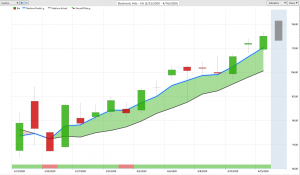
Costco Wholesale (COST)
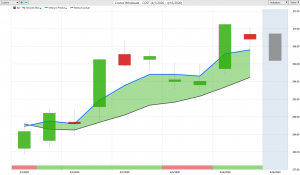
Lastly here, shares of Costco, and you see here just this past couple of weeks getting this crossover to the upside, signaling potential new opportunity here in shares of Costco. Get ready to buy down at 286 or so, but you get that guidance the next trading day that says, “All right, well you’ve got a predicted range. You understand the range of possibilities, where you should go ahead and take those entries and look for a trend reversal,” and you see that you get that series of higher highs and higher lows. You’ll see this at times where at the heart of these VantagePoint forecasts, the Neural Index is a 48 hour tool, you get these predicted highs and lows. You see this sometimes where you see you went straight up to that predicted high, the very next day you go straight down to the predicted low, but the trend is still in place and you see how quickly things adapt and get things back on board as far as those updated predictions, so that you can manage that opportunity extremely effectively.
So really nice opportunity in shares of Costco, the broader market is really in a lockstep trade here. We had everything turn lower in February. Well, things have reversed recently and it’s opened up some opportunity to the upside where very easily you can get some entries, trail your stops, and have some really nice opportunities upwards of 20%. Here you see shares of Costco up 8% just in the past two weeks or nine trading days.
So once again though, this has been our Hot Stocks Outlook for April 17th, 2020. Best of luck to the traders out there in the market. Thank you all for watching, and bye for now.