


Register for a Free Live Training
The Hot Stocks Outlook uses VantagePoint’s market forecasts that are up to 87.4% accurate, demonstrating how traders can improve their timing and direction. In this week’s video, VantagePoint Software reviews forecasts for SPDR SPY($SPY), Freeport-McMoran($FCX), Phillips66 ($PSX), Trip Advisor($TRIP), Raytheon Technologies($RTX), Salesforce ($CRM), Nike ($NKE), Nucor ($NUE)
SPDR SPY ETF ($SPY)
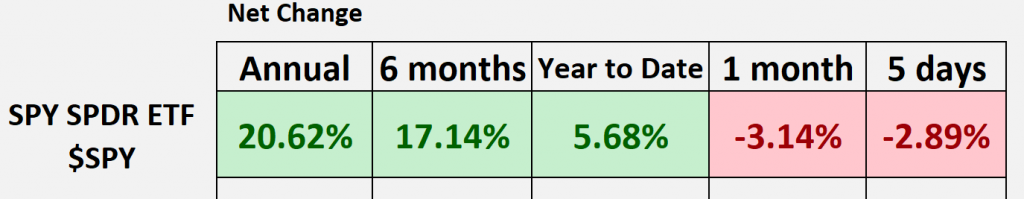
Hello again, traders, and welcome back to the Hot Stocks Outlook for April 19th, 2024. Hope you all are having an excellent week out there in the financial markets. As always, we’ve got plenty to cover in this week’s Hot Stocks Outlook. So, if you haven’t already, make sure you go ahead and click on that link in the description below, sign up, and get a live demonstration to learn all the specifics about how this predictive technology can help you make better trading decisions in the marketplace. Now, we’ll go ahead and start out with the SPDR ETF SPY ($SPY) chart here, but as we typically do, we can look back at some of those bigger blocks of time here.
So, what we’ve been highlighting over the past couple of weeks is that, especially in that consumer cyclical space, you’re starting to see some weakness. That’s why we look at that TripAdvisor stock, and really identifying, okay, well, where can we hedge the portfolio, get short, and make money as we see overall weakness in shares? So, we’re still up about five, almost 6%, year-to-date. But, we want to be in the here and now and recognizing these important shifts in the marketplace. And that’s actually why this session is a good opportunity to highlight how Vantage Point can get you ahead of those turns in the market.
So, here what we have with SPY, of course, is those daily price action bars, right? And so, right up against that price data, we have our predicted moving average, our predicted neural index at the bottom, and the predicted high and low range. So, we’ll go into detail about how all of those work in these subsequent forecasts. But just to highlight, okay, what are we seeing on the SPY even going into last week? Well, this is actually last Friday. And so, we can see that that distance between the predicted moving average, we’ve got that neural index bearish, and we see those predicted high and low ranges acting as guidance for traders to potentially get short positions on, right? So, we really identified that there’s weakness broadly across the stock market, but even from last Thursday here, actually Monday of this week, highlighting again good opportunities to get short and take profits on the short side, seeing these predicted lows.
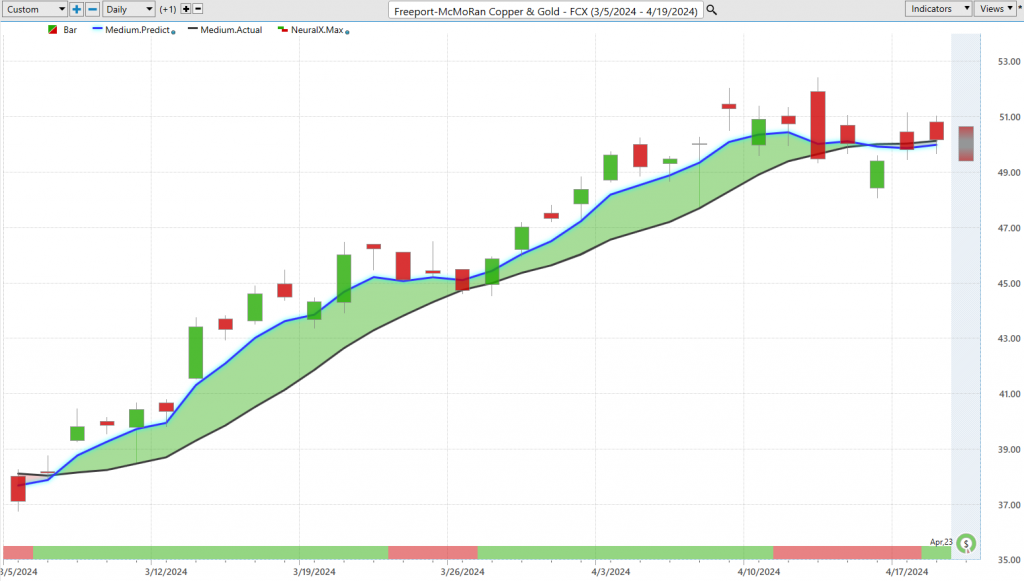
But let’s go into some detail about how all of this works together. And I thought that this Freeport-McMoRan Copper and Gold ($FCX) opportunity on FCX would be a good example because we brought this in week to week as we’ve seen those rallies in the gold market. So, what we have here with FCX again is that daily price action, and these being daily bars, and right up against that price data, what you’ll notice is there is a black line and a blue line value. So, the black line value that you see there, well, that’s a simple moving average, so that’s a very common technical indicator. In this case, it’s a 10 period simple moving average, so it’s just going to take the last 10 close prices, add them all together, and then divide by 10, and that’s a good measure to let us know where market prices have been.
So, we can actually think of that as a baseline, letting us know again where market prices have already been, but traders need to be ahead of that next shift in the marketplace. And so, what we want to do is compare that to this proprietary predicted moving average. And for that number, essentially a price prediction gets calculated and plotted on the chart. Well, this is where the technology of artificial neural networks come in, and they’re doing what we would call intermarket analysis.
Now, I stick to this chart because when we think about intermarket analysis, well, what does that mean? Well, that means that we understand that there’s known market driving relationships in other markets. Now, that can be things like ETF groups like The Gold Miner ETF, that could be in other individual stocks. But in something like this, it gets pretty obvious, well, what’s going on in the gold market, right? Or the copper market, right? These are going to be very important markets that have an impact on the price of a stock like this. And so, it’s able to look at those commodity markets, also the price of certain currencies, global interest rates, and so, taking this global approach, looking at dozens of markets specific to the market in question that you’re trading. And so, it then takes that information and then plots that on the chart. And so, whenever we see this blue line cross above the black line, well, it’s suggesting average prices are going to start moving higher. So, it uses that predictive data to, in a sense, skew the indicators to the direction that the market should move, whether that be bullish or bearish. And you see that we just recently got this blue line crossing below the black line, that coming in what would have been Tuesday, the day of this week, and it gives you an opportunity to take some profit.
But not after a 26% rally. So, you see here, even just a couple hundred shares—that’s over $22,000 move to the upside—and you get that exposure to, again, the gold and copper markets that have done very, very well. Here now, at the very bottom of the chart, this is where we have our Vantage Point predicted neural index, and this is tuned to solve short-term trading problems, like, is there strength or weakness just over the next 48-hour period? Or what you can think of as really two candles. And so, you see, it does an excellent job in these periods of warning of that short-term weakness. Then, traders can adapt accordingly, whether that means getting out of the market, getting lower prices, or waiting again for that bigger, you know, trend shift to happen here. So, really nice example here, and this is one of these stocks that we brought through week after week, highlighting that, okay, well, we’re seeing certain areas of the market do very well, especially gold, energy prices, um, but elsewhere, you want to be a lot more careful.
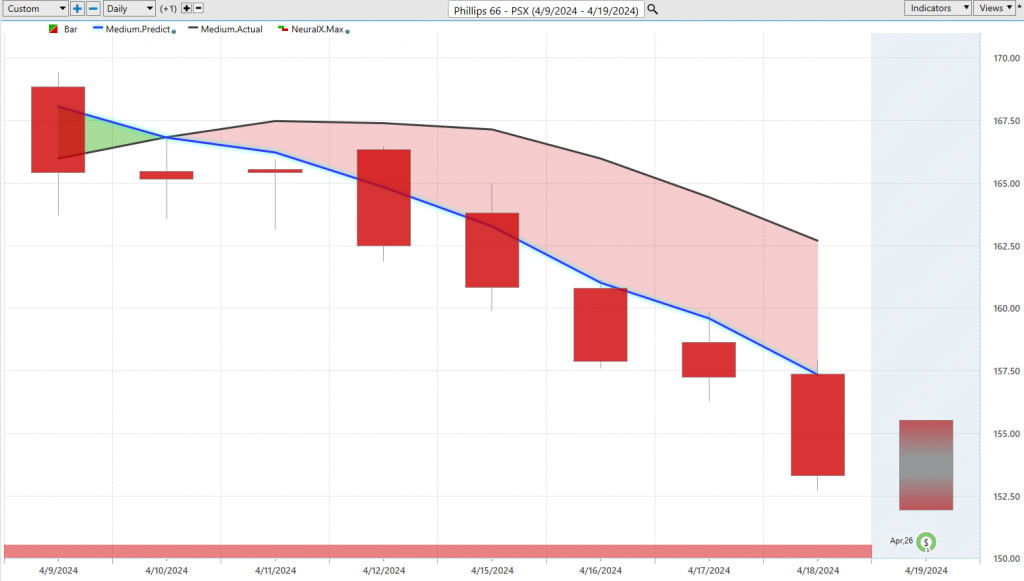
Now, here’s Phillips 66 ($PSX), more on the energy side, and we saw again a lot of these important shifts spread out throughout the energy space. So here, in PSX stocks, you see that predicted moving average crossing below the actual moving average, and look at that 48-hour forecast here from a large energy stock, right? So, if you wanted to, again, have those bullish energy bets, and you want to hedge that, or equal things out, you know, the easiest thing to do is just take profit on those bullish bets like in FCX. But here, we start to see more of the market shifting lower, and so we can look at those Vantage Point predicted levels, things like those predicted highs and lows, and this is how traders are going to be able to utilize these tools, saying, okay, well, if I want to get short, you want to do that from up here and look to take profits as you get those declines just in the broader market, um, but also in, again, even some of these energy areas that have done quite well here.
So, uh, again, just a really quick, simple example of how you can identify that, you know, we had again these markets doing really well, we’re seeing some of that shift, and if you can get ahead of that, well, you can just take your profits or get involved in a new trading opportunity.
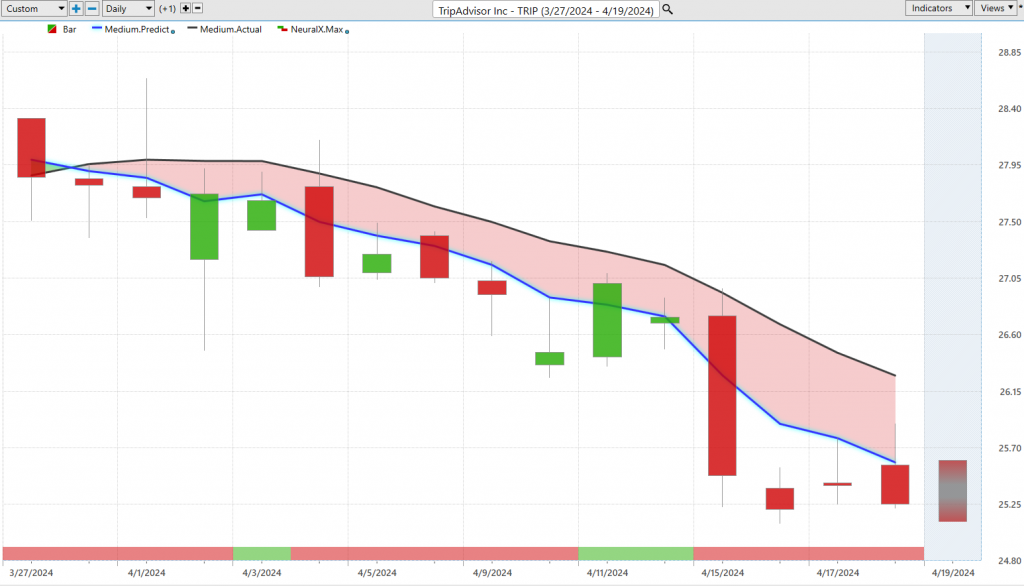
So, uh, here Trip Advisor ($TRIP), more correlated to that broader market, S&P 500, and so you see here that we started to get a lot of these clues here with the predicted moving average getting bearish, really going all the way back before we got into the month. And so this is one of these things where you can highlight those spots that are, if we’re going to get weakness out of the S&P, well, where are we likely to get the most weakness? And that’s where these Vantage Point predicted levels are going to again keep skewing bearish. In this case, we got a really nice move from these Vantage Point predicted highs that came through. You’ve already gotten about a nine, almost 10% decline just over the past 14 trading days. And then again, we can look at those predicted highs and lows. And so this is where it really gets exciting when you’re getting really great entries into the market, and then you can often just trail stops, right? So, if you’re able to get a really nice entry, take some profit along the way but just keep that bearish exposure in as the overall trend continues, and we, you know, continue to move lower here. So, you see, even recently, this week, uh, hitting some of these predicted high levels and trading lower once again. So, really nice decline here in Trip Advisor.
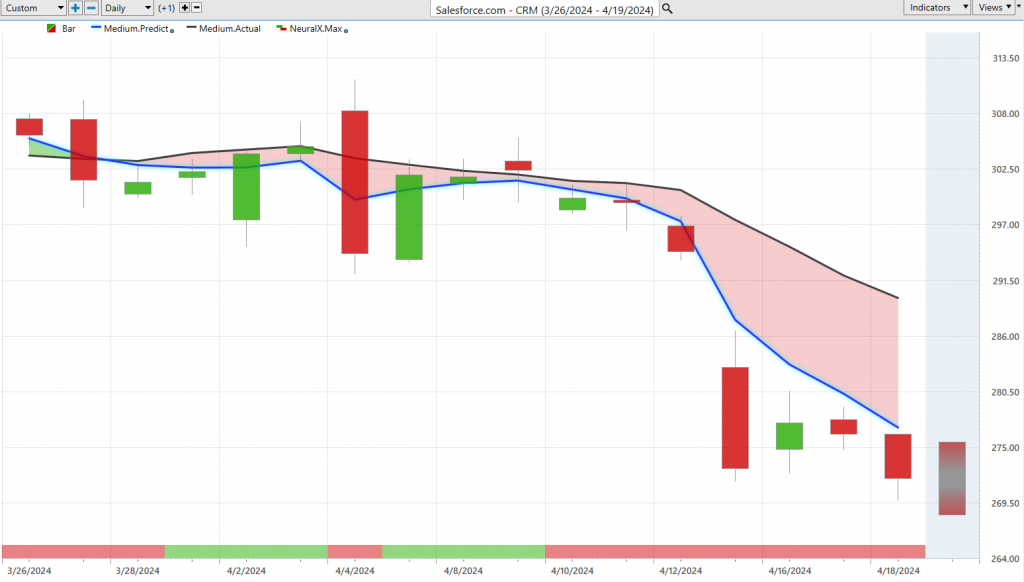
Uh, very similar situation here in Salesforce ($CRM). So you want to be, you know, careful again on where are you identifying opportunities on the bullish side. Well, obviously, here in Salesforce, you get that predicted moving average crossing bearish, and here you see this conflict, right, where the neural index gets bullish for these long periods of time, but you keep getting that skewing of the predicted moving average, letting you know, look, the overall trend is down. You may get these little bounces over these 48-hour periods, but those would better be used to actually set short positions, right? Or maybe buy some put options, uh, when we get up to these Vantage Point predicted high levels, and then again eventually move down. And then we see all that momentum pick up, uh, as we see again, more and more of the market turn, right? So, we can identify these areas of weakness, whether it’s in Trip Advisor, Salesforce, the S&P, uh, get some of that bearish exposure but also see that that’s starting to bring down again, even some of these other stocks that had done, uh, quite well.
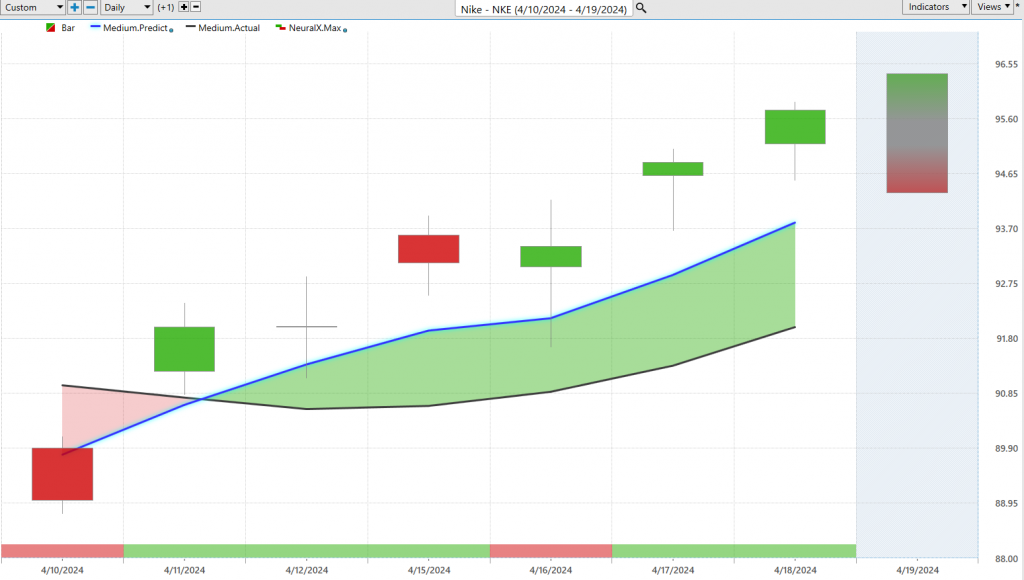
More recently here in shares of Nike ($NKE). Now, there’s not that many bullish opportunities, but here’s a good example of how the short-term forecasts work. We see a strong crossover from that predicted moving average, neural index bullish goes to bearish, back to bullish, but look at these predicted high and low levels. So if you’re getting involved in the market, you’re doing it at very good price levels, and again, getting those nice entries, again, whether it’s on the bullish or the bearish side, you don’t really have to risk a whole lot for a long period of time to get that exposure. Uh, so here, you see Nike about a 4% rally over the past three trading days, and that’s typically not what we’re seeing spread out throughout the marketplace, uh, but here in Nike, again, seeing things perk up a little bit.
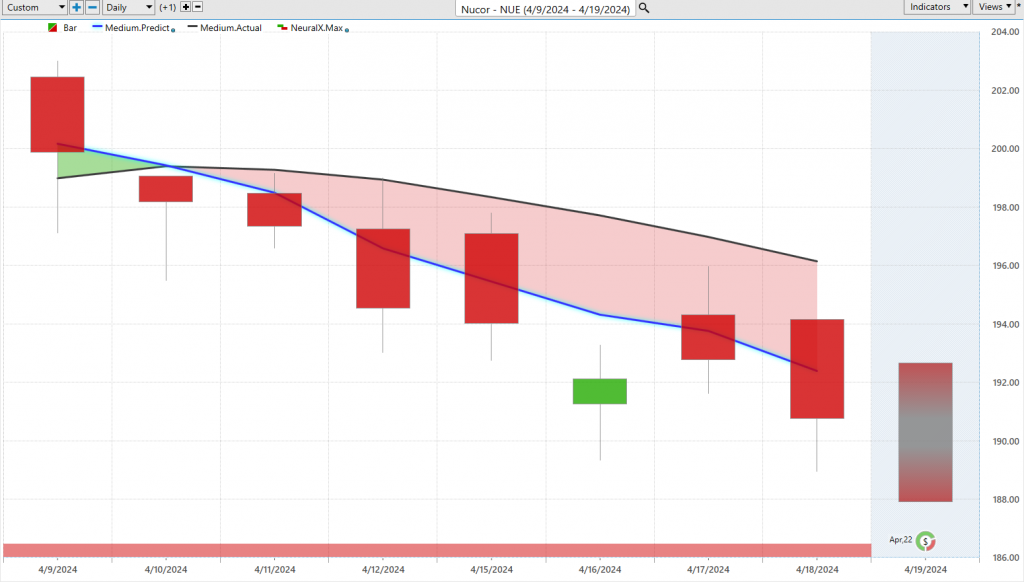
Here are shares of Nucor, this being a steel stock, and we see that blue line crossing below the black line, neural index bullish. Then, we can really fine-tune, well okay, if we’ve got these predicted high and low ranges, at what point do we really want to be aware to go ahead and set those shorts and make money on the bearish side? So here’s, you know, really a good example of a lot of markets this week, right? And if you look at like IWM, a lot of indices like the SPY, you get this bullishness in the early part of the week, but it’s a great opportunity to set shorts, reset those shorts, and just take profit on the bearish side here.
Uh, and so, if you’re a short-term trader, this is again one of these, uh, you know, collection of these tools, you know, that can be really used to do that week to week. And when we start to see things shift to the upside, well, we’re going to see that spread out throughout the marketplace. You’re going to see that on, you know, the SPY ETF, but right now, things are really quite bearish.
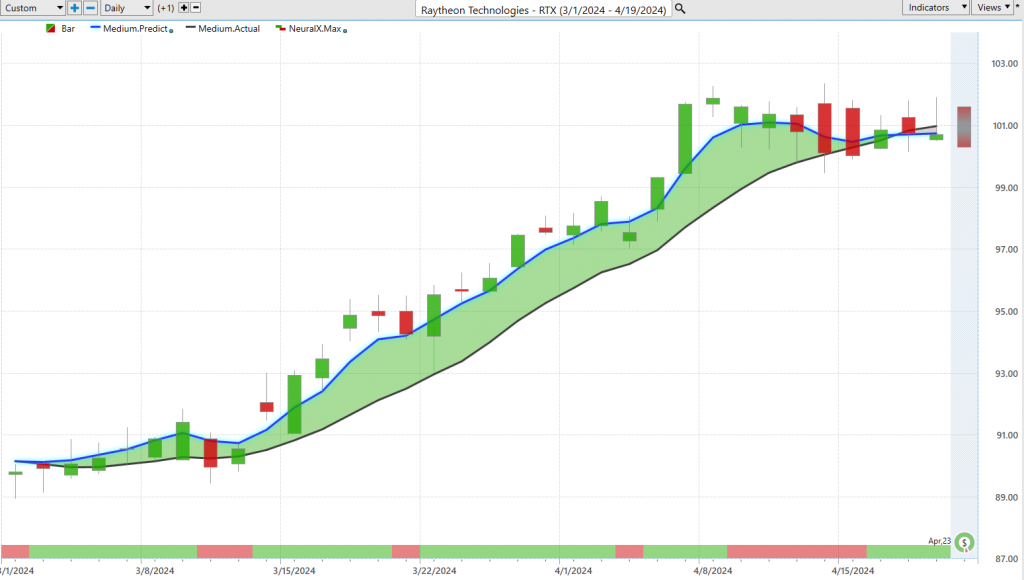
Um, so lastly, again, I just wanted to end here on Raytheon Technologies ($RTX), again another example of, uh, you know, identifying, okay, where is that strength in the market? We can look at those predicted highs and lows, and you actually see in Raytheon, here from last Friday, go down to this predicted low, up to the predicted high on Monday, down to this predicted low, up to the predicted high yesterday. But we start to see those predicted moving averages actually move below the actual moving average, so you see, you got a lot of conflict here. Uh, but since those forecasts had become bullish, well, there’s a really nice chunk of the market here, right? So, if you get ahead of this move, um, you know, even lock in our stops if we want to have a lot of cushion going into that earnings report. Um, but here, you see about a 12% rally, you know, just over the past 31 trading days. You know, over the past just week here, we can take a look at those most recent predicted highs and lows, you know, moving down to this predicted low, up to this Monday predicted high. You know, that alone there is a 1.6% move. So, it’s really hard to find these markets when we’re in these downtrends that are going to see these nice, you know, bullish movements up towards these predicted highs, but when you have these tools, it’s going to make it a lot easier, uh, to identify those better places of value to get involved in the market.
So we’ll go ahead and leave it there. Once again, this has been the Hot Stocks Outlook for April 19th, 2024. Thank you all for watching, best of luck, and bye for now.


