


Register for a Free Live Training
The Hot Stocks Outlook uses VantagePoint’s market forecasts that are up to 87.4% accurate, demonstrating how traders can improve their timing and direction. In this week’s video, VantagePoint Software reviews forecasts for SPDR SPY($SPY), Transocean ($RIG), Ovintiv ($OVV), Exxon Mobil ($XOM), Freeport-McMoran ($FCX), Trip Advisor($TRIP)
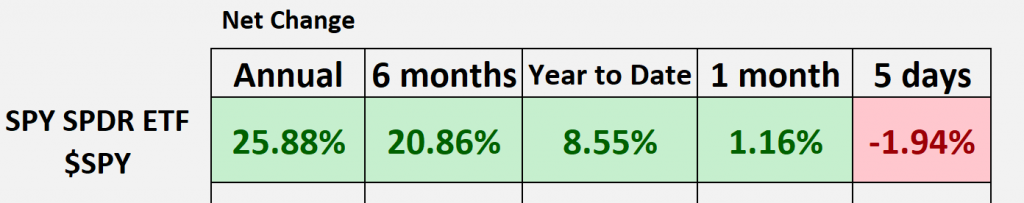
SPDR SPY ETF ($SPY)
Hello again, traders, and welcome back to the Hot Stocks Outlook for April 5th, 2024.
Hope you all are having a nice week out there in the financial markets. As always, we’ve got plenty to cover in this week’s outlook, so make sure, if you haven’t already, you click on that link in the description below. You can get yourself a live demonstration to really learn all the specifics about how this predictive technology can help you make better trading decisions in the marketplace. Now, as we typically do, we like to get a look at that S&P 500 via the Spy ETF, and something I think we really need to be aware of is there is some weakness coming into markets, and really specifically in a lot of the consumer cyclical space. So, restaurant companies, retail stores, and so we’re still up eight and a half percent, but I think it’s really getting to that point where you really want to be in the right assets to protect some gains and certainly see some more gains in the future here.
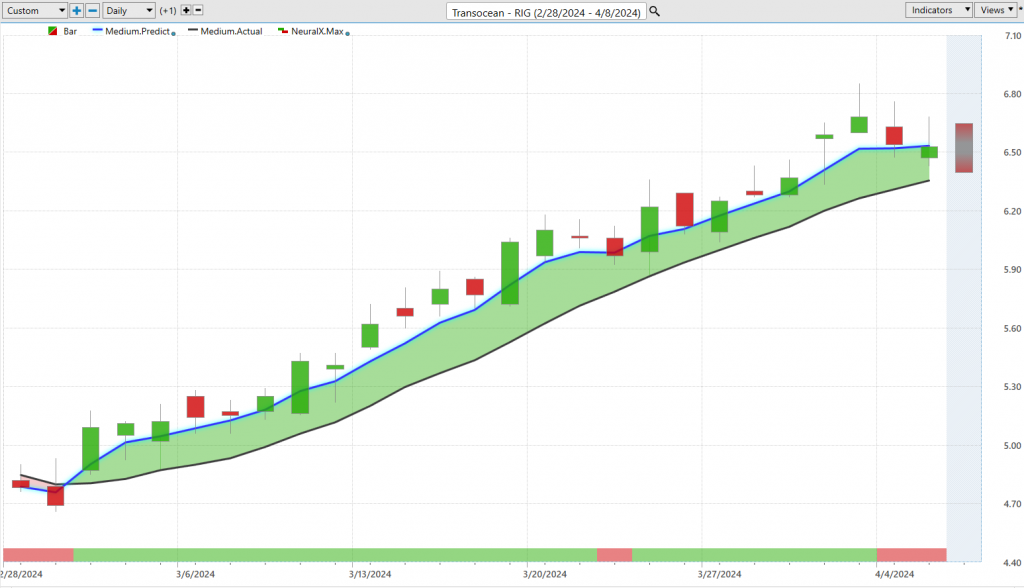
So, let’s go ahead and take a look at Transocean to start things out, and again, I have you know all the stocks where we’re seeing strong bullet forecast, and that’s where for the past several weeks in these hot stocks outlooks, really the attention has been on, you know, these material stocks. But Transocean‘s a really good example of you know, once we identify that hey, energy is starting to move higher, well, how can we use all of these predictive indicators depending on your trading style and time frame? And so, what we have here in Transocean is, of course, daily price action, so each one of those candles you see is representing a full and complete trading day, and it’s right up against all that price data. What you’ll first notice is a black and blue line value. Now, the black line value that you’re seeing on the chart, well, that’s actually just a simple moving average. We refer to it as the actual simple moving average, and this is a very common technical indicator because it’s really just going to take all the data from the previous 10 closes, it’ll add those all together, and then divide by 10. And so, what this is really used as is to act as a baseline, right, letting us know where market prices have already been. But of course, traders want to be ahead of that next move, and so what we’re able to compare that value to, essentially it’s you know plotting a value in price. What we’re able to compare that to is the Vantage Point predicted moving averages, and so what it’s able to do is really look at what’s going on in the market in question. It’s going to look at other markets that are known to drive and influence future price. So specifically for Transocean, well, naturally we can understand that things like the oil commodity market is going to play into this, but it’s also going to share important market relationships with maybe energy ETFs or individual stocks like you know, even some of these maybe Exxon or something like that, right? And so, that’s what the neural networks are doing, are figuring out these market relationships and pulling out these very important price clues that can be used to leverage and create these predictive indicators. And so, this is a really global approach that’s even going to look at things like interest rates, going to look at the value of currencies in the dollar index, and then generate these predictive forecasts. So whenever this predicted moving average, in this case, crosses above the actual moving average, well, you can expect average prices to start moving higher. That’s essentially what the forecast or indicators are predicting here. And so, as long as that blue line remains above the black line, well, the overall trend is up, and therefore, you would understand, well, okay, if you’re a shorter-term trader, you want to be on the bullish side, look for levels to, you know, acquire a position and shoot for those profit targets. But we’ve just seen, you know, a lot of attention here in energy, and see, we’ve got a 33% rally in just the past 24 trading days in Transocean. I really encourage you to go back and watch many of those previous stocks outlooks because this is really important when we think of what are the drivers behind energy stocks going up. Well, certainly the commodity itself, you know, what’s going on with mining companies, well gold and GLD have been shooting up, right? So these are the things that need to be factored into your analysis. And so, as we look a little bit closer here at Transocean, well, really nice move over that 33%, but if you look at the bottom of the chart here, you see this bar that goes from green, you see it flips down to a red, flips down to a red once again, and what this is, is an indicator utilizing that neural network approach, looking at those in-market relationships but tuned to solve a different problem. And this problem really just being 48 hours, or you can think of it as two candles, moving forward. And so, that’s very quickly going to adapt to what’s going on and let you know, okay, well, is there this short-term momentum in the market? And lastly, you’re given actually a predicted range, so we can think of this is you know, not two days like our neural index, but really intraday price levels that traders can use to exploit market behavior. And so, as we take a look back at the market here, we can see that okay, well, if we know energy is moving up, we see that in many of the other energy stocks, well, where do we want to be accumulating a position, specifically here in Transocean, because every market’s going to be a little bit different, and we need to do that analysis before we go ahead and get involved. And you see here, one, two, three, four, five, six entries here as oil is done quite well. And again, that you know, very aggressive move higher here. When we look again at the overall percentages here. So, this is what traders just need to understand, is you know, we need to identify these opportunities, identify them really as a sector, and then exploit them on an individual basis, so you can really minimize the risk and make the most of each opportunity.
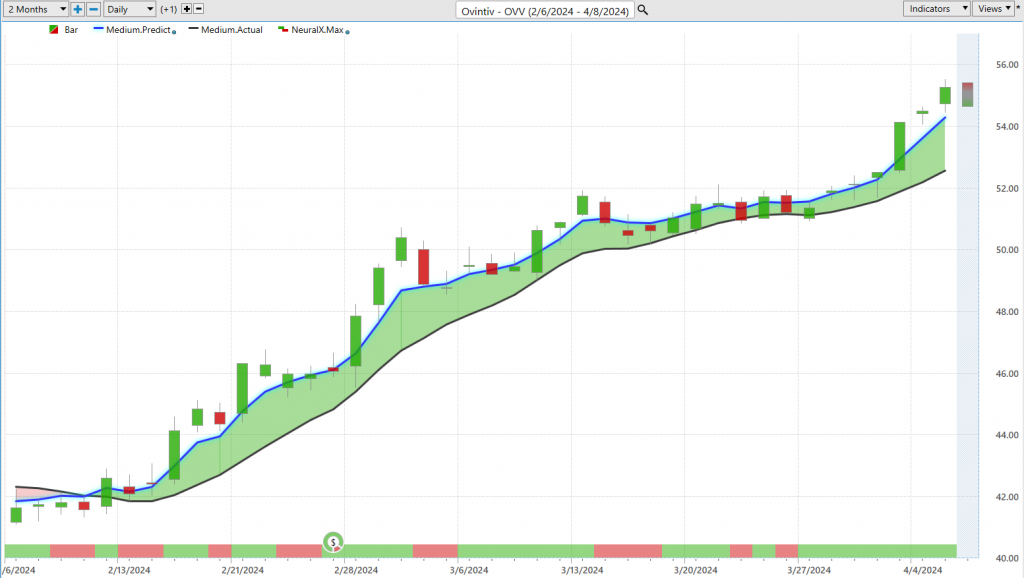
Here’s Ovintiv (OVV), so this is another energy company. Here, we see that blue line crossing above the black line again, neural index very bullish going into the move. And so, over the course of this move here, you see, you’ve got about a 28% rally over the past 37 trading days. But of course, traders need to be a little bit more nimble here. And if you want to accumulate a position, this is where Vantage Point‘s predicted highs and lows can be really helpful. Say, okay, energy on the move, all right, well, where do we want to be looking to acquire a position and exploit this, again, overall trend that we see playing out? And so again, really nice move in Ovintiv.
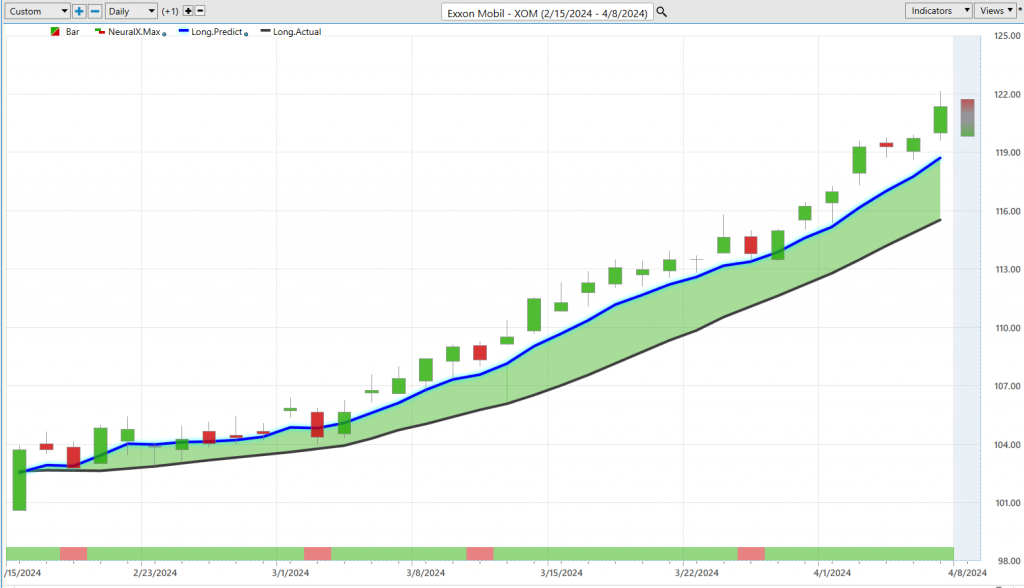
Here’s Exxon, which we’ve brought in past few weeks, along with you know, again, just keep looking at energy, mining companies is really where all the focus is. But a 16% rally, but more recently, I think we looked at this a couple of weeks ago, where we have this predicted low here, right? So going into the last week, saying okay, well, where can I accumulate a position? Well, boom, if you get filled right there, you’re immediately seeing this market accelerate higher, and even this week, looks like on Monday, moving down to that predicted low and then accelerating further still. So, this is really helpful for stock traders but also if you do trade the commodity and want to get exposure in different ways, you know, same forecast work on the crude oil market. So here again, a 16% rally in 34 trading days.
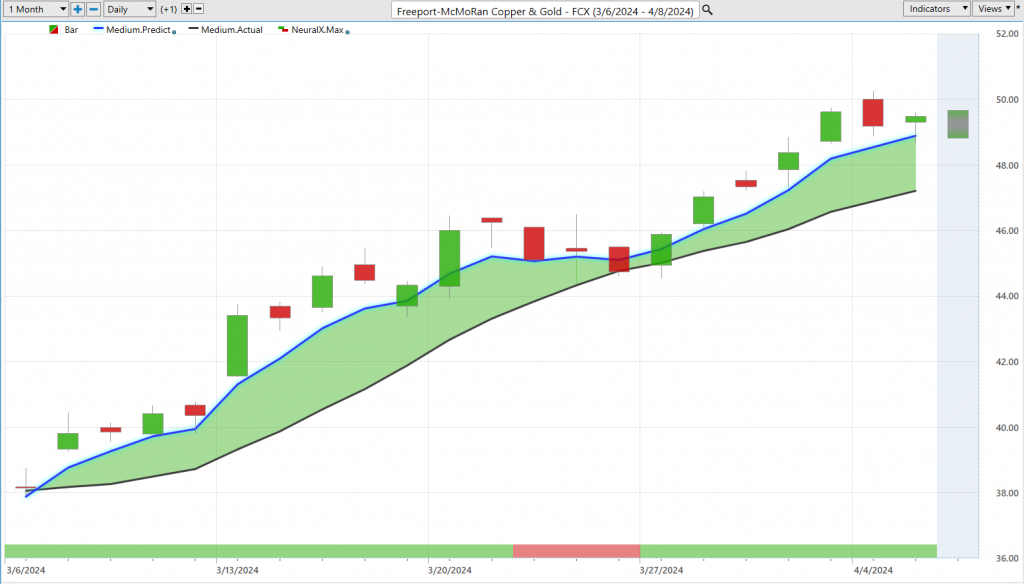
Here’s Freeport-McMoRan (FCX), so you know, I think last week we looked at one of the smaller mining companies, and again, you see very similar charts around the space because they’re driven by those intermarket relationships. So gold’s had a really nice rally, copper had a really strong move, and so this is causing FCX to really keep accelerating to the bullish side here. So, we can again take a look at the overall move here, got a 26% move in the past 20 trading days. I mean, even just a couple of hundred shares here is a couple of thousand dollars on the bullish side, where you can trail those stops, maybe have some energy companies going as well, and you’re doing quite well and really positioned in the right things here. But of course, we can take a look at this predicted neural index, and you see that when that momentum is in the market, well, you’re going to get that updated forecast. So, every day, you can think of this as really projecting forward two trading days ahead. And so, what it’s telling you is, expect strength, expect strength, expect strength. Here’s some weakness comes in, and you see that there’s some weakness over the subsequent 48-hour periods, but the overall trend, that blue line still above the black line, the momentum comes back, and that’s where we really see again an acceleration in the share price of many of these assets here. So, nice move there in FCX.
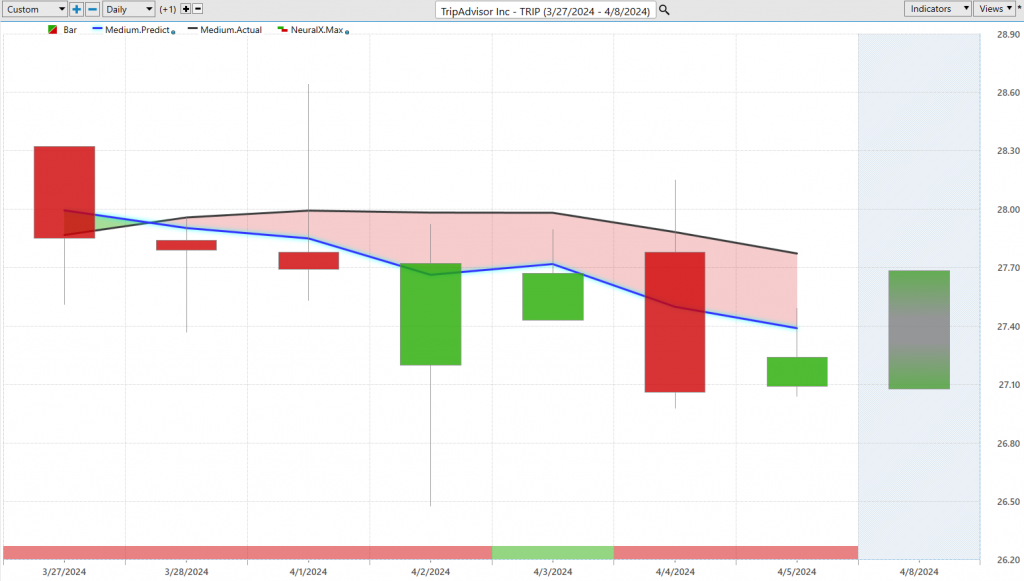
Lastly, here, what I wanted to bring in is the consumer cyclical space.
So, here’s TripAdvisor, but we really see this, again, across a lot of the retail stocks, restaurant companies. This is where you really want to either, you know, take profit on some longs, there’s been some great rallies there, even the tech space, we’re seeing some weakness over there. So, here in TripAdvisor, though, we’re starting to see a lot of these predictive indicators move to the bearish side. So, in this case, we have that predicted moving average cross below the actual moving average, and this sets up a scenario to short, take profits on shorts, would make the most sense here, and it really is nice to balance out the portfolio. If you do have some of those long positions and you’re trailing or stopped, well, sometimes it’s easier to hold on to some of those longs when you’ve got some shorts to balance out the overall portfolio. And here, you see, we get this move lower, index gets bullish here, and we get a little bit of an uplift, but again, the overall trend is lower. And these are really the types of markets that you don’t really want to be positioned in currently, and we can wait until we start seeing those Vantage Point forecasts start to get bullish. So again, just wanted to really, in many ways, just sort of update things. You know, we are seeing again that broad-based weakness and a lot of the more popular stocks that you know, can move a lot, and you’re seeing a lot of attention moved to these, you know again, mining, energy stocks, some of these things that are certainly driven by those inner market relationships, but sometimes don’t get a lot of attention. So, with all that, thank you very much. Once again, this has been the Hot Stocks Outlook for April 5th, 2024. Thanks again, and bye for now.

