


The Hot Stocks Outlook uses VantagePoint’s market forecasts that are up to 87.4% accurate, demonstrating how traders can improve their timing and direction. In this week’s video, VantagePoint Software reviews forecasts for ConEdison($ED), Duke Energy(DUK), Kellog’s(K), McCormick’s (MKC) and Franco Nevada(FNV).
Register for a Free Live Training
Hello again, traders and welcome back to the hot stock’s outlook for April 9th, 2021. Hope you all are having an excellent week out in the financial markets and as always plenty of opportunities to cover in today’s outlook. So I’m going to be doing a little bit of a recap episode today. Really great opportunity to go ahead and watch some of those hot stocks outlooks from mid to late March. And we’re going to be reviewing a lot of those markets and how we identified a lot of these sectors shift out there in the marketplace. So if we start here, we have Consolidated Edison and Duke Energy, some utility stocks, very conservative investments. We also have Kellogg’s and McCormick. So they’re non-cyclical consumer stocks. Again, pretty conservative. And then we also have gold mining stocks. So these are the areas generally over the past few weeks where we’ve identified some strengths.
ConEdison(ED)
And so when you’re utilizing a tool like VantagePoint to try to identify, okay, well, where are some bullish signals from some of these predictive tools coming in? So I can look to take some trading opportunities. So here in consolidated Edison, what we have here is daily price action. So each one of these candles represents a full and complete trading day. And what you get right up against that daily price action, you’ll see there is a black line and also a blue line. Now that black line that you see there, that is actually a simple moving average. So a very common technical indicator. What it does is just takes the last 10 close prices, adds all those close prices together and then divides by 10. And it offers a good rolling smoothing out of the overall price data.
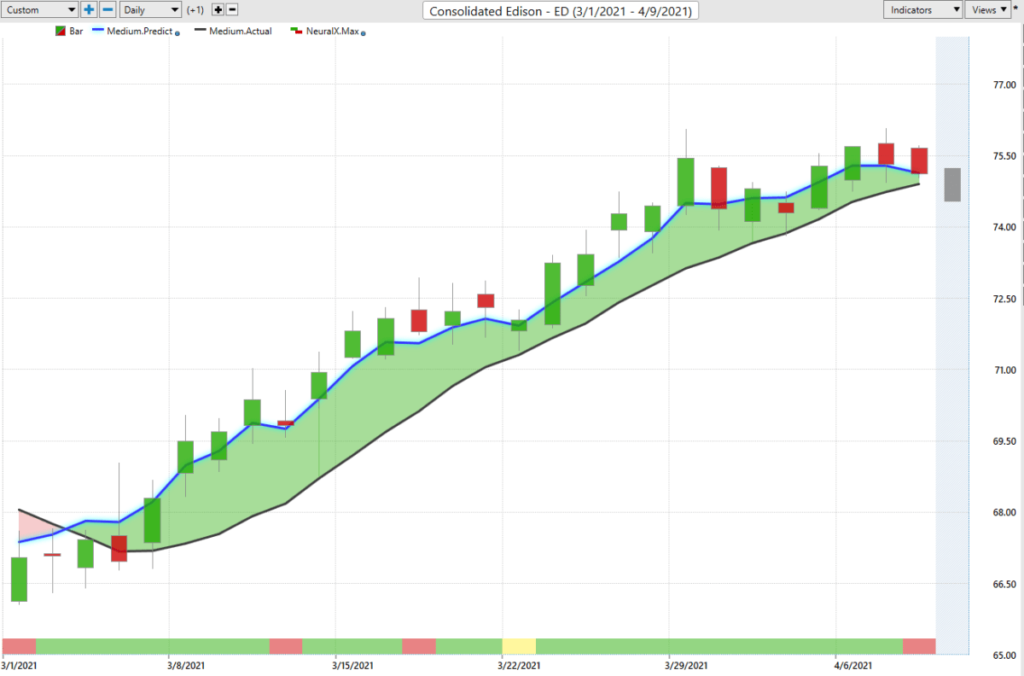
So you can see where market prices have already been over a given period of time. Well, traders need to understand where are market prices going moving forward so we can be ahead of those moves and get some positions on. And so what we’re able to do, is compare that black value to this blue value. And for that to be calculated and generated and plotted up against the chart each and every trading day, VantagePoint is utilizing its technology of artificial neural networks, so a type of artificial intelligence, to do what’s called intermarket analysis.
So that means when trying to forecast the future price of ConEd here, it’s going to be looking at other utility stocks. It’s going to be looking at ETF groups, it’ll look at other individual stocks. It’ll look at things like the oil and futures and commodity markets. It’ll look at global currencies, global interest rates. And it understands how these global market relationships, again, are affecting future price. And what it does is it actually uses Those intermarket relationships to generate true price predictions.
So off to the right of the chart, it hasn’t yet occurred yet, as far as where things are headed. So what it then does is actually take that predictive data, derived via that artificial intelligence process, and builds that into the value of these indicators. Turning what was a lagging indicator that’s just going to summarize what’s already occurred into the market, into a forward-looking predictive tool. So whenever this blue value is crossing above the black value, it’s suggesting that average prices are going to start moving higher and it’s going to help produce a signal earlier than traditional technical analysis. So when we’re trying to figure out, okay, well, is there a shift going on here in utility stocks? We’re able to identify that early and were able to actually use some scanning tools within the software, as well, to make really short work of finding those opportunities.
So as we walk forward through time each and every trading day, things shift around, new opportunities open up. And we want to be able to go into the next trading day really aware and say, okay, this is where we want to focus our attention. So here with Consolidated Edison, we see since that blue line is crossed the black line, now these are utility stocks, they’re not going to move around hundreds of a percent over a couple of weeks, but you’ve got a nice rally of about 12.3%. But what I want to do is highlight some of these other indicators. You’ll see at the very bottom of the chart, we have this bar that goes from green to red. And again, after each and every trading day, so at the end of the day after the close, you get these updated predictions. So you’re going to get either a green or a red bar here based on what occurs.
Duke Energy(DUK)
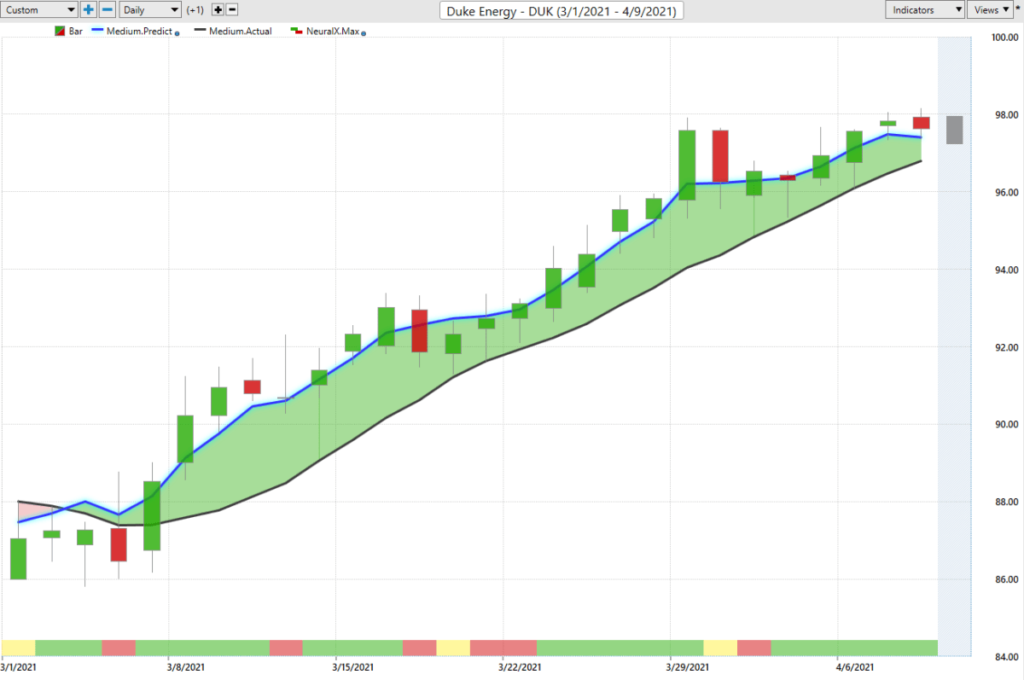
And you also see at the very right-hand side, you have a predicted shadow candle here. So this is a predicted high and a predicted low. And how this all works is there’s a separate neural network that’s being utilized to forecast this, what’s called the neural index, but this is tuned to be very short term, just 48 hours. It’s not like our predicted moving average is really smoothing out in summarizing price and forward predicting where things are headed. This is just looking 48 hours ahead, short term strength or weakness. How are things looking over that short term window and has an extremely high level of accuracy of upwards of 80 plus percent accuracy over, really, all the markets. So we can use that as a reliable indicator, regardless of the markets that we’re trading. And then at the very right-hand side, again, we have this predicted high and a predicted low. So actual intraday trading levels so that you can go, okay, well, where should I go put my limit orders? Where should I set profit targets? And how can I be completely prepared for the trading day that’s coming ahead?
And so when we look at ConEd and I’m pretty sure we looked at ConEd several weeks ago here. But a good example of saying, okay, well, if you’ve identified that utilities are a place to be in the market and that’s where if your shorter-term day trades swing trading options, well, this is an area where you say, look, I want to be buying down at these predicted the lows, if we’re on an intraday timescale or intraday trading strategy here. And you see how effective that is to over that 12% rally, you’re getting good entries at the lower part of the range and then benefiting, of course, as the market finds these predicted highs, or just generally as that blue line remains above the black line, the overall trend continues.
You can trail your stops up and make money as the market continues. But what’s really effective here, is we look at Duke Energy and we see that, okay, what the exact same time period, if we’re running scans with the VantagePoint indicators that are looking for these crossovers, looking for these bullish signals, well, they all come through at same time and really help alert us to say, something’s going on here in utilities, let’s focus our attention and trading capital in that area of the market. And the same approach that says, look, blue line over black line. You see some longer-term periods where neural index gets bearish here. You get a little bit of sideways overall, fairly bullish and trend, very bullish here. But you know that, okay, well, I’m going to be looking to buy at or near these predicted lows, buying on pullbacks.
Kellog’s(K)
Very clear that, you know what’s going on in this sector. You’ve seen things reverse and therefore want to be a buyer here. So we see Duke Energy shares moving up quite a bit as well, still in a pretty solid uptrend. And what’s informative about this as well, is this is a fairly defensive play in the markets. And we’ve talked about how crude oil has gotten weak. There’s certainly been some stocks that have really suffered over the past few weeks. And you really want to get defensive with some of those long positions and make sure that you’re not suffering as some of these markets turn around and reverse, especially things like oil and some of these tech stocks we saw a reverse. Here, you see about 11.5% rally, multiple entries as the market moves higher, but moving on here to Kellogg and again, so consumer non-cyclical stocks fairly conservative.
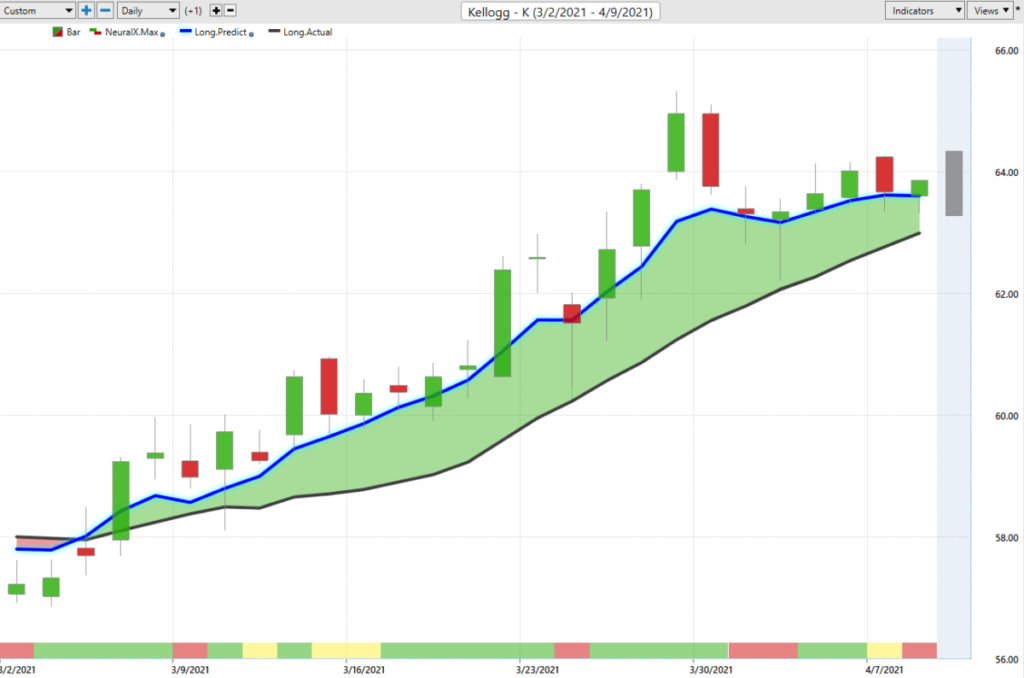
You see about the same time period, that beginning of March, this is where these areas of the market start doing well. And you can, again, focus that trading capital and say, okay, well, if I’m coming in and saying, I want to be a buyer where, intraday, is it going to be acceptable to go ahead and accept entries into that market? So you see here again about seven or eight entries again, Kellogg, not the most exciting stock we’re going to see out there. But if you’re looking for a place to trade, obviously here, this market’s moved up 9% when we’ve seen indexes and oil and things like that runs sideways and down. Here, you’ve got a nice 9% rally, again, with some of these utilities. And also some of those areas where you can short the market and head yourself on the downside.
McCormick’s (MKC)
McCormick and Company. This, we looked at several, several weeks ago. And you see how opportunistic some of these things can be. We’re back here, we’re seeing, okay, well, here’s where this opportunity starts. And we start to see, again, these utilities non-cyclical stocks start to move higher. And therefore that’s where we want to focus our attention. You get your neural index bearish here, a little bit of sideways price action.
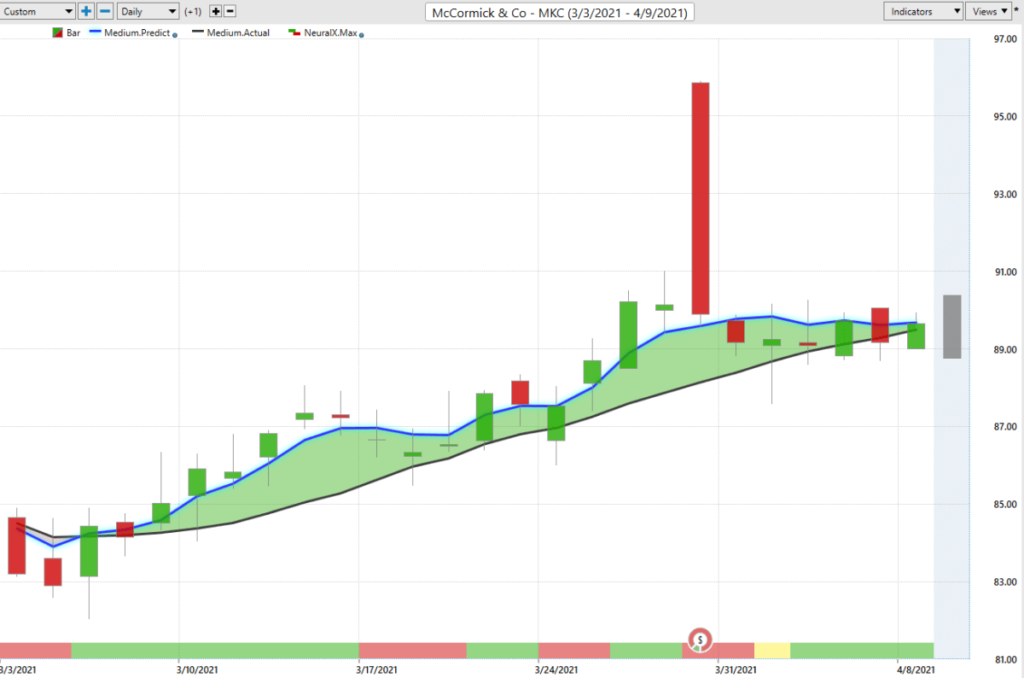
But you know, this trading day where you gap up, if you have a limit order, you’re looking to take profit in this market at all, you’re going up getting filled probably very high up there in the trading day. And of course have things settled down. The overall trend still up here. But again, we can look at these predicted highs and lows and understand that when we identify these areas of the market where we know we want to be long or no, we want to be short, it makes it very straightforward as far as how you actually want to interact with your brokerage and the trading platform and say, okay, well put that limit order in. I know what I’m looking for as far as price action. And what’s going to get me in again on the lower part of these ranges, you can really benefit as the market moves higher here.
So McCormick and Company, again, has settled back here a little bit, but overall seeing that very similar move of very specifically, which stocks are doing well here in the marketplace and plenty of places doing poorly. Lastly here, Franco Nevada, and here we have a situation where if you follow the gold mining stocks and gold, the commodity, very closely, we had this big consolidation and pull back period in here. And gold actually went back and retested way below 1700 and then completely came back.
Franco Nevada(FNV)
But you see here, gold is another one of these areas where, several weeks last month we identified that look, there’s some crossovers to the upside here going all the way back towards early to mid March here. We got really nice entries, as far as those predicted moving averages or predicted highs and lows, and okay, well look to go ahead and get involved in this market. So you get this opportunity to have gold stocks are going to start moving higher, locking your stops at break even, let that trend continue. We get, again, this really deep pull back in a lot of the commodities and a lot of the gold mining stocks. But you see here that again, this neural index is very, very bullish here. You get just a couple of trading days where it stays bearish. It says, look for that weakness over the next couple of sessions here, but how quickly things get bullish once again, crossovers to the upside.
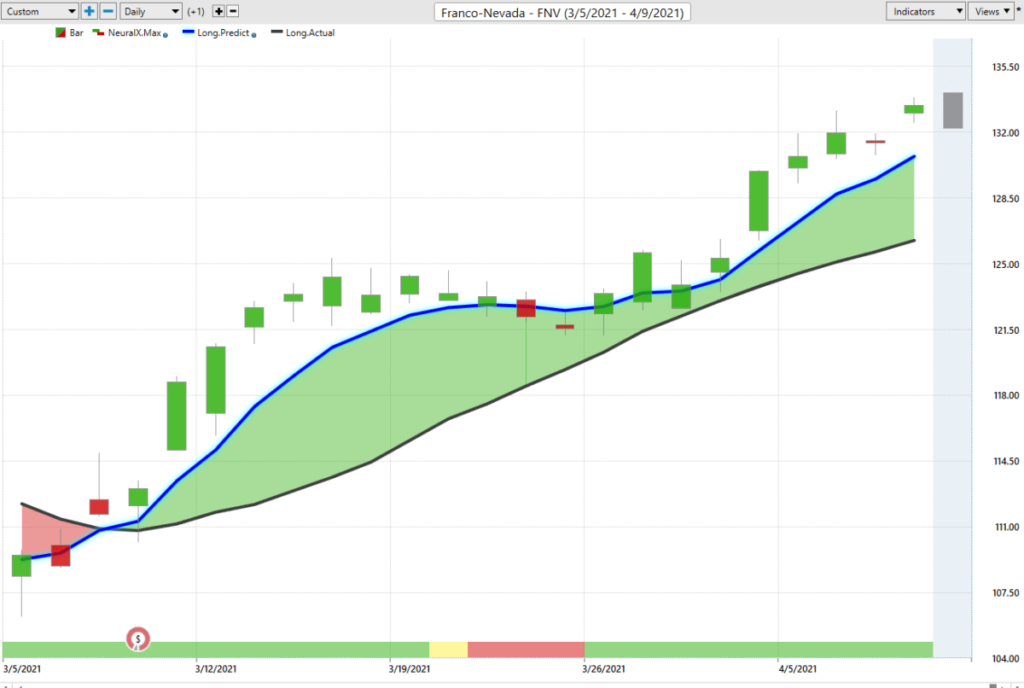
And again, very clearly that if you’re running some of these scans in the software, you’re going to get those signals as far as, blue line crossing black line, neural index bullish. And that this is again, another place where things are bullish. You’ve already identified things starting to move higher and you can come in and say, look, I’m going to go ahead and participate. I see what’s going on here, recognize this longer-term retracement phase where we went sideways, but as that trend continues, see about a 7% uplift in shares. And of course, things still moving higher here that trend very much to the upside. So what we get here, with this IntelliScan, we can go ahead and show some of this off. But we have the ability, and this is just the default. You can change a lot of these predictive indicators to fit the timeframe that you’re trading it.
So if you’re shorter term, maybe you want to use just the neural index, your predicted highs and lows. You can program those in and search for different criteria coming through. But with the defaults here, you see that we can scan for those fresh crossovers from that blue and black line to that medium term, predicted moving average and identify those fresh trend shifts that are occurring. And so if we do this every day, we tend to identify when these big shifts come into the market, like with the utilities, with the consumer non-cyclical and even the gold and some of the oil stocks, turning lower gold stocks, turning higher and creating a lot of opportunity, but a lot of places where you really need to have some selection in that overall process. Where you really want to pick your spots as far as where you’re getting long, where you’re getting short and where you’re targeting your capital to be most effective. So once again, this has been our hot stocks outlook for April 9th, 2021. Thank you all for watching best of luck out there. Thanks again. And bye for now.

