Register for a Free Live Training
The Hot Stocks Outlook uses VantagePoint’s market forecasts that are up to 87.4% accurate, demonstrating how traders can improve their timing and direction. In this week’s video, VantagePoint Software reviews forecasts for SPDR SPY($SPY), Microsoft ($MSFT), Kraft Heinz ($KHC), Northrop Grumman ($NOC), Henry Schein ($HSIC), D.R. Horton ($DHI), SNAP ($SNAP), UBER ($UBER)
SPDR SPY ETF ($SPY)
Hello again, traders, and welcome back to the Hot Stocks Outlook for August 2, 2024. I hope you all are having an excellent week out there in the financial markets. As always, we’re going to take a look at the most recent VantagePoint predictive forecast. If you haven’t already, make sure you go ahead and click on the link in the description below and get yourself signed up for a live demonstration so you can learn all the specifics about how these predictive tools and technologies can help you make much better trading decisions out there in the marketplace.
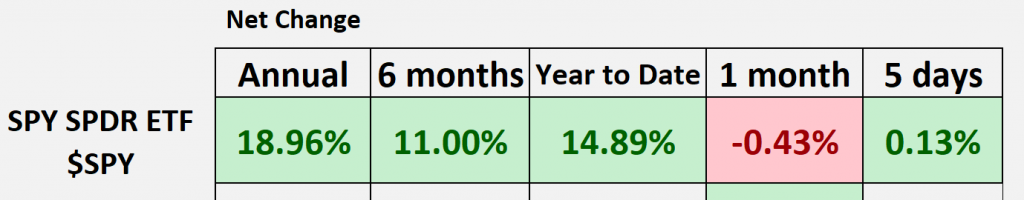
Now, we’ve got plenty of stocks and individual opportunities to take a look at, but obviously, there are some very important broader themes out there that we want to be aware of. I certainly encourage you to go back and watch some of the previous Hot Stocks Outlooks as we highlighted stocks like Northrop Grumman and the defense stocks Henry Schein Inc. (HSIC) and a lot of the building material stocks. Outside of that, there has not been a lot of strength in the marketplace. We typically like to look back at some of these given periods of time, but it sort of doesn’t quite tell the story here. We see we’re up about 15% year-to-date. If we go back 30 days, the market has shot up, shot back lower, and it’s a very similar situation for the past 5 days. But we are seeing a tremendous amount of weakness. The market on Friday responded to a lot of news and employment information coming out, but all of this was really baked into the cake here. We can really see this in shares of Microsoft ($MSFT).
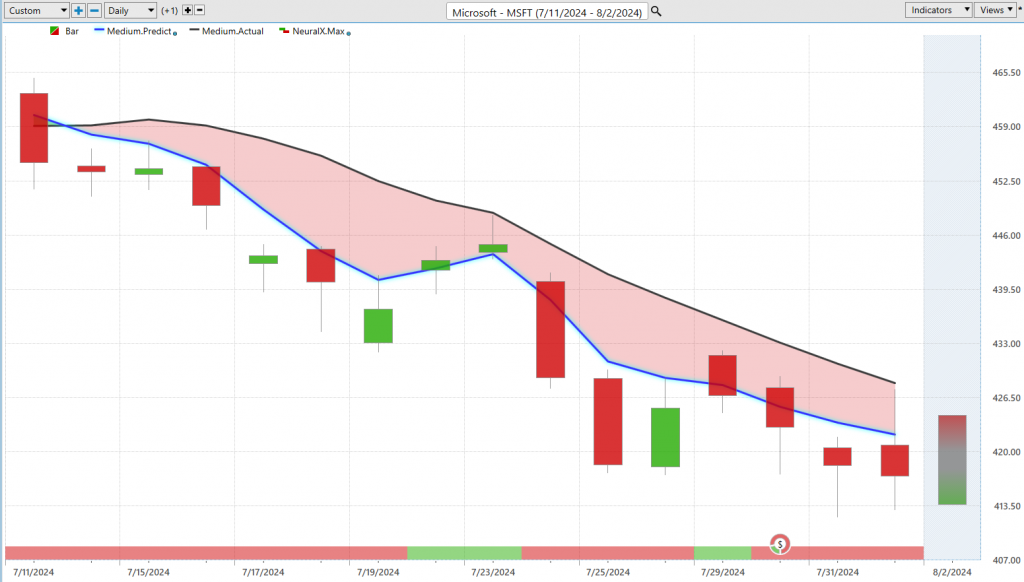
So, what we have here with Microsoft is daily price action, and all of these forecasts work the same way. Once we understand how these predictive indicators work, we can use that on these subsequent charts. Here with Microsoft, what we have is daily price action. Each candle represents a full and complete trading day, and it’s right up against the price data. The first thing you’ll notice is there’s a black line and a blue line value. The black line that you’re seeing there is actually a simple moving average, a very common technical analysis indicator. In this case, it’s a 10-period, so it really just looks back at the previous 10 close prices, adds them all together, and then divides by 10. What that does is really smooth out the existing price action, but all that data is really coming from the past. Another weakness is that all the data comes from just shares of Microsoft as if Microsoft trades in some sort of vacuum and isn’t affected by the Qs and other tech stocks, and SPY. So, what we’re able to do is actually compare that black line, or we can think of that as a lagging moving average, to this proprietary predicted moving average. For this calculation, essentially a calculation of future prices moving forward, for that to be calculated and thus plotted on the chart every evening, well, this is where the technology of artificial neural networks comes into play. They’re performing what we would call intermarket analysis. What that means is that there are known relationships between Microsoft. There are positive relationships, inverse relationships, and other markets that are driving and influencing the future price of this target market. That can be things, of course, like SPY. We see very strong correlations between Microsoft and the broader market, and those other ETFs. But it’s also able to look at important markets like the value of the dollar index, potentially oil or gold markets, or other commodity markets, even interest rates and bond markets. So, it’s able to look all the way down to individual stocks, ETFs, the whole broader market in a very global approach. Then it uses that information to make highly accurate price predictions. It is thus those price predictions that are built into these indicators, turning what were lagging tools that really just react to what’s occurred in the market into forward-looking predictive tools.
When we look at Microsoft and we see that blue line crossing below the black line, because this is such an important stock, it makes us look at things like the other tech stocks and see how widespread this weakness is. That’s why we’ve really been very selective with where we are seeing bullish opportunities, where there’s a really strong forecast, but the broader market theme is very bearish here and we’re seeing that really play out. About an 8.12% decline in the past 14 trading days in shares of Microsoft and that looks to continue. Of course, we can look at VantagePoint’s predicted highs and lows. Every week, what we do is take a close look at these predicted ranges. These are another aspect of the software that’s determined via that neural network process but being tuned to solve a different problem, looking for intraday strength or weakness in the market. We see here plenty of opportunities where we move up towards those predicted values, but the overall trend with that blue line below the black line is very much bearish here.
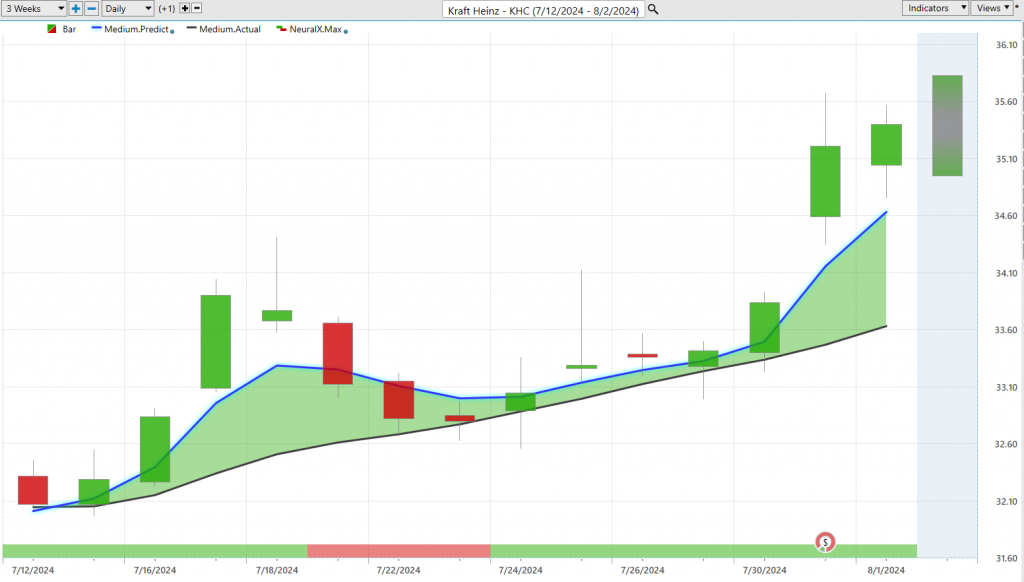
Now, there have been really exciting opportunities, but they are a little few. Kraft Heinz ($KHC) is far between. A really good example here in shares of Kraft Heinz, we got a really nice reaction after earnings, but this has been a stock where we actually see that blue line cross above the black line, neural index get bullish, and this is actually a good time to go ahead and explain this bar at the bottom of the chart here. You see this bar that goes from green to red back to green. Just like the predicted moving averages and our predicted highs and lows, traders have to solve different problems that may be attached to different time frames. When we look at the predicted neural index, this is actually an extremely accurate indicator with upwards of 86% accuracy predicting short-term strength or weakness over the next two trading days. So, we can think of that as very short-term strength or weakness. It really gets you ahead of some of those declines and consolidations in the marketplace. This is a really great example of this where you see in Kraft Heinz you see where that neural index goes bearish and you get these subsequent days where the market is moving well below that predicted moving average, moving down towards the VantagePoint predicted highs and lows that we highlighted. This gets traders ahead and understands there’s likely to be some weakness here, but the overall trend is up. As we see that neural index get bullish once again, the momentum picks up, and we see that nice move in the marketplace in shares of Kraft Heinz. Like I mentioned, there are not a lot of bullish areas in the market when we start to see the broader indices go lower. You see about a 10% rally here just in the past 14 trading days, but certainly many of these opportunities want to be trailing stops, staying defensive if not hedged on the bearish side, seeing so much of this weakness.
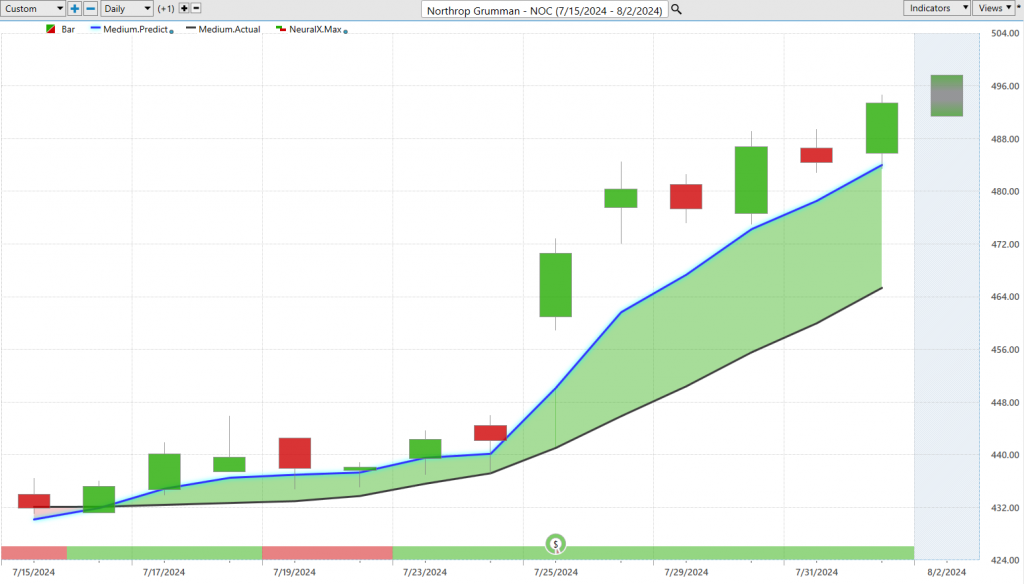
Now, we looked at the defense and aerospace Northrop Grumman ($NOC) ETF last week. That really lets you know that, just like with those home building stocks and things like BLDR, which had a really fantastic rally over the past month, here in Northrop Grumman we have a similar situation where that blue line crossing above the black line, you’ll see that neural index go bearish, and you do get some subsequent sideways price action. Again, as that momentum comes back into the market, we really start to see shares accelerate. You’re seeing a lot of just event-driven news here. This is something where these defense stocks are certainly going to be determined by things going on all throughout the world. Here you see about a 13.5% rally, and really doing quite the opposite of what we’re seeing in many of those tech stocks. If you want those areas to be bullish and conversely have some areas where you may want to hedge and get on the bearish side, it becomes quite simple to use VantagePoint’s predictive indicators and find where those very strong forecasts are, whether they be to the bullish or bearish side. Really nice opportunity there, really nice entry as we see things accelerating to the bullish side.
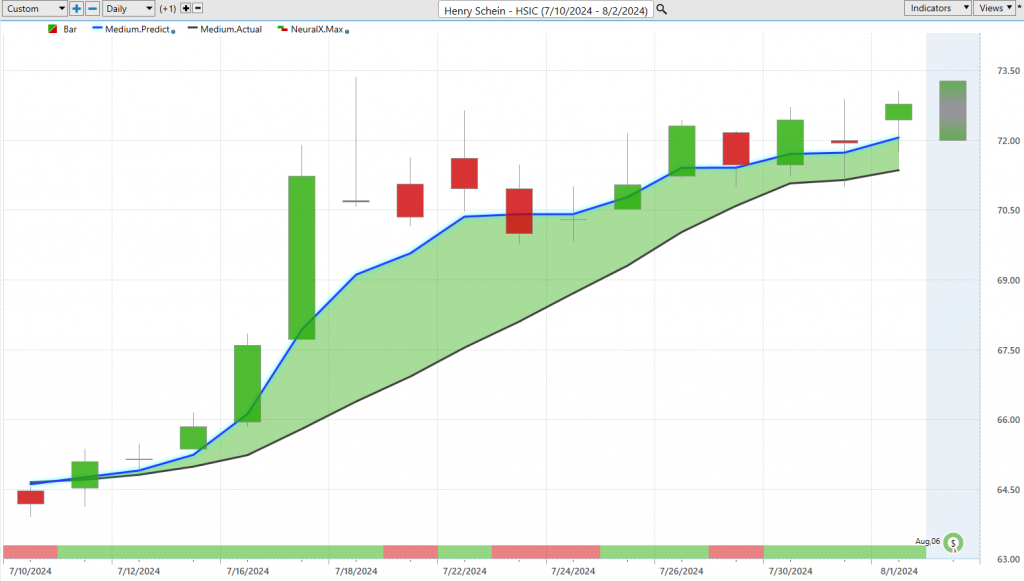
Henry Schein ($HSIC) had been really beaten down. You see this blue line crossing above the black line offering a really nice opportunity to get involved. Again, few and far between as far as some of these areas in the marketplace, but we can use VantagePoint’s predicted highs and lows to manage these things every day. Understanding this is in an uptrend, as a trader, we may want to look down towards these predicted lows and participate in this bullish rally. Again, we can still go ahead and take a look at the overall move here. Just over the past 15 trading days, you’ve got another 11-12% move to the bullish side.
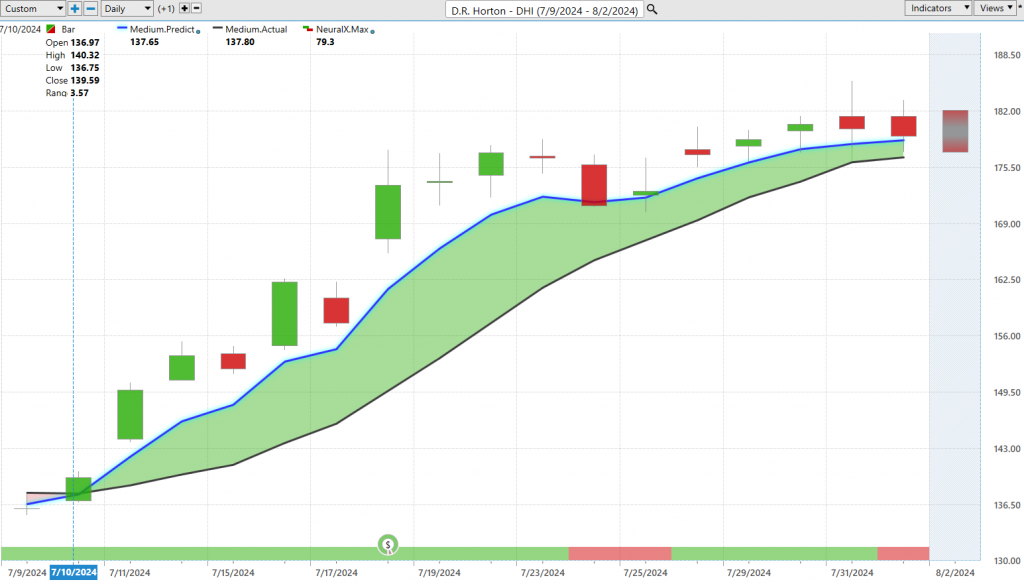
This is a good example, and D.R. Horton ($DHI) here really is probably the best example of where we saw a lot of the material and construction stocks turn higher. That was really the entry. If we go back and watch the Hot Stocks Outlooks from about four weeks ago, this is where we started to see IWM, a lot of the small-cap stocks, turn higher. But now it looks like a lot of this is being overcome by just the overall weakness that’s coming in via the SPYs and the Qs, and it’s really dragging just about everything lower outside of some of these really choice areas of the market. But this may even be susceptible as we see that neural index go bearish, and we are seeing again a lot of market weakness in some of those smaller-cap stocks that were doing really quite well here. D.R. Horton, we can notice here is that the market hasn’t collapsed like the broader market of stocks like we see with Microsoft and the Qs and the tech space. You also see the market just running sideways and look at these predicted lows just day after day giving you really nice opportunities to take a little piece out of the market, minimize your risk, and stay involved here. Really nice rally again in shares of D.R. Horton, but we really want to recognize these things really several weeks ago, really at the beginning of July, leading to a nice month in these construction shares.
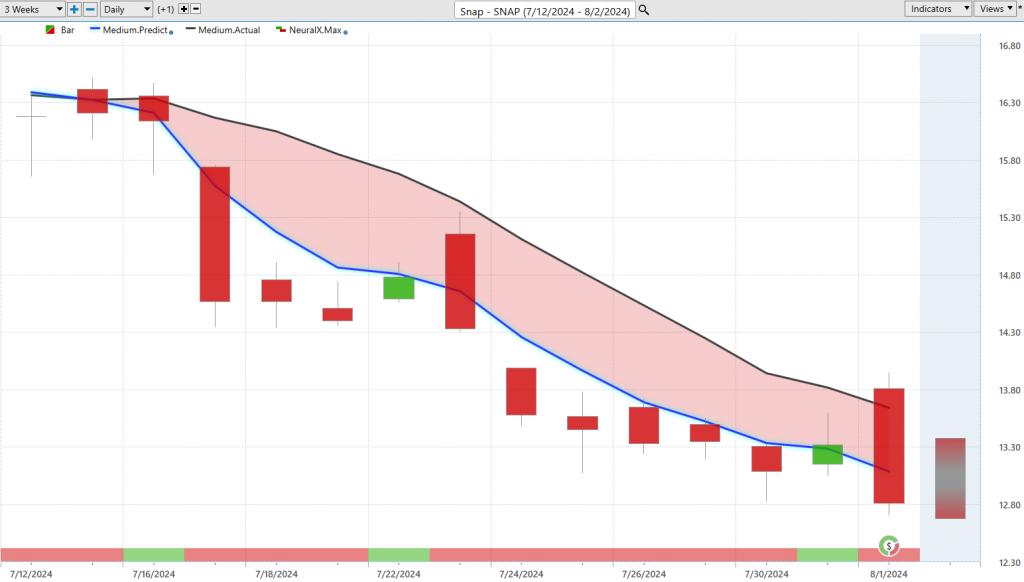
Now, here’s shares of Snapchat ($SNAP). The tech space and this is really the broader theme that’s playing out right now. Here we see this blue line crossing below the black line. We see again Microsoft, the Qs. I mean you can pick your tech stock where the forecast looks the best and maybe where you can get that short-term entry via the predicted highs and lows, but everything looks very, very weak here. Of course, we can look at VantagePoint’s predicted highs and lows and get a sense of how these tools can help you. You see very early, getting almost a perfect entry as that market moves up towards the predicted low then declines. You see a little bit of volatility here, things gapping around, but look at this level, these two predicted highs that were never hit. The market gaps up, and then the resumption of that downtrend, and we just see more and more weakness. You get that noise around earnings but just gapping up and pretty intensely going lower very, very quickly here. Overall, we’ve got a really nice movement lower here, a really aggressive movement lower about 21% in shares of Snapchat in just the past 13 trading days. When you recognize that broader weakness that we see in the Qs and see in Microsoft, you can really pick your spots and say, okay, how can you get exposure to this theme of tech weakness that we’re seeing, and find the best places to go ahead and do that.
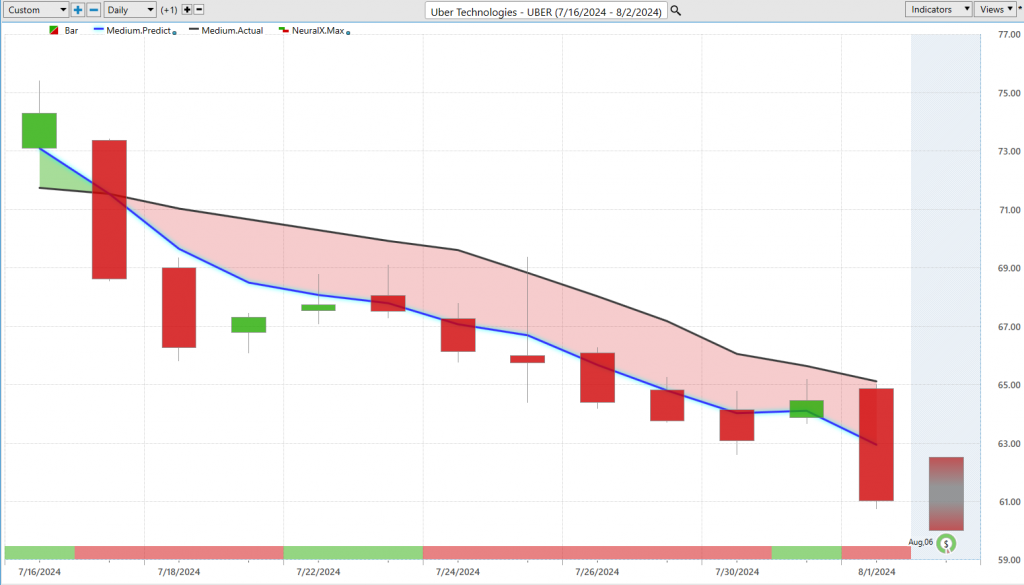
Lastly, we’ll end on Uber ($UBER). Just another example of how all these predictive tools work, but a nice example here of how you go into a downtrend, this neural index gets bullish and again lets you know of some subsequent strength over the market. Notice how this blue line gets even further away from the black line indicating that strengthening of the downtrend. Of course, we can bring up these very short-term levels in tray, and you see again predicted high and moves lower, predicted high moves lower. We move up to this previous predicted high, goes lower, goes lower, goes lower. Now we’re getting earnings coming in about next week. Really exciting opportunities, especially if you’re willing to hedge their portfolio, maybe buy some put options, get on the bearish side of things. Even if you just wanted to be on the bullish side, recognizing those areas where you can at least get a good entry, trail your stops, as we see volatility really entering into the marketplace. A really nice example of why it’s critically important to have these tools so you can identify where the strongest and potentially weakest opportunities are throughout the marketplace. Again, I encourage you to go back and watch many of those previous Hot Stocks Outlooks from the past several weeks, and you’ll notice a particular pattern here and a theme of highlighting where those strong markets are from the forecast but understanding that there is some broad weakness here that we’ve seen in Microsoft and certainly the broader SPY and Qs. I’ll go ahead and leave it there. Once again, this has been our Hot Stocks Outlook for August 2, 2024. Thank you all for watching, best of luck, and bye for now.