Register for a Free Live Training
The Hot Stocks Outlook uses VantagePoint’s market forecasts that are up to 87.4% accurate, demonstrating how traders can improve their timing and direction. In this week’s video, VantagePoint Software reviews forecasts for SPDR SPY($SPY), Hershey ($HSY), Lockheed Martin ($LMT), Crowdstrike ($CRWD), Microsoft ($MSFT), SNAP ($SNAP), Pilgrims Pride ($PPC), Tyson Foods ($TSN)
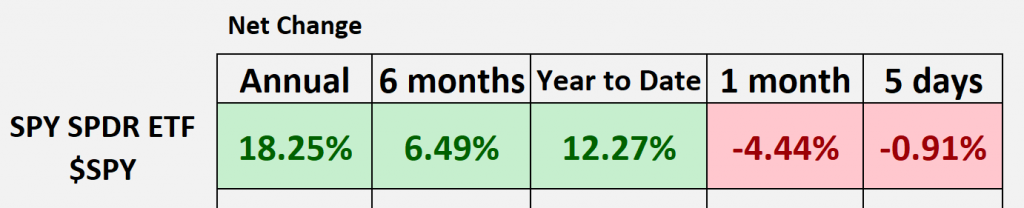
SPDR SPY ETF ($SPY)
Hello again, Traders, and welcome back to the Hot Stocks Outlook for August 9th, 2024! I hope you all have had an excellent week out there in the financial markets. As always, we’re going to take a look at the most recent VantagePoint predictive forecast. If you haven’t already, make sure you click on the link in the description below, where you can sign up for a live demonstration to really learn all the specifics about how these predictive tools can help traders make better trading decisions day-to-day in the marketplace.
So, what we’re going to do here is look at a little bit of an interesting couple of weeks that we’ve had. There’s been an extreme increase in volatility. When we look at something like the Qs, right, the broader tech stock space, we can see that we’ve been in a downtrend here. PowerShares QQQ ($QQQ) has pulled things down almost about 10% in the past 18 or 19 trading days. Now, typically, we look at this via the S&P 500, and so we can go ahead and do that as well. What we see here is that, on our year-to-date mark, we’re still up about 12%, but again, a huge amount of volatility has come in. Even over the past five trading days, we got that move lower on Friday and then a big gap down, right? So, we’re getting a gap down, filling a lot of that gap, and it’s just creating a huge amount of volatility in the marketplace. So, you want to be pretty careful when identifying new bullish trading opportunities, which are really few and far between.
Here you see with the Qs, the market continues to go lower.
But let’s use Hershey ($HSY) really as an example of how all of these predictive indicators work together. Whether we have a bullish market or a bearish market, it can help us identify those broader themes and then, on a day-to-day basis, help manage those opportunities, which is really the key here. When we look at a lot of the grocery store stocks, we have a couple of chicken companies, we’ve got Hershey here, and some of the spice companies are actually doing quite well, along with defense stocks and others like Lockheed Martin ($LMT). But that doesn’t give us a view of the broader market, and there are still things that are pretty mixed out there.
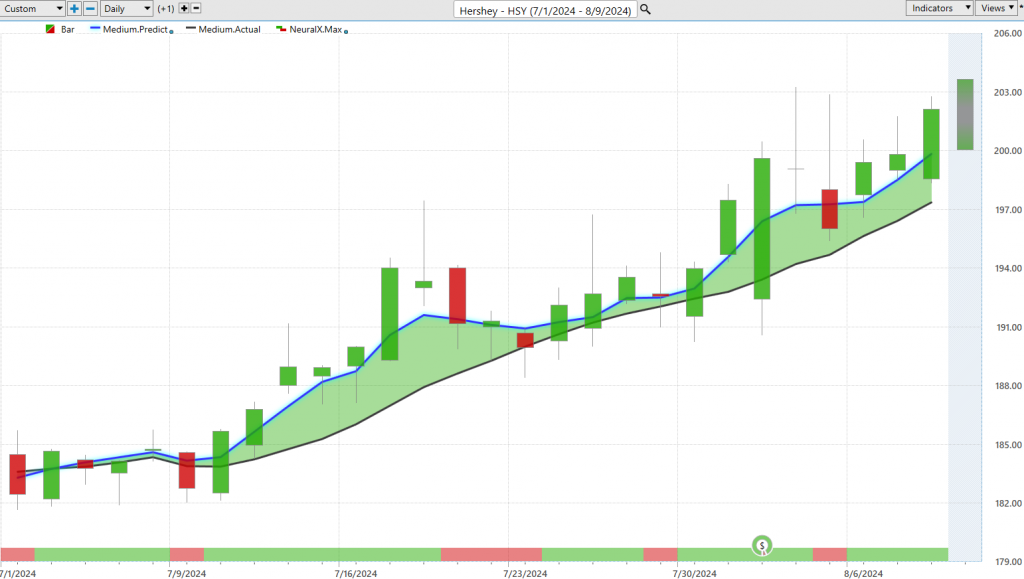
Here with Hershey is a really good example of how all of this works together with daily price action. So, each one of these candles that you see represents a full and complete trading day. Right up against all the price data, what you’ll first notice is there’s a black line and a blue line value there. Now, the black line value is actually a simple moving average, a very common technical analysis indicator. In this case, it’s a 10-period simple moving average, which just adds the 10 close prices together and then divides by that number, giving you a measure of where market prices have been. So, in this case, they act as a good baseline when we compare that to the VantagePoint proprietary predicted moving average.
For this blue line to get plotted on the chart and calculated for the trader every evening, this is where the technology of artificial neural networks comes into play. What they’re doing is performing what we would call intermarket analysis. Rather than just looking at past prices of Hershey—which is really what all technical analysis does, just reformulating recent close prices and doing the calculation—it’s all coming from the past and only from one single market, in this case, Hershey. What the technology here is able to do is look at other markets that are known to drive and influence the future price of Hershey and use that artificial intelligence to understand those relationships, whether they are bullish, bearish, inverse, leading, or lagging relationships, and it uses that to generate highly accurate predictive forecasts. So, that can be things like the broader market like the SPYs or the Qs, but it can also be important ETFs that wrap up groupings of stocks like the homebuilder ETF we looked at early last month, the defense ETFs, and this helps us understand again some of those broader themes in the market. We can look at that via the VantagePoint predictive forecast, but it’s also going to look at important markets like the Dollar Index, interest rates, or global commodities like gold, oil, wheat, grain, depending on the market in question. So, we’re using this really global approach and utilizing these highly accurate predictive indicators that are generated via the technology.
Here, when we look at Hershey, we can actually see that the blue line is above the black line. When we compare this to something like the Qs or the S&P 500, we can see that there’s certainly some more strength here. We’ve got about a 10% move up over the last 26 trading days. Now again, much bigger stock, it’s not going to move as aggressively, but let’s take a look at some of these shorter-term predictive indicators. First, we can look at this bottom bar that goes from green to red back to green. In addition to that overall trend that you’re provided via that predicted moving average, the neural index at the bottom here is warning you of short-term strength or weakness in the market. So again, when you bring in your trading style and time frame, we can understand, okay, well here we got the neural index went bearish, but you’ll notice that blue line is still above the black line. You get a little bit of a gap down, but immediately the market trades up, and all that momentum comes back into the market here. Again, you see the neural index goes bearish, and we get a subsequent couple of days of bearish price action, right where we actually move below that predicted moving average, but the overall trend remains higher. So, when we can take these short-term price clues and actually combine them with an intraday predicted high and low range, this is where traders can effectively adapt to the overall market. We can actually look at those predicted ranges against the actual trading day, right? So, traders can identify the overall trend, use the neural index in the short term to anticipate short-term strength or weakness, but also use these predicted ranges day-to-day to accumulate a position.
So, after many trading days—about four or five weeks—you get numerous opportunities where the market is responding to those levels, and even here where you have earnings, you see how the market just shoots down to that previous predicted low level and then continues the uptrend. As that volatility comes through, the indicators adapt and try to get in line with where things are headed next. You see the market moving up towards these predicted highs, and the overall trend remains up here in shares of Hershey.
Again, nice move here in Hershey, and we’re seeing that specifically in some of these, like grocery store stocks. But the bigger themes here are actually quite bearish.
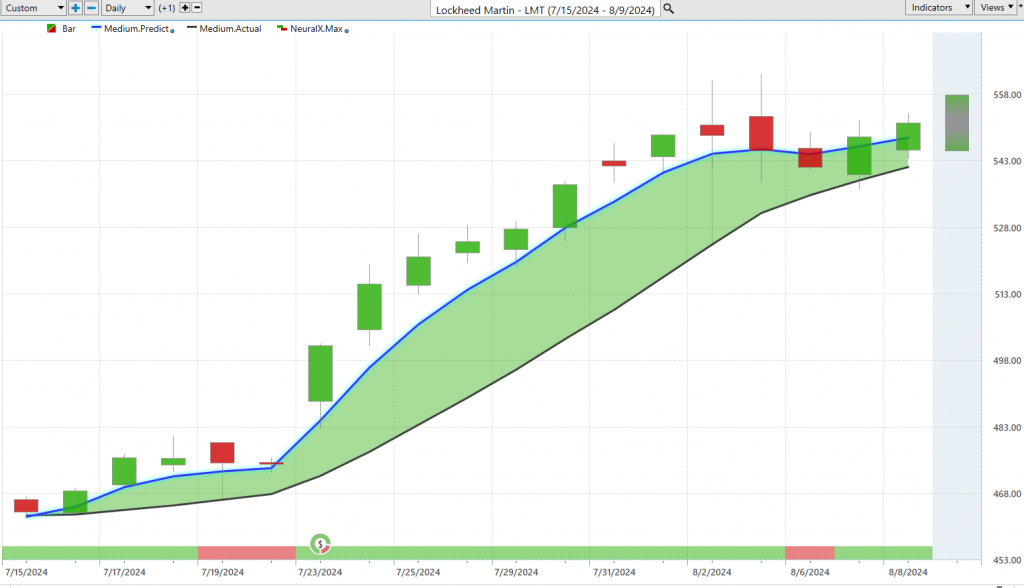
One more thing: we’ll take a look at Lockheed Martin ($LMT) on the bullish side. Lockheed Martin, right? We looked at a lot of those defense stocks, the defense ETFs. Here you see the most recent forecast still very bullish, with that blue line above the black line. Yet, there are a couple of areas here going into earnings where that neural index gets bearish, but the overall trend is still very much to the upside. Since we’ve gotten that forecast, the market’s up about 18, almost 19%, in just the past 18 trading days.
Just like that previous example, we can look at how effective these actual predicted high and low ranges are day-to-day moving forward. This is really the key—understanding how to use the software and really understanding how these things change day-to-day, so you can adjust your position size as you start seeing these updated forecasts roll through and identifying those areas of the market where there is strength and weakness.
Again, you see some nice levels down here towards these predicted lows as the market continues higher, with more of these predicted lows getting tapped, but the overall trend is moving higher here in shares of Lockheed Martin.
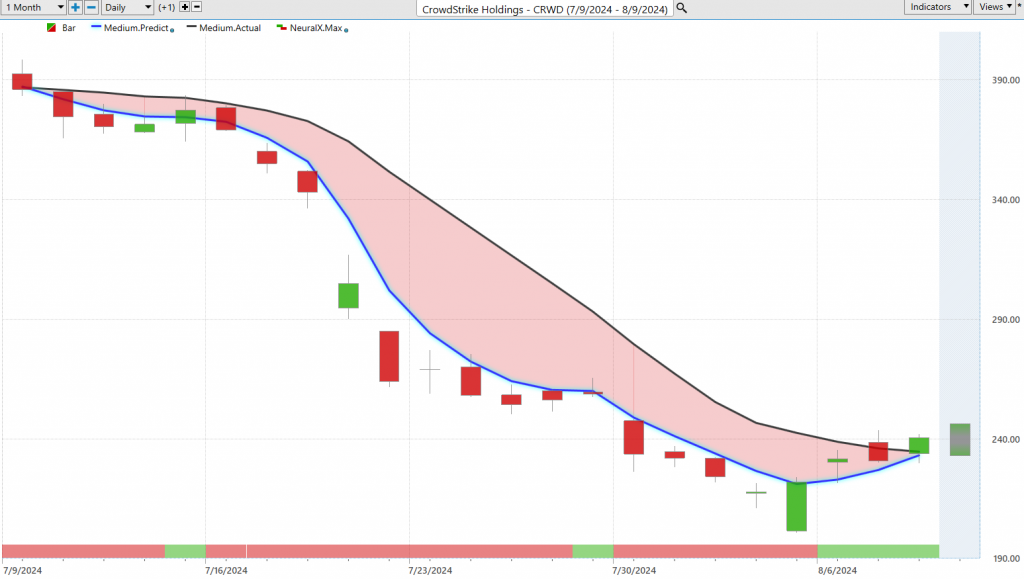
Now, this is again more of the tech space, and this is where CrowdStrike ($CRWD) comes in. You really need to be careful. We looked at this really as that news came out—I believe it was this gap here—but again, just seeing that overall weakness in CrowdStrike and also Microsoft ($MSFT). That’s, you know, evident via the Qs and the SPY and really sends a wake-up call that you really need to be careful around many of these tech stocks. Here we see CrowdStrike, where we get that blue line below the black line, neural index bearish, and again this week with all the volatility, what have we seen? The market gaps down and then starts to trade higher, but you don’t really have that confirmation here quite yet in shares of CrowdStrike and also not throughout the tech space. So, when we look at this overall move, we can see that now CrowdStrike is off 38% just in the past 22 trading days. Even with all that volatility, we can see how effective these predicted highs and lows are, right? Indicating that as the market moves lower, even if you wanted to short this market after the news had come out, you’re still getting an excellent entry intraday and then over the next couple of weeks as we see shares go lower still. So, really nice move there in CrowdStrike.
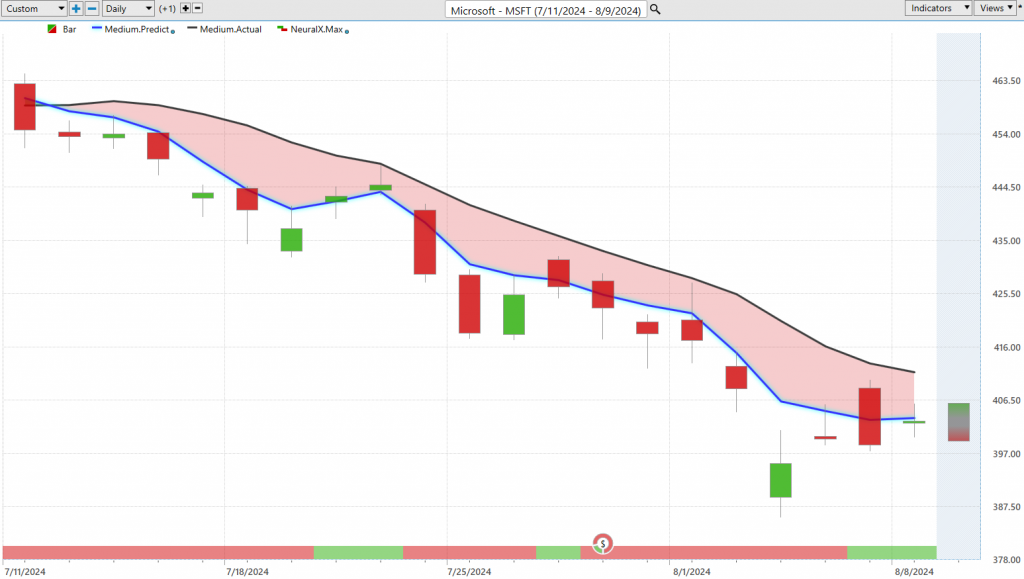
Again, we’ll quickly take a look here at Microsoft ($MSFT). I just want to hit on these bigger themes because obviously, the market has seen a ton of volatility, but also to show how to utilize the software day-to-day. When it comes to Microsoft specifically, what these intermarket relationships are identifying is all that weakness through the tech space, whether it be the Qs, Nvidia, or some of these individual stocks, and it’s really just driving everything lower. You see now Microsoft is off 12% here in the past 19 trading days.
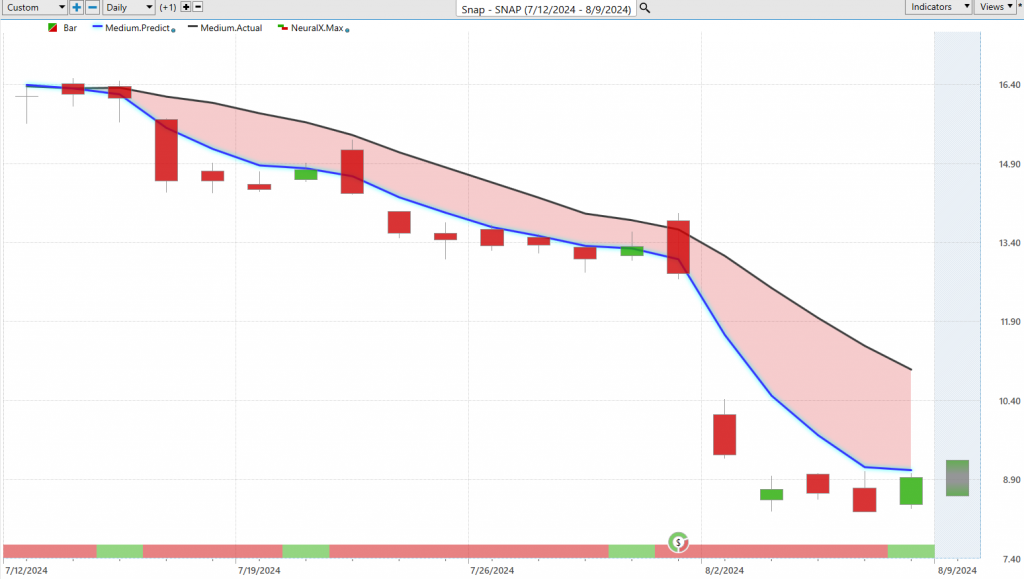
Traders can use fundamental analysis or find some of those stocks like Snap ($SNAP) that you especially look to be weak because the overall market’s weak, but also have potentially some weak market share and competition. Here’s Snap—a really great example of that. As we go through earnings, it’s really just driven down even more, and again we see this week just running sideways. So, even some of these weak stocks aren’t going lower just because of all the volatility and how aggressively we’ve gone lower here very, very quickly.
So, overall here, we can take a look at this move lower in shares of Snap, now off 46%, almost 47%, in 18 trading days. Of course, those predicted highs and lows are really helpful for traders, right? To understand where those levels are where you want to short and then look to take profit on your short positions. You see, even here as we go into earnings, we get a gap up and then immediately go lower in shares of Snap.
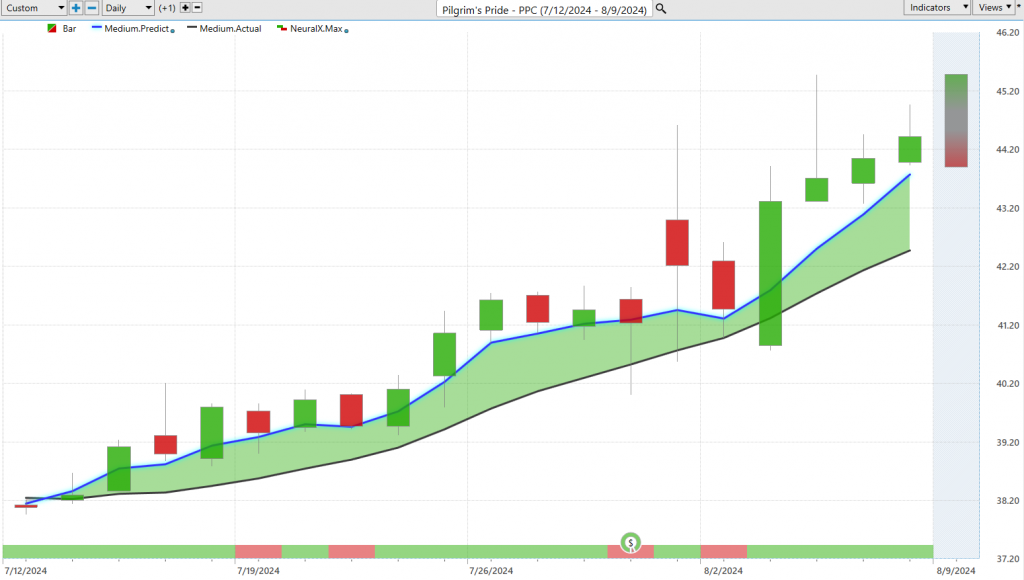
Lastly, I just wanted to bring in some bullish opportunities like Pilgrim’s Pride ($PPC). We come back to Pilgrim’s Pride, Tyson Foods ($TSN), and see that they are not showing at all, right? Those blue lines cross below the black line, so we can actually use VantagePoint’s IntelliScan to find where the uptrends in the market are and where there is strength. Then, of course, we have the benefit of these predicted highs and lows. Let’s take a look at Pilgrim’s Pride here. This has been going on for really over a month or about a month here in Pilgrim’s Pride, and look at each predicted high and low, right? Every day you’re provided with this updated forecast of what the overall trading range is likely to be. Here’s the most recent forecast: a predicted high and a predicted low. The actual market data will fill in this area, and we’ll, of course, see how accurate that prediction is. But this is where traders can adapt to the marketplace, and you see about four or five entries there in a bullish market, and we see shares start to accelerate still. So again, there aren’t too many areas of strength, but certainly when we’re doing that comparison, what’s a better place this week? As the market even goes lower and recovers, this market didn’t even go lower at all, right? It’s still in an uptrend, and as that recovery takes place, we actually see shares accelerate to the bullish side here, about a 16% increase in the past 19 trading days.
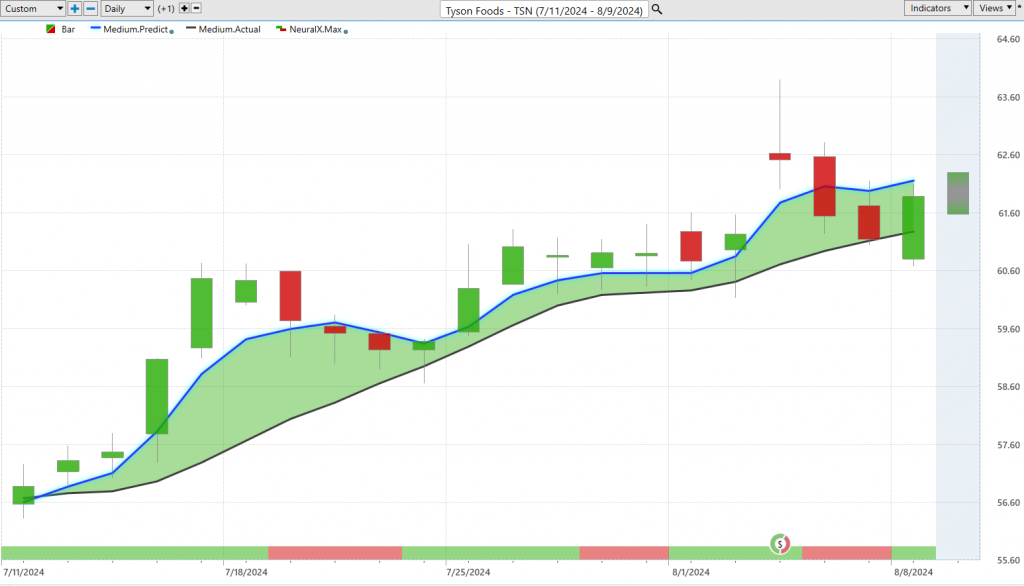
Lastly, Tyson is probably going to share some correlations with things like Pilgrim’s Pride. These are both chicken processing companies, and so a very similar sort of chart here. But that’s what helps us again understand what’s going on with the Qs, what’s going on with the defense space, what’s going on with these tech stocks going lower, and help get the portfolio positioned accordingly to make money or just avoid a lot of this weakness that we’ve seen in areas that had performed extremely well up until now. Here’s Tyson Foods again. We’ll get an overall sense of the move—about 8-9%—and you’ll see here this is a good example of the neural index, right? So, you get that neural index bearish, get that subsequent weakness, a little bit of sideways price action, more weakness and sideways, but very clearly, the overall trend is up here. Those predicted ranges, again, can be used to adjust and adapt in the position, right? Take some profits as the market moves forward. You see again how these levels, whether it’s the predicted high or the predicted low, do a pretty good job of letting you know where to accumulate a position, but also where to take some off and look for potentially some cheaper prices.
So, again, a really interesting week. Huge gap down recovery but still seeing some weakness spread throughout the marketplace, which is why you want to be real careful in picking any bullish opportunities, but also maybe holding on to some of those bearish opportunities in longer-term trends where we’ve seen the most weakness.
We’ll go ahead and leave it there. Once again, this has been our Hot Stocks Outlook for August 9, 2024. Thank you all for watching, best of luck, and bye for now.