


Register for a Free Live Training
The Hot Stocks Outlook uses VantagePoint’s market forecasts that are up to 87.4% accurate, demonstrating how traders can improve their timing and direction. In this week’s video, VantagePoint Software reviews forecasts for Intercontinental Exchange ($ICE), SPDR S&P Metals and Mining ETF ($XME), W.W. Grainger ($GWW), ADMA Biologics ($ADMA), Arrowhead Pharmaceuticals ($ARWR)
VantagePoint A.I. Hot Stocks Outlook for December 12, 2025
Hello again, traders, and welcome back to the Hot Stocks Outlook for December 12th, 2025. Hope you all have had an excellent week out there in the financial markets. And as always, we’re here to take a look at the most recent Vantage Point AI predictive forecast.
So, uh, if you haven’t already, be sure to go ahead and click the link down in the description below, and you can get yourself signed up for a live demonstration to learn all the specifics about how these predictive indicators and technologies are helping traders make much better trading decisions out in the marketplace.
Uh, now we’re going to have a bit of a, uh, review episode here. So, uh, last week we looked at, uh, Intercontinental Exchange. We’ll go ahead and start there. Uh, we’ve got the Metal and Minings ETF, which is, you know, a lot of bullishness, uh, seeing that in silver as well. W.W. Grainger was another market we brought through. Uh, ADMA Biologics we brought through a couple of weeks ago. And then we’ll end here on Arrowhead Pharmaceuticals.
This is a really great example of how all of these predictive indicators and tools work together. Uh, and once you understand one forecast, we can take that information and knowledge and utilize that on really any market, uh, within the stocks and ETF arena here.
Intercontinental Exchange ($ICE)
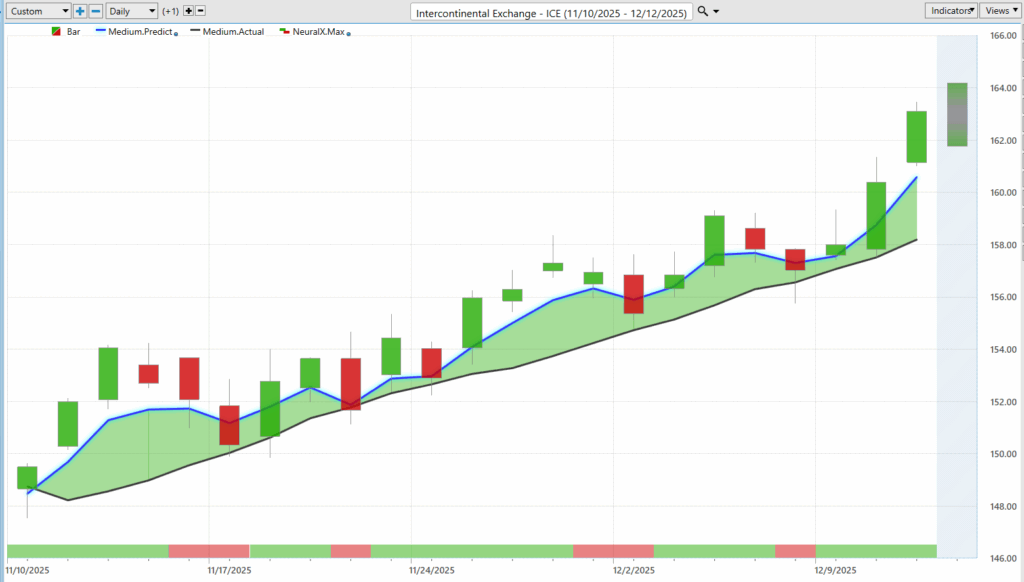
Intercontinental Exchange, what we have here is daily bars and candles. So each one of the candles on the chart, well, that will always represent a full and complete trading day. And it’s right up against those daily bars and candles where Vantage Point produces this black line and also blue line value.
And so the black line that you’re seeing there is a simple moving average. So this is a very common technical analysis indicator, probably the most basic, uh, indicator that you could create. And what this does is act as a baseline for Vantage Point traders.
So, in this case, and, uh, like it is every week, we’re looking at a 10-period simple moving average. So keeping this very simple, but the issue with traditional technical analysis like this is that all the data just comes from the past, and it only comes from one market in question.
And so we use that as the baseline to let us know where market prices have been. But what Vantage Point traders can do is actually compare that value to this proprietary predicted moving average.
And so for this number, which is essentially a price that’s going to get calculated and plotted on the chart every evening, well, this is where the technology of artificial neural networks and artificial intelligence comes into play. And it’s performing what we would call intermarket analysis.
And so what that means is that rather than just looking at past prices of a single market and really just reconfiguring what’s already occurred, Vantage Point tools are looking at other known markets that drive and influence future price and utilizing that data to extract some valuable price clues.
So this can be things like other individual stocks. This can certainly be ETF groups within the sector. This can also be markets that seem very counterintuitive, but the software and technology has determined there’s a significant relationship there, uh, and to utilize that within the overall forecast.
And so this goes all the way down the line, really quite globally, looking at global currencies, interest rates, uh, and even global commodities where applicable—gold, oil, uh, agricultural commodities.
And so it takes this approach of looking at dozens of known markets, extracting that data, and then producing highly accurate predictions on where price is headed next.
And so when it comes down to this blue line and black line value, we have a lot of tools within Vantage Point, most notably the IntelliScan here, that can help us identify right when those fresh crossovers are happening. We’re getting a trend shift in the market.
And so when we look here at Intercontinental Exchange, we can see that last week we were kind of commenting on, hey, this, you know, market has just reversed coming off of those lows. We’re seeing some of these markets pick up.
And so we see ICE picking up another about 3% or 4% just on the week here, now about 8.5% since that predicted moving average crossed above the actual moving average.
But what gets really exciting about this is that there’s other tools here that are tuned to solve different problems. Uh, most notably here at the very bottom of the chart, you see this bar that, as we work forward through time, and this gets updated at the end of every single trading day on this end-of-day data, you know, we may move down to a red configuration or to a blue.
Well, this is what’s called the predicted neural index, and it’s solving for short-term strength or weakness over the next 48 hours. And this has an extremely high level of accuracy, upwards of 86%, uh, on an extremely wide range of markets.
And so we can understand, okay, what is the overall trend, and are we likely to see some short-term weakness or sideways price action over the next 48 hours?
Uh, and so you see here, as we get this blue line crossing above the black line, neural index up, see that momentum in the market. Uh, we get a neural index here, we get a couple days of weakness. Neural index here, a couple days of sideways price action. Neural index bearish here, a gap down the next trading day.
But over the entire course of that, the blue line remains very solidly above the black line.
And so lastly, we really bring in the predicted highs and predicted lows. And so now we’re down to intraday predictions generated via the technology. This is where things get really exciting, as we can look back at how accurate all of those predictions are against the actual market data.
So when we look back at this, this would have been Friday last week. Well, what happened? The market moved right down towards the Vantage Point predicted low.
Uh, the next trading day, it was forecasting, expect the range to come a little bit lower here. And we see we get a little bit of a down day, see the market closing right above that predicted low, and then this strength comes into the overall trend.
Uh, and so when we look at this move really just from last Friday’s predicted low, shares up about 3.6%, going into the end of the week here on Friday.
SPDR S&P Metals and Mining ETF ($XME)
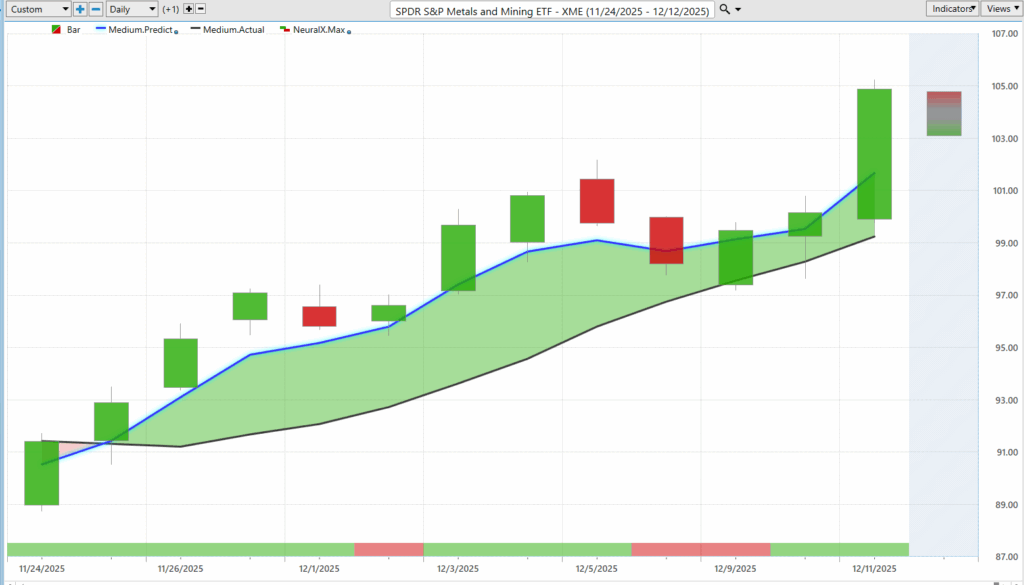
Uh, we also took a look at XME, SPDR S&P Metals and Mining ETF, and this is really driven by silver prices.
Uh, and here we see this blue line crossing above the black line. Neural index very bullish through the duration here. Now we did get, uh, you know, here’s one day where it would be inaccurate, but you see how quickly it gets bullish once again.
You get one day here with, again, a couple of sideways, uh, days where the price action remains, uh, really depressed from those previous close prices. But look at all this separation. I mean, this is saying, look, this is a very strong trend.
If you get any of that weakness, it would highlight, hey, this is a buying opportunity. Use that short-term weakness, uh, to be a buyer in the market.
And again, we can bring in those predicted highs and lows and take a look at how this works. So again, if we go back to, I guess this would have been Friday, here’s Monday telling Tuesday, hey, expect the range to be lower. Wednesday, hey, here we’re coming back in and we’re seeing some strength.
And sure enough, uh, Wednesday hitting that predicted low and then seeing a very large rally, uh, breaking higher yesterday here, what would have been on Thursday.
So that’s about a 7% move here just in the past couple of trading days, very clearly an area identified as, hey, this is a strong uptrend.
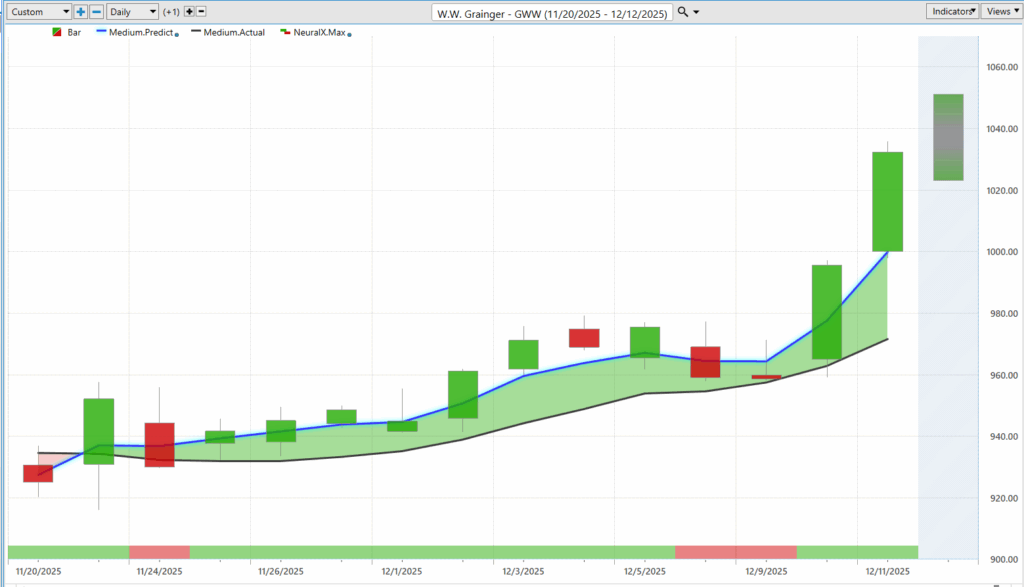
Um, here’s W.W. Grainger. Grainger, another opportunity from last week, and again, just seeing all of this strength as these trends really start to pick up.
Uh, blue line over black line. You see our neural index letting you know, expect some sideways price action over the next 48 hours.
Uh, but again, those predicted highs and lows really doing their job here. Uh, and so we see this would have actually been Monday, you know, hey, expect the range to come a little bit lower. And you see, as that range starts to actually move higher.
Uh, and remember, all these predictions here are known before the next trading day occurs.
So even after this, uh, trading day here where we kind of have a nothing day for the most part, that predicted low is getting higher and then aggressively letting you know, hey, this momentum is coming in, neural index is bullish, uh, and the overall trend resumes here.
So really nice move over the past couple of days in Grainger, uh, just the past couple days up 7%, uh, from these previous early predicted lows, about 10.5% now.
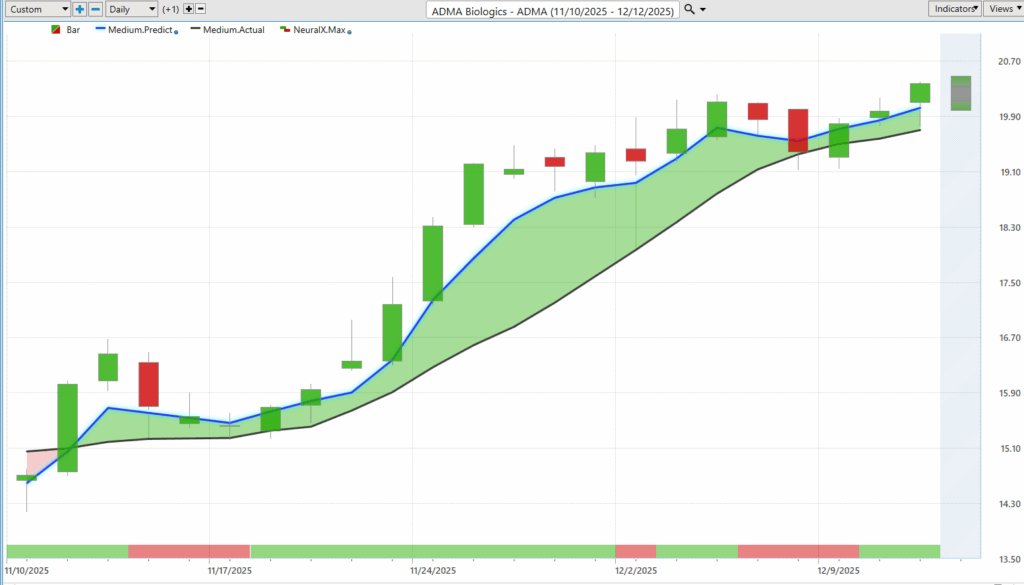
Uh, now two weeks ago we brought through ADMA Biologics. ADMA, uh, identifying some of the strength in the biotech space.
And so very clearly here, strong crossover of that blue line over the black line. A lot of separation there. And again, we see what happens. Neural index gets bearish. We get these sideways days, not a lot going on with the intraday price action.
Again here, we see things a little bit subdued for a bit here, but the overall trend remaining bullish.
And then when you have these things on the radar, well, we have these tools that are going to say, “Hey, where do we want to be a buyer in this market?” Well, ideally down at these Vantage Point predicted lows here.
Again, you see, uh, what would have been actually Monday this week, moving down towards those predicted lows, also last Friday, and then seeing the market break out again towards the upside.
Uh, so as we look at this overall move, you know, now we’re looking at about a, you know, 29% rally here in just the past 20 trading days.
Arrowhead Pharmaceuticals ($ARWR)
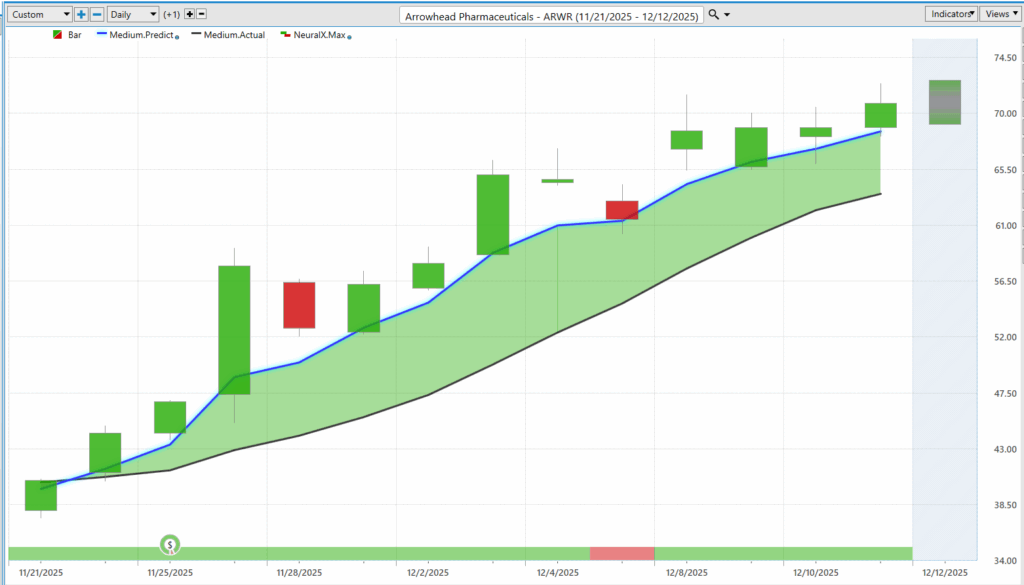
And so, to go along with a lot of these biotech stocks starting to pick up, here’s Arrowhead Pharmaceuticals, which we actually looked at probably a month or two ago. This thing’s really been on a huge tear.
And so once again, we see going into earnings, that blue line getting above the black line, neural index very, very bullish here.
You see, even with this neural index going bearish, you get a gap-up market, sort of trading sideways for a couple of days, and, you know, then things really picking up as that neural index very quickly gets back to bullish.
We see some bullish price action and a ton of separation here between that predicted moving average and the actual moving average.
Uh, and of course, then we can really hone in with the predicted highs and lows. And so you see here, getting through earnings, moving right down to that predicted low, next day’s predicted low.
Software does a really good job adapting to the present volatility, right? So when we get those earnings reports, you’re going to get really the range starting to expand.
And Vantage Point automatically is going to say, “Okay, well, expect the range to expand here. Make sure your stops aren’t in an inappropriate location.”
Uh, moving down to the predicted low last Friday, and then, uh, really all through this week, just bouncing off of that predicted low before moving up to that upper part of the predicted range.
So really nice move here in Arrowhead. Uh, like I mentioned, this thing’s just been on an absolute tear, uh, and now up another 71% just the past 13 trading days.
So, uh, we’ll go ahead and leave it there for today. But once again, this has been the Hot Stocks Outlook for December 12th, 2025.
Thank you all for watching. Best of luck out there, and bye for now.


