


Register for a Free Live Training
The Hot Stocks Outlook uses VantagePoint’s market forecasts that are up to 87.4% accurate, demonstrating how traders can improve their timing and direction. In this week’s video, VantagePoint Software reviews forecasts for SPDR SPY($SPY), L3 Harris Technologies ($LHX), Royal Caribbean ($RCL). Caterpillar ($CAT), Freeport McMoran Copper and Gold ($FCX), Century Aluminum ($CENX), Eastman Chemical ($EMN)
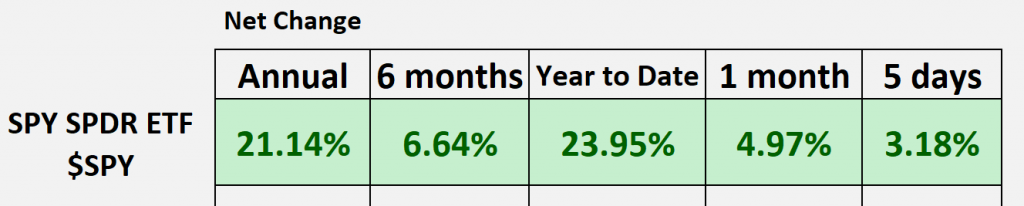
SPDR SPY ETF ($SPY)
Hello again, Traders, and welcome back to the Hot Stocks Outlook for December 15th, 2023. Hope you all have had an excellent week out there in the financial markets. As always, we’ve got plenty to cover here in this week’s Outlook, and if you haven’t already, make sure you go ahead and click on that link in the description below so you can get yourself a live demonstration and learn all the specifics about how this predictive Technology based on artificial intelligence and neural networks can help you make much better trading decisions in the marketplace.
So what I want to do is we start out here with SPDR SPY ETF ($SPY), the Spy ETF we can see really since those forecasts came through at the beginning of November, we’ve had quite the move. But more recently, what we’ve seen from the Vantage Point predictive forecast (and we’ll go over all of this in detail) is the overall trend is up, our short-term, you know, two-day predicted neural index has remained bullish, and our predicted high and low ranges are just moving higher each and every day, letting you know that this is a very strong bullish market. So this whole past week, there’s been nothing but a very, very strong bullish signal from the spy and the S&P 500 indices.
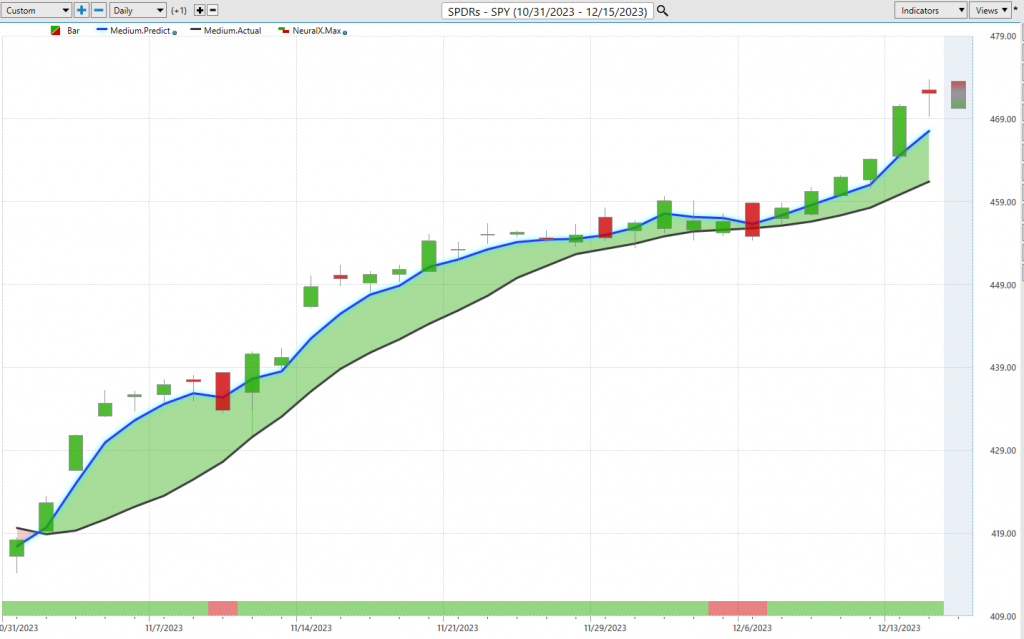
L3 Harris Technologies ($LHX),
Now when we look at individual stocks though, we can get a little bit more L3 Harris Technologies ($LHX) volatility, a little bit more of a mixed picture, and this is where this technology comes in and helps Traders be much more efficient here, right? So let’s go through all of it here with this example in L3 Harris right. So what we have here with L3 is daily price action, right? Each one of these candles is representing a full and complete trading day, and right up against all that price data, you’ll see that there’s a black line and a blue line value. Now, the black line that you see there, well, that is a simple moving average, a very common technical indicator. In this case, it’s a 10-period simple moving average, and what we understand about traditional technical analysis, which this would certainly qualify as, is all that information that creates that value is lagging, right? It comes from the past. We wait for those closes to come in, you just add all the values together and divide by 10, and so it helps to smooth out the price action, right? Let us know where market prices have already been. But obviously, Traders want to know where are prices moving next, next? And so what we’re able to do is compare that black line value (you can think that as a price value) and compare that to this proprietary predicted moving average. And for that number to get plotted and calculated on the chart, well, this is where Vantage Points Technology of artificial neural networks come into play, and this is really important, especially right now, we got big moves in dollar, big moves in certain Commodities, and what it’s doing is looking at other markets that are known to drive and influence that specific Market that you’re trading L3 Harris. Now this can be big things like the S&P 500 or the dollar Index, this can be smaller things like individual stocks, maybe some, you know, stocks within the defense sector, maybe this is groups of ETFs, and this goes all the way down to, you know, Commodities like gold, silver, copper, wheat, you know, depending on maybe you’re an agricultural stock. But it looks at really dozens of markets that are known to drive and influence the future price of this asset and it uses that information to generate highly accurate predictions. So whenever we see that blue line cross above the black line, it’s essentially telling us average prices are expected to move higher. And where this is really helpful is when you have a tool like this, especially, um, with Vantage points intelliscan, it’s able to scan through just thousands of opportunities to find the absolute best looking situation. Well, what do we see all through November is tons of stocks turning up, all these signals that say look, this is the time to go ahead and get involved, and we’ve seen a lot of markets do really well, about a 177% rally there in shares of L3 Harris. But depending on your trading style, you may want to rely on longer-term or shorter-term indicators, and this is where we get to things like our predicted neural Index. This is a highly accurate 48-hour indicator. It’s only looking ahead two days at a time and predicting short-term strength or weakness in the market. And what you’ll notice here as we go through these subsequent charts is that look, the overall trend is up, but certainly there will be periods of weakness, especially only spanning 48 hours in an existing uptrend. And so you have that information that says look, look for weakness here, look for cheaper prices, maybe utilize Vantage Point’s other, you know, short-term levels like the predicted lows to get involved over that time period. Again, here you see a little blip and sideways price action, sideways price action, sideways, and, you know, a little bit of down, but the point being is the overall trend is up, and all those weakened signals are just telling you look, in the next couple of days, if you scoop up some shares, you can get a good price but also get those updated forecasts from Vantage Point to potentially adjust the position and do what you need to do. Uh, so you see here as this Market starts to move, you see these excellent entries at the early part of the move. I mean, just, we’re probably going to get about a dozen entries here over the past month where the market has just continued to go higher. Uh, really within 48 Hours of Meeting those predicted low levels. And so if you’re dealing with volatility, you know, there’s certainly some tools for that as well. It’ll help you manage these opportunities and also accumulate a position so you can make a lot more money than, you know, maybe the original, you know, 100 shares or 200 shares, maybe able to build a large position with a small amount of risk because you’re using profits to do that, which is very important.
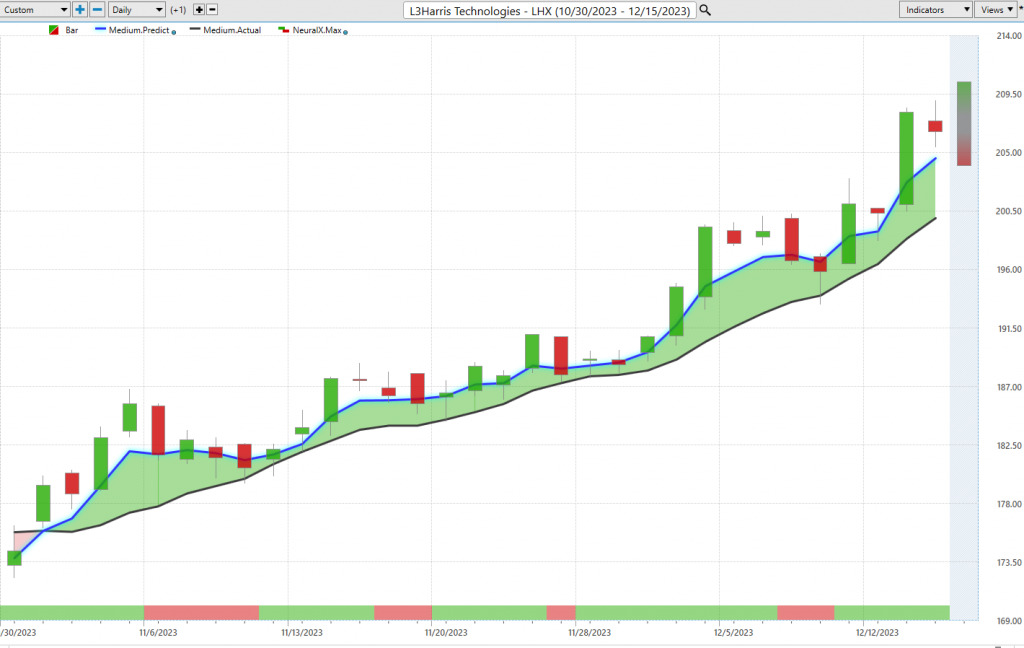
Um, here’s Royal Caribbean, we looked at this a couple of weeks ago, and I just wanted to update. Well, what’s been the forecast for the last couple of weeks since straight up, I mean, no weakness here, the neural index is bullish, the overall trend in the distance between that predicted moving average and the actual moving average remains strong, and there’s a distance there, and then we’ve got the help of the predicted highs and lows. And so you get these excellent entries to add to your position early on. And then when you come into a week like this, maybe you want to be adding more, taking some profit at the predicted high and taking more money out of this opportunity. So really nice situation there in Royal Caribbean. What’s funny was, you know, this was a weak stock in the summer, I mean, this thing got absolutely killed, that was actually shortened some of it. But, you know, now we’ve got a huge reversal here, right? A 44% move. And of course, that’s coming off the declines, right? Is where we see those big advances in the share price and a really nice opportunity there in Royal Caribbean.
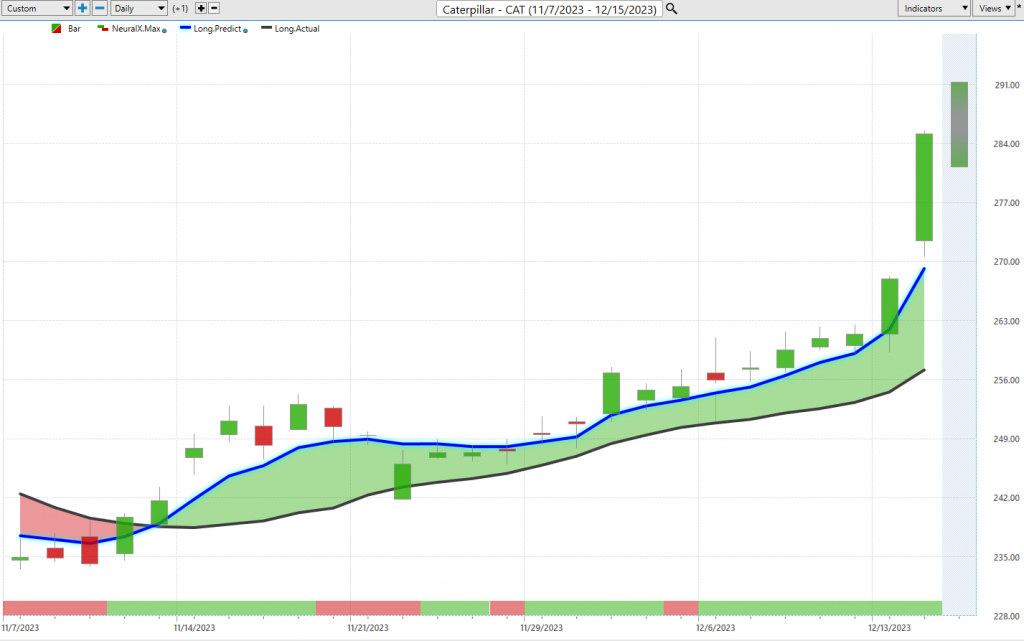
Uh, here’s Caterpillar, a little Caterpillar ($CAT) bit more recently, things, uh, ramping up here, but you see this Blue Line crossing above the black line. Now neural index goes bearish here, and you see a little couple of days of nothing but look how quickly over those days the neural index is getting bullish and saying expect subsequent strength. So the trader can say, okay, well, we’ve got strength in here, we’ve got Caterpillar, where do I want to actually buy the market? And you see if you actually have limit orders waiting at these levels, what’s actually going to happen is you get filled at the open and start the advance, maybe buy some more here, buy some more here, and we get that explosion and, uh, um, you know, really exciting moves, you know, happening all over the market after FOMC. It was like this release valve came off and everything went to where it was planning to go here, right? So about a 13 was 14% rally in 11 trading days, really important opportunities to identify, you know, where those higher magnitude moves are where there’s a lot of distance and a lot of strong uh, signals coming from those predictive indicators. Now a lot of this stuff started in November, you know, we look at the Spy cont or ETF there, you know, or the the Futures if you like, um, you know, we look at L3 Harris, we look at Royal Caribbean, it’s all this move in November.
Freeport McMoran Copper and Gold ($FCX)
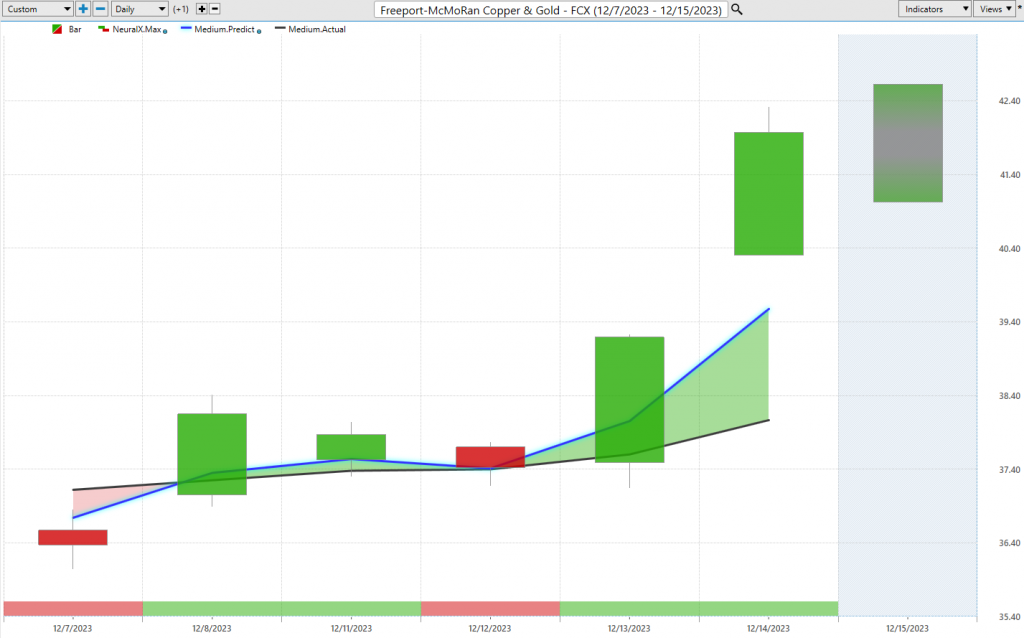
So we’ve got a lot of stocks that really match that chart, but this is why this is so important is sometimes these intermarket relationships can start driving new situations and and open up some new opportunities in the marketplace. So here’s Freeport, uh, Copper and Gold here. Well, what have we seen out of the copper market and also what I think’s been interesting is the Platinum Market. Well, certainly these are going to be more important for a market like you know, a mining company than some of these other stocks that we looked at, but this is also going to be heavily driven by things like the dollar Index and what the S&P and what some of those ETF groups are doing. So what you have to understand is it’s looking at really dozens of markets that are known to again specifically affect this Mining stock heavily driven by metal prices, aluminum prices, the dollar value of the dollar Index and so that’s what’s going into account and skewing all these indicators to be bullish. Uh, and so we see we get that Blue Line crossing above the black line, we look at these predicted highs and lows and you see again you just get these excellent levels to say okay, if you want to accumulate a position do it down here and really benefit as we see that market move higher and just all across the metal space, um, you know, Platinum was up 5%, Gold’s up 2 and a half%, copper three, you know, everything really started to move, um, and this is going to be something that’s, you know, not so much correlated to that S&P 500 that started moving in November and has wrapped up a lot of socks.
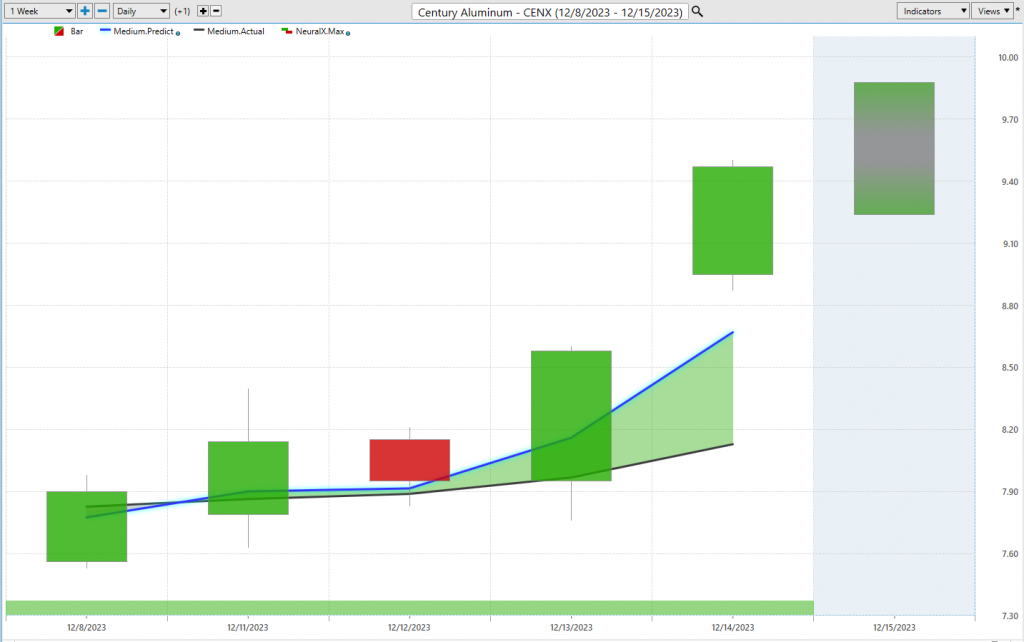
Uh, here’s Century Aluminum ($CENX), so again when you have tools like Vantage points intelliscan what it’s going to do is indicate to you is where these fresh predictive crossovers are occurring and we can sort this by sector and group and see exactly hey where are all these stocks turning up well here it’s in the metals well last September it was just the broad market and a bunch of individual stocks uh along with that S&P 500 uh and so you see here just a really nice move and something may be going on here not in the metals but even or in the metals but also even energies we’ve seen a lot of things really start to pick up so you see about a 20% rally in just the past four 4 days in Century aluminum uh again a lot of stocks in this area that did really well over the past week.
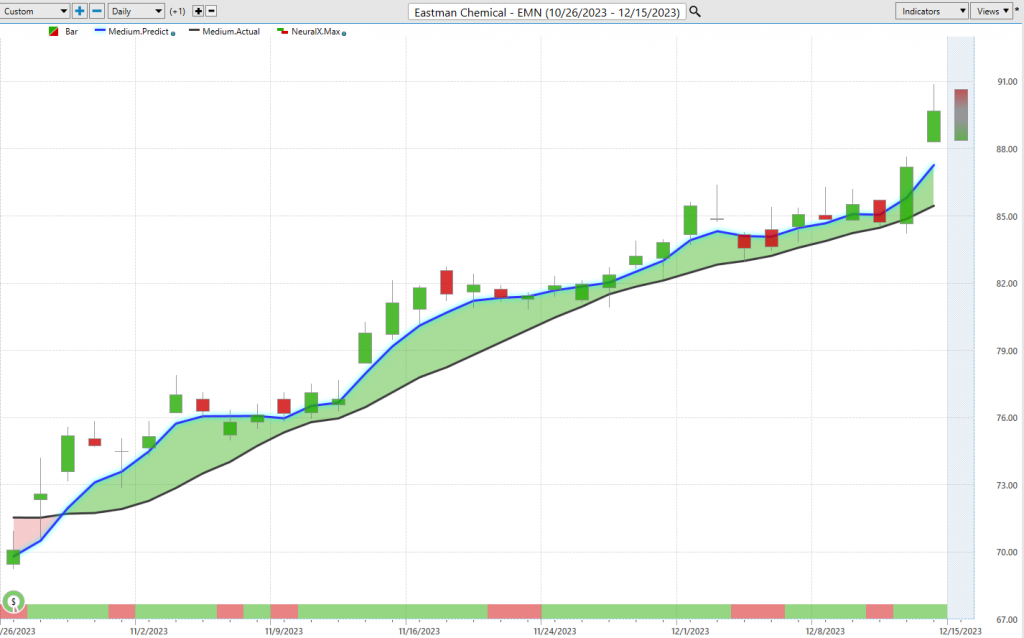
Here’s Eastman Chemical which Eastman Chemical ($EMN) I think is interesting because it turned up in November with the rest of the market and now we’ve got a lot of these basic material stocks oil starting to turn up uh you know these things can do really really well uh but we’ve seen that since November well we’ve had some really great forecasts that say okay well if you want to be involved specifically in Eastman where do you want to be accumulating a position on a day-to-day basis and so what’s happening is every single day these predicted high and low levels are updated and so what’s going to happen is we’ll get the actual trading day will fill in but the predictions won’t change and we’ll see how accurate all those levels are and this is why what we do is go back and say okay well if we knew that hey it’s time to be long via you know the SPI or an individual stock well what do we want to be doing well we want to be buying and where do we want to be buying well ideally at these predictive levels is going to be quite advantageous uh so again you know there’s a lot lot of correlation in these markets and this is why it’s especially important to have a tool like VantagePoint because when those correlations start to break down or dollar starts to shift or you know the metals or gold start moving higher or maybe the banking stocks go low or whatever it happens to be it it it ripples through the entire Marketplace and what you want to do is have a tool that’s helping you find the really strongest places uh to go ahead and set up shop right and get exposure to really all this bullishness that we’ve seen in the equity space uh and so you’ve got plenty of opportunity from November to accumulate a position Trail stops and you know potentially make a lot of money here so we’ll go ahead and leave it there once again this has been our hot stocks outlook for December 15th 2023 it’s a great time to go ahead and get ready for the new trading year so like I said if you haven’t already make sure you go ahead and click on that link in the description below get your live demo and really get set up for Success going into 2024 with the right tools and right information so have a great rest of your weekend thanks again and bye for now.

