


Register for a Free Live Training
The Hot Stocks Outlook uses VantagePoint’s market forecasts that are up to 87.4% accurate, demonstrating how traders can improve their timing and direction. In this week’s video, VantagePoint Software reviews forecasts for SPDR SPY($SPY), Kraft-Heinz($KHC), Boeing ($BA). Fastenal ($FAST), FMC ($FMC), Century Aluminum ($CENX), ROKU ($ROKU), Occidental Petroleum ($OXY),
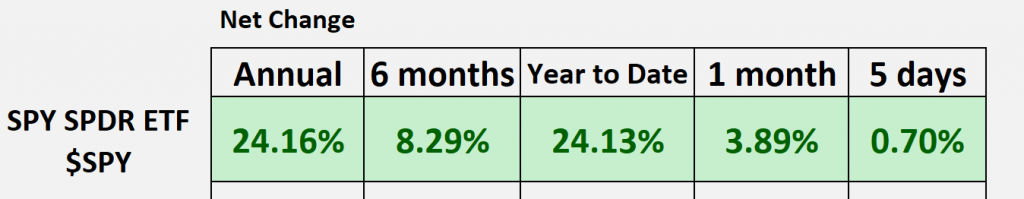
SPDR SPY ETF ($SPY)
Hello again, Traders, and welcome back to the Hot Stocks Outlook for December 22nd, 2023. I hope you all are having a nice week out there in the financial markets, going into the holiday, really end of the year time of the year. So it’s a great time to really get a live demonstration if you haven’t already. Make sure you click on that link in the description below, get the right tools to get you set up for success going into the next trading year.
Now, as we typically do, we can take a look at the SP500 ETF, the SPY, and we can see, we look at our annual and year-to-date numbers, they’re getting very similar because, well, naturally we’re about 12 months moving into a new holiday or New Year here. They’re about 24% now. We’ve had a pretty decent move over the last month, and the last few days have been a little bit sideways with some volatility coming in the market. But this is why it’s important to identify those really nice trading opportunities where those Vantage Point forecasts are quite bullish and make sure you’re not in things that are likely to move lower.
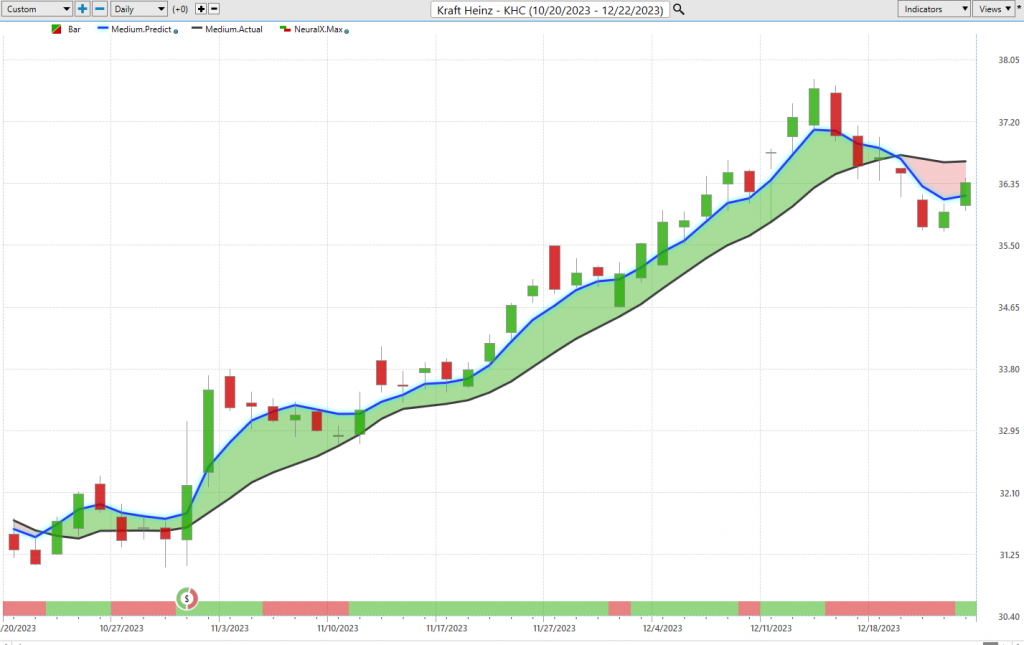
So, I thought this example in Kraft Heinz ($KHC) is actually a good place to go ahead and start here, explaining how all of these predictive indicators work together, whether it’s your predicted moving average, neural index, or predicted highs and lows. So, what you see here is daily price action. Each one of those candles is representing a full and complete trading day, and it’s right up against the price data where we’re going to spend a little bit of time here and focus on this black line and blue line value.
Now, the black line that you’re seeing on the chart there, that is a simple moving average or what we refer to as the actual simple moving average. That’s a very common technical indicator. It just looks back, in this case, at the previous 10 closes. It’ll add those all together and divide by 10. Whether you’re using a standard moving average or an exponential moving average, the problem with those tools is that all of the data comes from the past, and so it’s always going to be just reconstructing what’s already occurred and therefore lagging. So, what we want to do is anticipate what’s coming next, and this is where Vantage Point’s predictive indicators come into play.
Utilizing this Vantage Point predicted moving average via this blue line value on the chart. Now, whenever that blue line value is essentially a price prediction, in this case, moves above the black line, well, it’s suggesting average prices are going to start moving higher, and we, therefore, might want to take a long position depending on our strategies.
Now, we can see here that as that blue line remains above the black line, you get a really nice rally here in shares of Kraft Heinz. Now, this is a consumer staple stock, so it’s not going to move as much as some other things in the market. We see about a 16% rally over the last 40 trading days before this blue line descends below the black line. But this is the beauty of Vantage Point, is this is really a suite of predictive indicators. We have the Vantage Point neural index at the bottom here, and a predicted high and low range provided each and every trading day.
But what’s important to understand is what’s going on, how are all of these levels and predictions generated? Well, that’s where Vantage Point’s artificial intelligence technology of artificial neural networks comes into play. They’re going to perform what we’d call intermarket analysis. So, specifically for Kraft Heinz, there are known markets that will drive and influence future price. These may be competing relationships, these may be correlated situations in the marketplace. But it’s vital to take a look at, hey, what’s going on in the S&P and how does it affect Kraft Heinz? What’s going on in the value of the dollar index, which sort of has a rippling effect through the indices and therefore stocks? You know, what’s going on in the consumer staple ETF space or all those individual stocks or potentially bigger commodity markets?
And so, it’s taking this global approach, looking at all these competing relationships and using the price clues derived to V these intermarkets to generate highly accurate price predictions. And it’s those price predictions that are used to create these predictive indicators, rather than just using tools that are reconstructing the past.
And so, you see here that blue line over the black line suggests that the overall trend is up. But this neural index here is a 48-hour indicator, and so what it often warns you of is short-term weakness within an existing trend. And we see how it often warns of that subsequent weakness over the price action over the next couple of days once the neural index gets bullish, that momentum heats up, and traders can be prepared for that as well.
Lastly, you know, we’re given that predicted high and low range, and this is really where it all comes together for the trader. Getting that updated predicted high and predicted low range values to then make trading decisions. So, you can understand, hey, if you’re going to accumulate a position, try adding in down at these levels in the market as the market moves higher and volatility comes in. Well, the software does a good job adapting and saying, okay, well, now these are the new levels to accumulate a position.
You see here just chart after day after day after day, nice entries coming through and some good opportunities to take pieces out of the market. But then what do you recognize as we start to see this shift? Neural index remains bearish, these predicted high and low ranges are moving lower, letting you know, look, expect the price range to move lower. And this is how these predictive forecasts help traders make much better trading decisions and improve their timing and efficiency in the marketplace.
So here in Kraft Heinz, about a 16% rally.
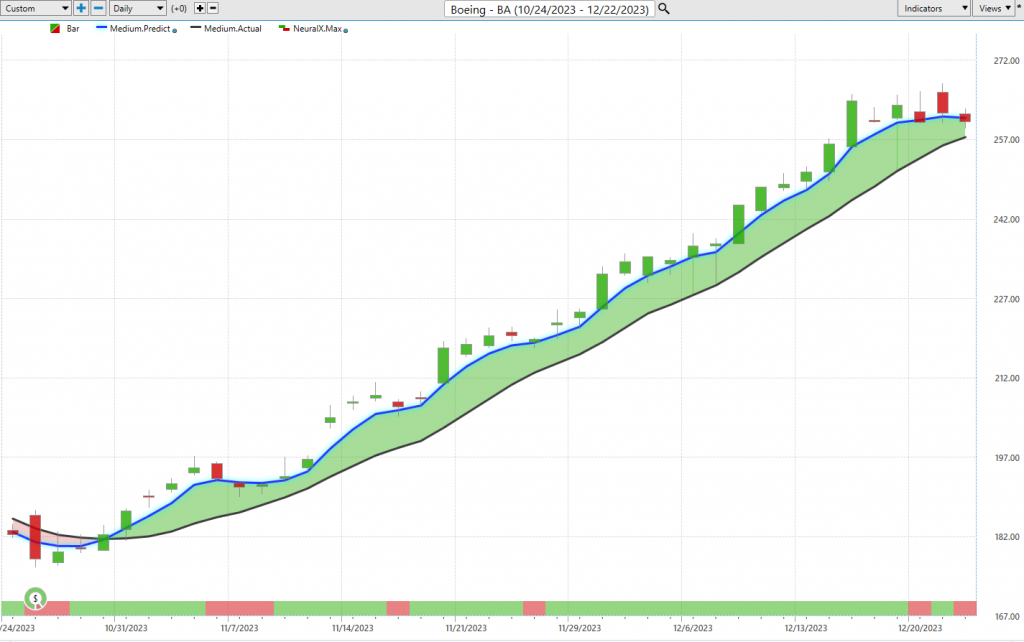
Here are shares of Boeing, so a lot of attention. We’ve seen a really nice rally out of shares coming into really November here. We see here we see that blue line crossing above the black line, a couple of periods where the neural index gets bullish. But this is why this has such a high level of accuracy associated with the neural index, is really, despite this market, we could look at, you know, countless other futures markets, individual stocks, you’re still going to maintain this very high level of accuracy associated with that indicator in addition to our other predictive indicators like the predicted moving averages that help identify trend shifts early and like the predicted highs and lows, which are really doing that really important adapting each and every day to help you jockey for position and make the most of these trading opportunities.
So here in Boeing, as we see this 42% rally, look at all these opportunities where the market slips down to the predicted low, and within 48 hours is moving up to new highs. And you’ll notice again, we get very little weakness out of that neural index in this particular stock, Boeing, with that 42% rally.
Now, another market that we looked at very recently was Century Aluminum, because the Vantage Point predictive forecast in platinum and gold and some of these other markets are very, very bullish, along with these mining and basic material stocks. So here with Century Aluminum, we see that blue line above the black line, neural index bullish, and no weakness out of the neural index at all. So this past week, well, what’s occurred is we’ve gotten a really monster rally here, since the last hot stocks outlook, about a 27% rally here over the past five trading days. But again, recognizing that hey, there’s been an important shift in the metal and mining space, start accumulating a position at these levels and benefit as Century Aluminum is now up, really about 40% to 45% since we started seeing many of those reversals, about 55% at the current close. So, really nice opportunity there, but very similar to Boeing, you want to recognize okay, where did that shift come in, and is that neural index in these tools still bullish? And now you can use profits to accumulate a position and stay ahead of the market, essentially trade with the house’s money here, right?
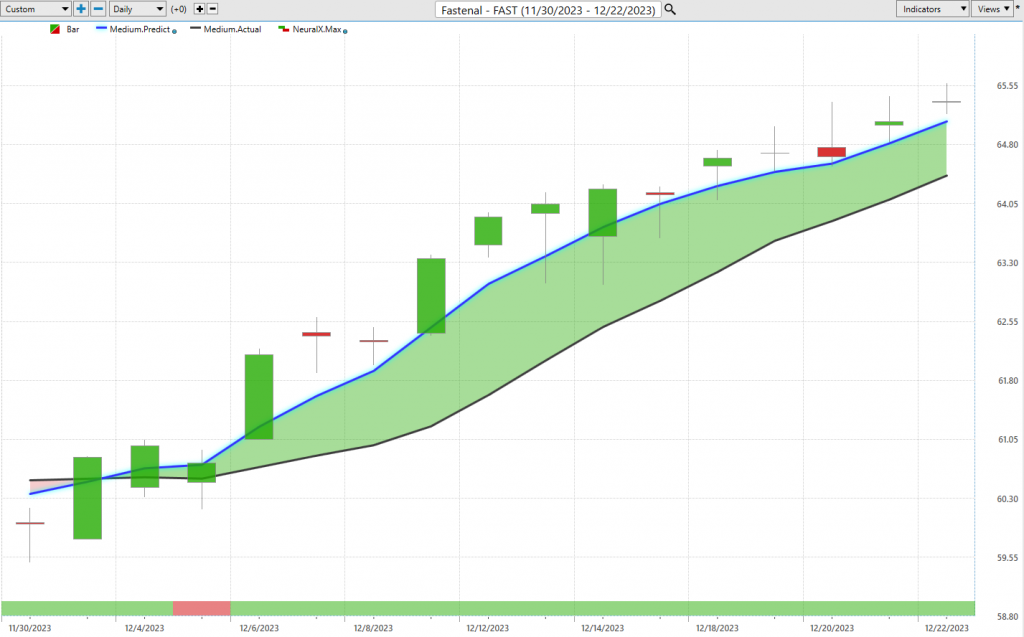
Here’s shares of Fastenal, another good example, blue line over black line, neural index bullish, which again creates this being the day where you accumulate a position. And so you see here as we move towards the Vantage Point predicted lows, well, this thing’s immediately moving higher, not coming back to your entry. And then again, you see as this trade picks up, the market getting picked up down at these predicted levels and then resuming that trend. So even on the upside as far as profit targets, it acts as a really good level to adjust the position, buy back at lower levels, and keep trading the market, right? Keep capping these pieces and take advantage of those market participants who don’t have the types of analysis and tools that you have available here. About a 7% rally just in the past 14 trading days.
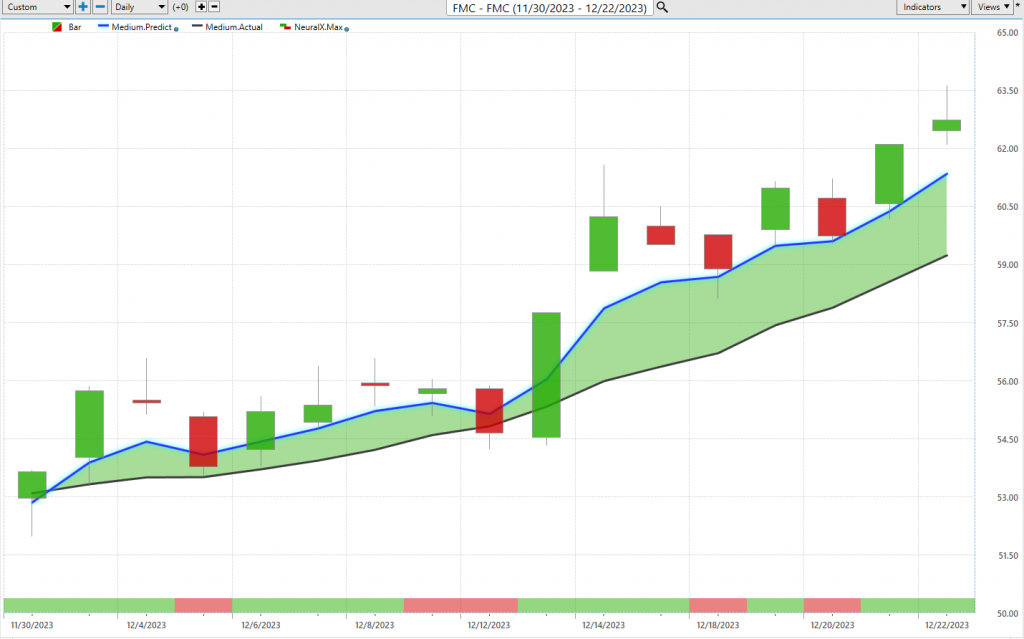
Here’s FMC, so this one of these chemical companies, similar to what we looked at last week, seeing a lot of these, especially Eastman Chemical, oil company, starting to move higher as well. There’s about a 15% rally over the past 15 trading days. What’s maybe more interesting if you’re a short-term trader is well, how these predictive highs and lows have been performing. And you see that even in a week like this where you get all this volatility and the market moving higher, look how these levels act for traders to say, okay, we may dip down lower here, all right, you know, prepare to get in at the lower part of the range and benefit as these markets grind higher and we see some strength in the energy space and then throughout a lot of these shares as well.
So this is getting pretty interesting here, you know, we see Century Aluminum 50% rally, 15% move over here.
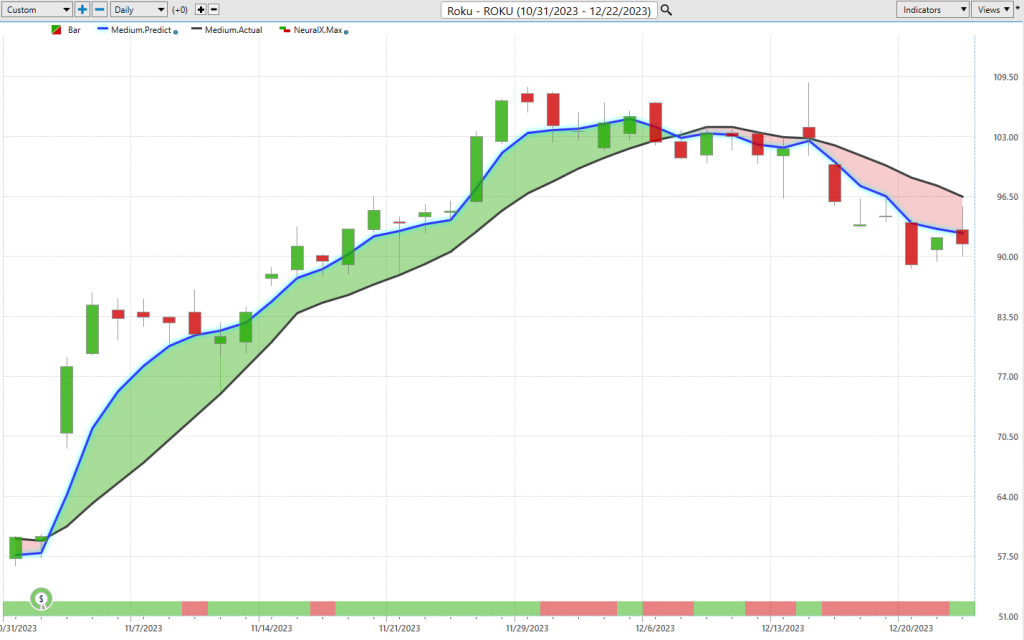
Lastly, we’ll end on Occidental here, again seeing some of these energy things start to pick up. But I wanted to bring in Roku because there’s a lot of markets out there that are doing extremely well but very few that are doing poorly and that you completely want to avoid. Well, very clearly here, Roku is not the place to be establishing a position or doing any trading over the last couple of weeks here. Blue line moving below the black line, and again, those predicted high and low levels doing what? Well, they’re acting as really the levels where we should see some weakness come in. And sure enough, we’ve seen that persistent weakness there over the past couple of weeks in shares of Roku.
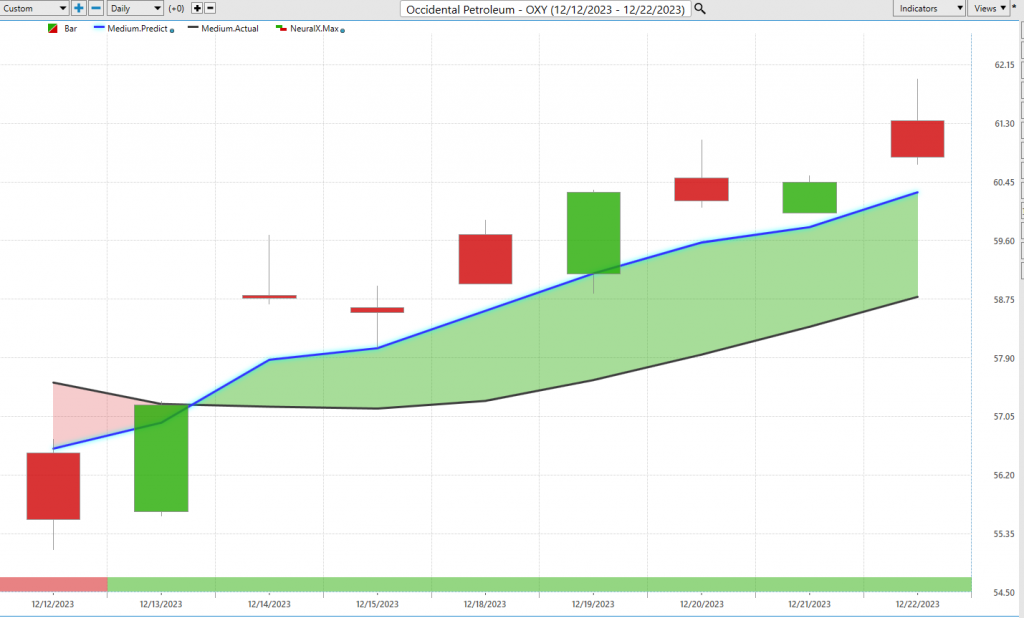
Lastly, Occidental. So I wanted to bring this through again because we had weakness in energy, right? So everything was moving lower, but we want to say, okay, where can we identify that shift? I sort of mentioned this last week, is seeing a lot of these stocks reverse. And so here in Occidental Petroleum, we can see that you get a big gap up. You know, if you’re trading the futures, there’s a much smoother sort of move here as we see energy improve. But even with that gap and the volatility, you need to say, okay, well, going into the week, how do we want to prepare? I mean, this would actually be last Friday. So going in and saying, okay, where do we want to look to accumulate potentially positions in energy? And we see here an excellent entry, and the market now moving higher. So you’ve seen about, you know, 3% rally or so just since those most recent forecasts and Vantage Point levels highlighted some bullishness here.
So, some really exciting things going on all throughout the marketplace. And this is where these predictive indicators are extremely helpful for warning of potentially short-term weakness but not losing the bigger picture of what’s going on here. And in addition to that, having those tools like the Vantage Point predicted highs and lows to really guide you as you’re managing your opportunities, and as we go day-to-day, week to week in the market.
Again, I hope you have a really nice holiday season. If you haven’t already, again, make sure you go and click on that link in the description and get yourself a live demonstration and identify some really nice opportunities via tools like Vantage Points and Tescan, which makes it a little bit easier to see some of these big shifts not just with traditional technical analysis but with actually predictive tools that are more likely to get these things on your radar and get you ahead of some of these exciting moves in the marketplace.
So, once again, this has been our hot stocks outlook for December 22nd, 2023. Thank you all for watching, best of luck out there, and bye for now.


