


Register for a Free Live Training
The Hot Stocks Outlook uses VantagePoint’s market forecasts that are up to 87.4% accurate, demonstrating how traders can improve their timing and direction. In this week’s video, VantagePoint Software reviews forecasts for SPDR SPY($SPY), Goldman-Sachs($GS), Henry Schein ($HSIC). D.R. Horton ($DHI), Caterpillar ($CAT), Century Aluminum ($CENX),
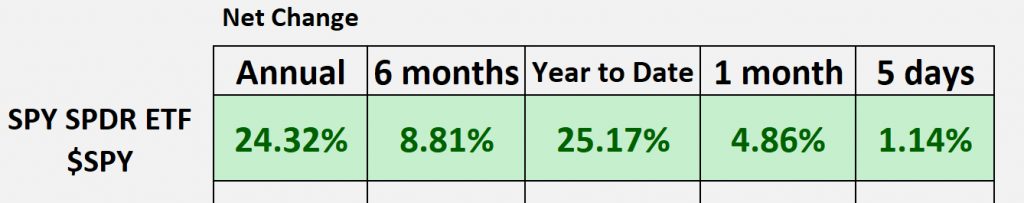
SPDR SPY ETF ($SPY)
Hello again Traders, and welcome back to the Hot Stocks Outlook for December 29th, 2023. Hope you all are having an excellent week out there in the financial markets. It’s really our last week of the year before we get into 2024, so if you haven’t already, it’s really a great time to go ahead and sign up for a live demonstration. You can go ahead and click on that link in the description below and learn all of the specifics about how this technology can help you make much better trading decisions day in and day out in the marketplace throughout the new year.
So, what we typically do here is we start out with the SPY, and we can see our Vantage Point forecast here. What I just wanted to highlight is we’ve had a 14% rally, just under 14%, in the past 40 trading days, and we keep highlighting that this is really where this all started, right at the beginning of November. And that’s caused a lot of opportunity to open up throughout the marketplace. And so, as we keep looking at these individual opportunities, what we highlight are individual opportunities that are outperforming the S&P 500.
But, of course, we want to recognize, well, where are those better opportunities? How can we minimize the risk? And so, let’s go ahead and go through the Goldman Sachs forecast here and explain how all of these predictive indicators work.
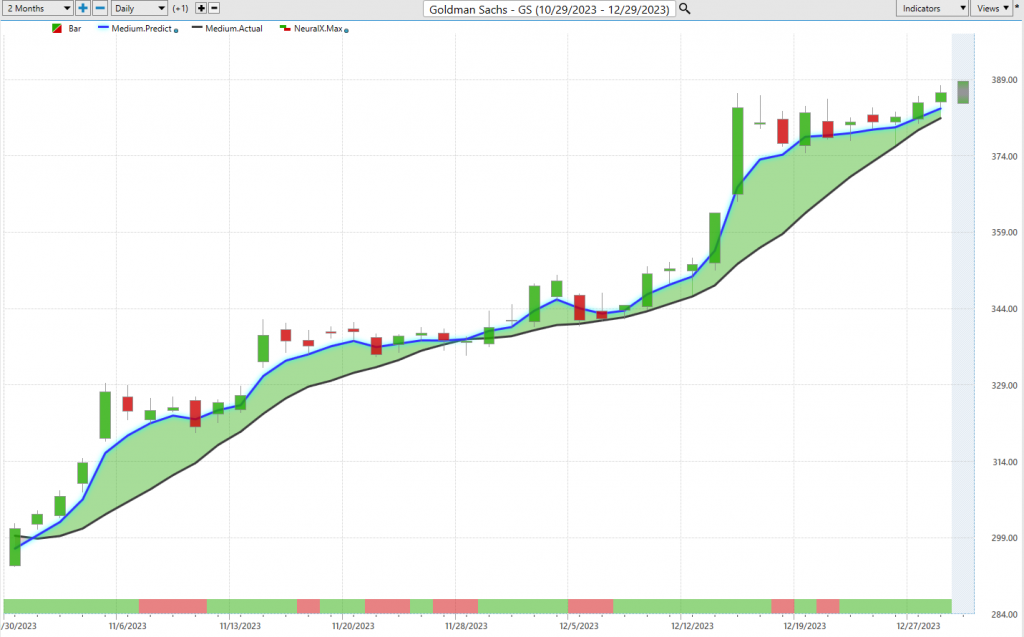
So, again, what you’re looking at here is daily price action, right? So, each one of these candles represents a full and complete trading day, and it’s right up against all the price data. You’ll see that there’s a black line and a blue line value. Now, we’ll get to this bar at the bottom, and also this really shadow candle that we have each trading day, but right now, let’s just focus on this. What’s called the predicted moving average.
And so, with that black line value that you see on the chart, that is a regular simple moving average, a very common technical indicator, which we refer to as the actual simple moving average. So, this value is really just derived via the past, right? You just take the last 10 close prices, add them all together, and then divide by 10. And what it does is it smooths out the existing price action, but it really just lets us know where the market has been, acts as a good baseline, letting us know well where has market prices been over this given period of time.
But what we’re able to compare that value to is this proprietary blue line value. So, essentially, what this is, is a price prediction. And for it to be calculated and plotted on the chart every evening, well, this is where Vantage Point’s technology of artificial neural networks come into play. And to generate that value, rather than just looking at past prices of the asset in question, what the technology is able to do is look at dozens of other markets that are known to drive and influence the future price of Goldman Sachs.
Now, these can be a lot of competing market relationships, whether leading, lagging relationships, inverse or positive correlations. But it’s going to look all the way down the line at things like the S&P 500 or ETF groups that are important to the financial space. It may look at individual stocks as well as the value of the dollar index or potentially large commodity markets. So, it takes this global approach, looking at all the competing market relationships that are, again, known to drive this individual stock, and then using that information to generate highly accurate predictive forecasts.
And so, again, whenever that blue line, essentially a forecast of average prices, moves above the black line and remains, well, it’s suggesting that average prices are going to keep moving higher, and you, therefore, as a trader, short-term or long-term, may want to look to take long positions in the market. And so, you see here, in the past two months, you have a return higher than the entire S&P 500 over the course of the year, right? A 27% rally just in the past 41 trading days.
And what traders can do is understand that, well, that’s the inflection point, that’s when things shifted, and they haven’t shifted since. So, this is where Vantage Point’s shorter-term tools like the Vantage Point neural index that you see at the bottom of the chart here, and Vantage Point’s predicted highs and lows can come into play to really advance things even more.
So, when we look at this bar at the bottom of the chart, this is Vantage Point’s again predicted neural index. And it’s also utilizing that technology to look at those in-market relationships. But it’s solving a different problem. And this problem is what’s happening over the next 48 hours, or essentially two candles moving forward.
And so, what you’ll notice is that there will be these periods where the neural index goes bearish, and you get a little bit of weakness over the subsequent 48-hour periods. But that weakness is in an uptrend, a good opportunity to buy. And this is where Vantage Point’s predicted highs and predicted lows give you a range every single trading day of where the market is expected to trade, both on the top end and lower end for that trading day.
And what we do in these Hot Stocks Outlooks each week is look back and see how accurate all of these predictive forecasts were. And we can think of it as a predictive forecast of, okay, the overall trend is up, our short-term forecast is either bullish or bearish for that subsequent 48-hour period, and then you have a predicted high and low range every single day.
And what you’ll see here is as that weakness comes into the market, Vantage Point does a good job guiding you, saying look towards this lower part of the range to accumulate a position. And you see getting in right before that advance, the next couple days, you move up towards these predicted highs. But then that volatility really comes in, and shares advance.
And you see how these predicted lows do a great job every single trading day as the market really drifts sideways for 3 weeks. You’ve got four, five potential entries before this really starts to accelerate once again. But again, you see how every single trading day, this has been a very, very bullish forecast in a market of very, very bullish forecast.
So, you understand where you can hone in and really extract that value for the trades that you’re getting involved in. Again, really nice opportunity. And we’ll look at more of these situations where that neural index may get bearish. And again, more of that sideways price action. But the trend is still up. And that’s where traders need to understand, okay, what’s my timeframe? What am I going for here?
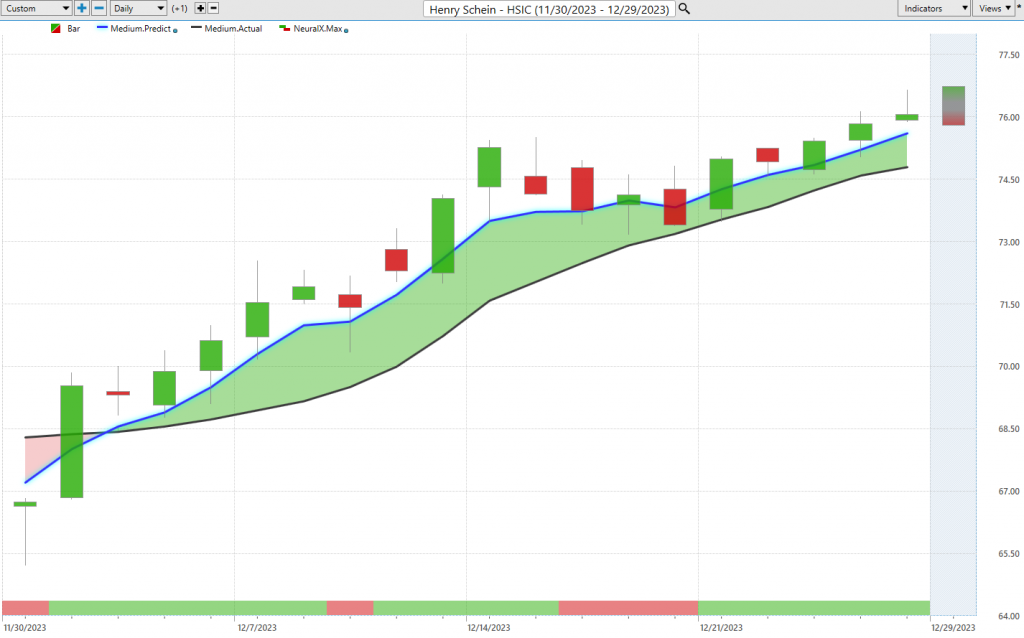
And then, falling in line with those predictive forecasts from Vantage Point, here’s Henry Shine. They make a lot of medical and dental equipment. But more recently here, you see this blue line crossing above the black line and signaling that the overall trend is expected to move higher. Well, now, each and every subsequent trading day moving forward, we can use the shorter-term tools like the predicted high, like the predicted low, and the Vantage Point neural index.
So, you’ll see here how you have one day where it goes down to a red market trend, just continues on here, another little blip period where you get a little sideways. That’s pretty much it. I mean, this has been a very, very bullish forecast, just a ton of distance between that blue line and black line value. And, again, of course, we can look at well, on those predicted high and low values that you’re provided every day, where is it signaling for you to try to scoop up a position.
So, you see it’s before this advance, a nice opportunity. We actually came probably these previous, a couple of predicted low levels, and the market advances again. Here you get a couple where the market moves lower, but the overall trend is up and we keep moving higher, moving higher, moving higher, and moving higher. So, a really nice opportunity here, more recently seeing those bullish forecasts come through. But again, just having an overall very bullish market throughout November and leading to where we are now.
Now, there are certainly some warning signs out there as we get towards the end of the year. And of course, you can expect some of that frothiness. But of course, we’ve got really nice entries into these markets.
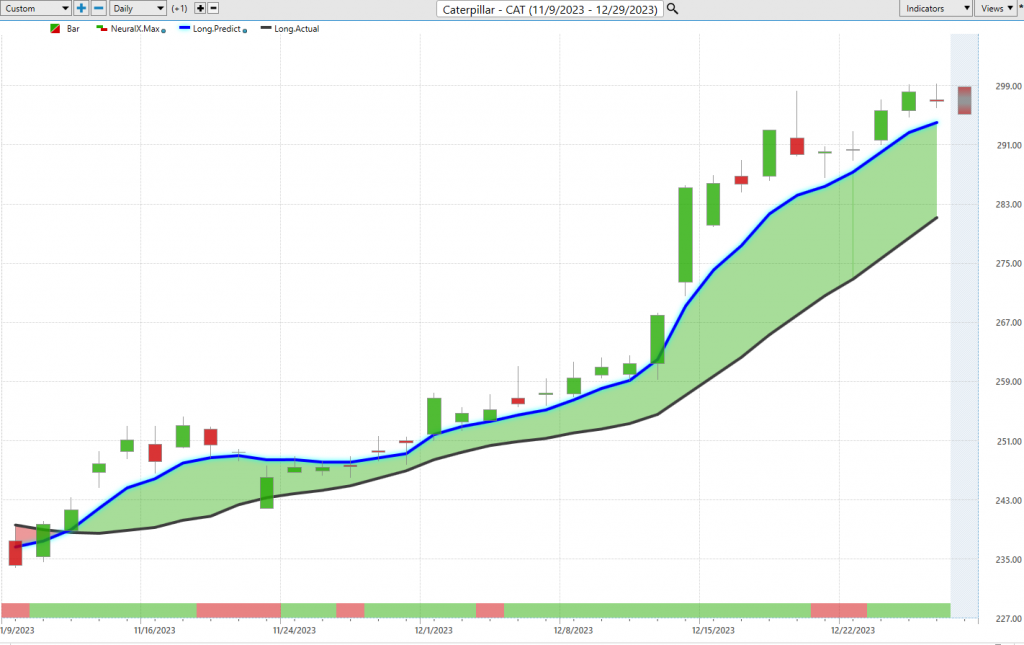
So, Caterpillar, this is a market we looked at over the past few weeks. See that blue line crossing above the black line? More recently, over the past week here, that neural index goes bearish. You have not really a lot going on here, but the trend is quite bullish here, right? Very short-term sort of sideways blip, but nothing here in the way of weakness.
And again, we see that these predicted lows acting as a really good level, say, “Okay, well, if you want to buy some more, look at these levels down here.” And then what happens is you get the updated forecast. So, after this trading day here, what you have to understand is your predicted high and low ranges are actually moving higher. It’s letting you know that this day is expected to be bullish, and sure enough, that’s where some more bullishness came into the market.
So again, we can really use this suite of predictive indicators to get that overall forecast of what’s likely to occur and then just match that forecast with the trading style and limiting the risk. So here, about an 18% rally in just the past 20 trading days. I mean, that’s only about a month on the calendar there.
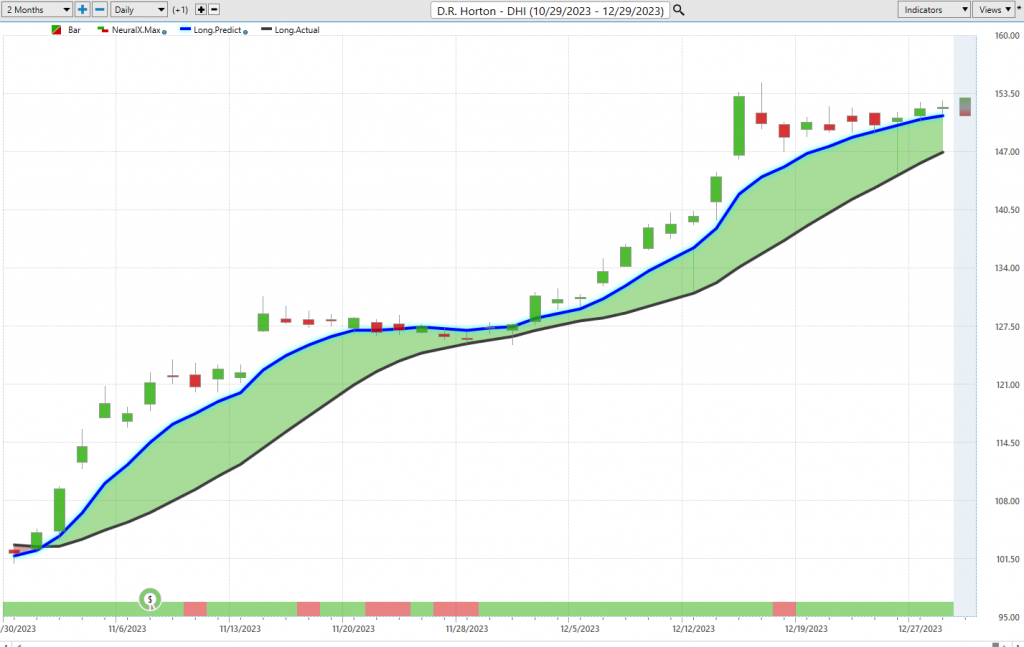
D. Horton also in the construction space, blue line over black line, neural index bullish. You have one day here where that neural index goes bearish, and you see just a couple of periods of just sideways, not much going on. But again, let’s look at those predicted highs and lows, and that’s really your guidance that says, “Okay, well, there may be some weakness, but where do you want to be scooping up shares regardless?” And even once you get to this point, I mean, your neural index very bullish, and you’re moving up towards those predicted high levels once again.
So again, really nice move here at D.R. Horton. Really, the whole home builder space has been extremely bullish here. You see again, 19% rally, but just in the past 21 trading days. So, if you’re trying to outperform that S&P 500 over the year, well, sure, we’ve had a nice 25% rally, but you’re going to have to find these things that are really outperforming the index and potentially understand that, hey, there’s something going on in this sector. Maybe you should be a little more concentrated in these things that are more likely to move.
So, I mean, here we’ve had four opportunities that have moved just as much as the S&P 500 over the year.
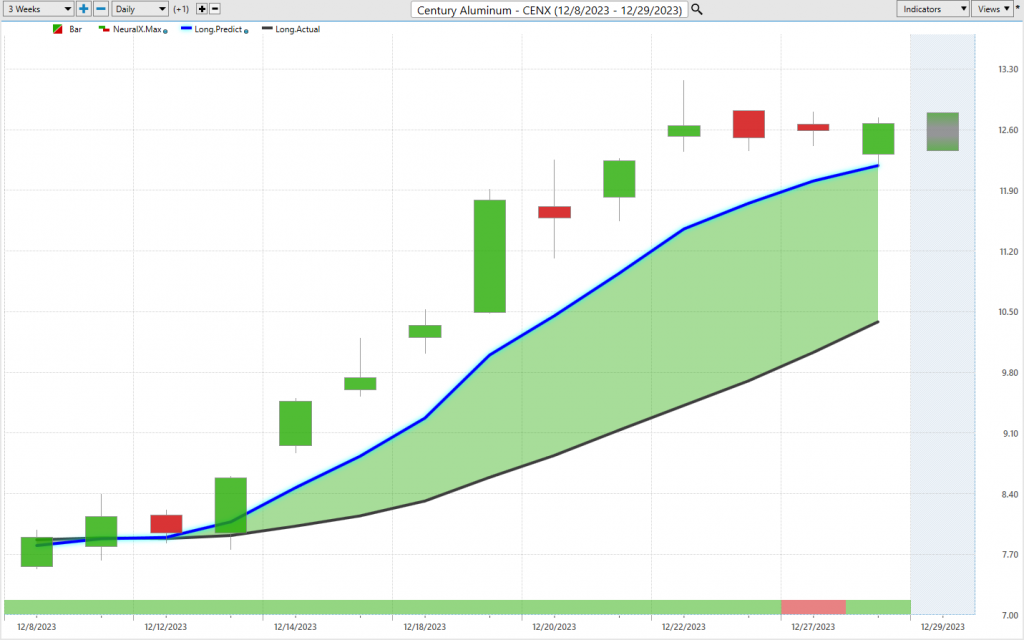
Here’s Century Aluminum, so we talked a little bit about some of these metals, copper and platinum, really looked very, very bullish. Platinum had a big blow-off day earlier in the week, but it helps in some of these mining and material companies.
And so again, we see this blue line above the black line, neural index very bullish. We had one day where the neural index has been bearish here, so we’re still kind of in a sideways potential period, but this trend is very, very bullish. And what we’ve seen is just a really monster sort of rally here. You know, from these predicted lows coming through, you’ve got a market that’s up, it’s pretty insane amount. We’re at 65%, and that’s just in 13 trading days.
So these are the types of things that Advantage Point’s analysis, looking at those intermarket relationships, potentially looking at the appropriate metals or oil or gas or agriculture, whatever it happens to be that’s really driving that individual stock that you want to trade. And the beauty of this is that we can actually take these predictive indicators and look for those early predictive signals via tools like Vantage Points and Telescan.
So whenever we want to go ahead and actually search is where are these bullish crossovers coming through, what sector are they coming through, and then of course, we get the updated forecast to manage those opportunities day in and day out.
Once again, this has been our Hot Stocks Outlook for December 29th, 2023. I hope you have a great end of the year period, and again, you know if you’re really curious at all, sign up for that live demonstration, learn all the specifics about how these tools can help you and guide you throughout the new year and some of your trading and getting a handle on your strategies and approaches.
Once again, have a great rest of the new year. Thanks again, and bye for now.


