Hot Stocks Outlook for the Week of
December 4th, 2020
The Hot Stocks Outlook uses VantagePoint’s market forecasts that are up to 87.4% accurate, demonstrating how traders can improve their timing and direction. In this week’s video, VantagePoint Software reviews forecasts for United Therapeutics (UTHR), Alcoa (AA), Goldman-Sachs (GS), Opko Health (OPK), and Spectrum Pharmaceuticals (SPPI)
Register for a Free Live Training
This Week’s Hot Stocks Outlook
Hello again, traders and welcome back to the Hot Stocks Outlook for December 4th, 2020. Hope you’re all having an excellent week out in the financial markets and as always, plenty to cover in this week’s outlook. We’re going to start here with shares of United Therapeutics, and this is actually a stock we looked at all the way back in early November. We’ve also got Alcoa, Goldman Sachs here, which we looked at over the past couple of weeks, OPKO Health, and lastly, Spectrum Pharmaceuticals. A couple of more biotech stocks to round things out, but I just wanted to highlight something a little bit differently here in United Therapeutics. What we have here is really a combination of predictive technical indicators that are weighted through the benefit of artificial intelligence. Specifically, what’s happening with these predictive indicators is that they’re utilizing a, approach of doing what’s called intermarket analysis.
United Therapeutics (UTHR)
Understanding in the case of United Therapeutics, what are the intermarkets that are known to drive and influence the future price of this being the target market, this biotech stock? Now, that can be things like the S&P 500, that can be things like the dollar index or global currencies, interest rates, also ETFs and individual stocks. What we’re able to do here is understand how these intermarkets are driving that future price. What happens is these predictive indicators rather than using data that just comes from the past, like a traditional simple moving average would just lag forward and be dragged around by the most recent price action. These indicators are actually using predictive data, so data in the future that hasn’t yet occurred.
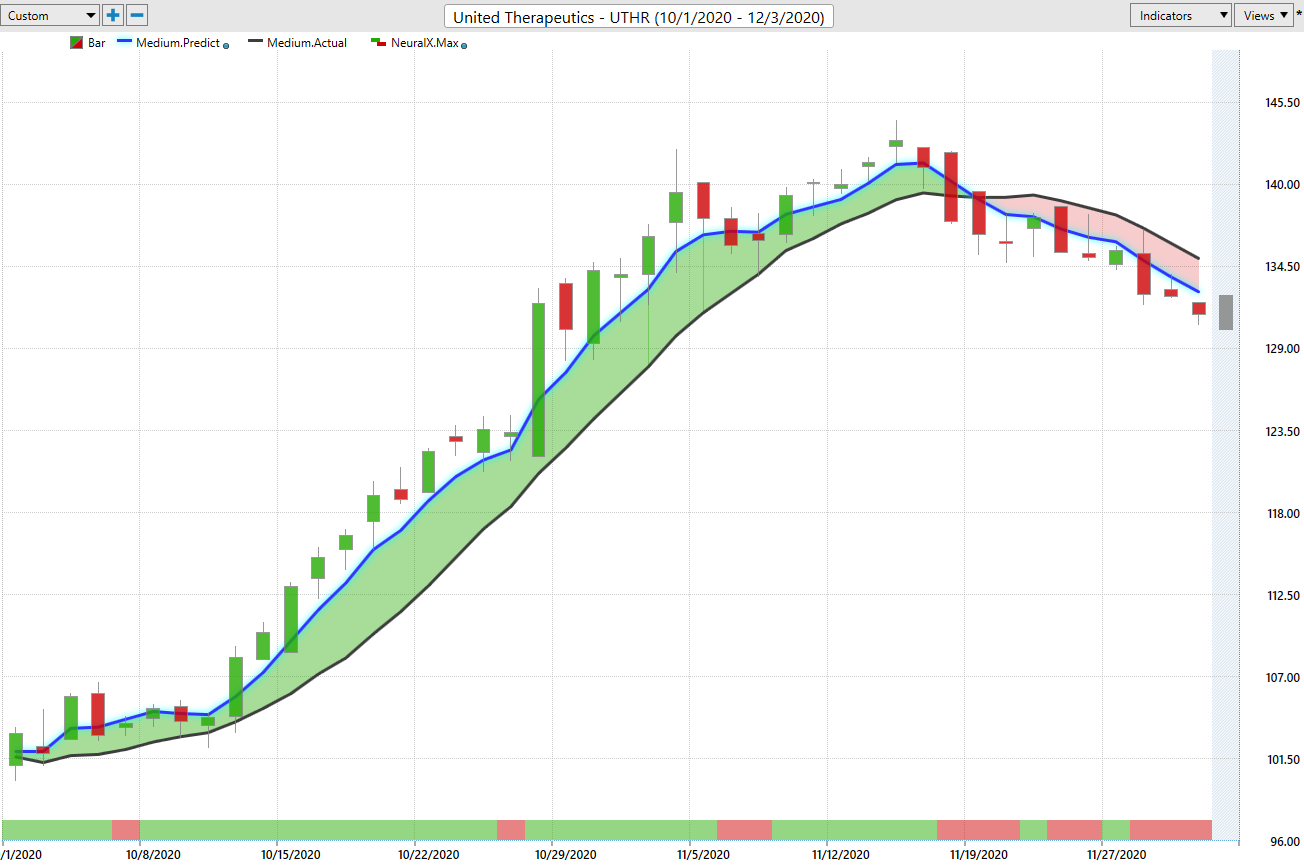
When we look at United Therapeutics as a whole, what we have here is right up against the price data, you see that there’s a black line and a blue line. Now, the black line that you see there, that actually is a simple moving average, and it acts as a good measure of where market prices have already been. What we compare that to is this blue line or this predicted moving average. What again, is happening is rather than using data from the past, it’s actually weighted with forward-looking predictive data to generate a signal earlier. Whenever we see that blue line cross above the black line, it suggests average prices are going to start moving higher. Now, the great thing about artificial intelligence is we can really train it to do a specific task. While this indicator is meant to highlight that future average price moving forward, at the bottom of your screen, you’ll see you have a bar that goes from green to red, and that gets updated every single trading day.
That is specifically designed to look ahead two trading days. You can think of that as really two candles on the chart, and it’s highlighting very short term strength or weakness. There’s actually a component of volatility to it. Some low lows are predicted to come through over the next couple of trading days, you’ll likely see that indicator move to the red configuration. That again, a very short term indicator that we can use in combination with our predicted moving average. Lastly, you see that there’s a shadow candle here and actually predicted high and a predicted low. Again, we have neural networks picking out those specific days, but not an average price, not a 48-hour outlook of strength or weakness, but a literally predicted high and predicted low for the next trading day. United Therapeutics, this is one of the stocks that we really started to notice this moving higher mid-October, November is when we brought it through in the Hot Stocks Outlook, but I want to go over the whole chart here.
You see, what we have here is all the way at the beginning of October, this blue line crossing above the black line is suggesting, look, the overall trend is up. If you want to trade this market, you’d want to look to go long. What we can do is take a look at those predicted highs and lows. Now, what happens here is that predicted high and low is generated before the trading day. Then what happens is what gets populated is the actual data from the actual trading day here, right? We can see how correct each one of these trading days was and understand that, okay, well, if we’re looking early on to get involved in this market, we get multiple days here down at this predicted lower the market taps that price, and then begins that uptrend. You see, you get after that big rally, some additional days where some really nice entries before the market really starts to accelerate.
Even as volatility comes through here, you see the predicted highs and lows doing a good job, the next trading day, hitting the predicted lows moving forward. You’re getting plenty of these opportunities, but here’s really the thing is that when you get involved in a market back here, you have the option to look at the overall forecast and say, “Okay, well, this is a strong uptrend. We’ve got the blue line still well above the black line,” and when you’ve got that really nice entry, you can put some of those profits at risk to really build a large position and make a tremendous amount of money. What we see here is actually a shift in the market, and this is where every single market eventually is going to go into uptrends, downtrends, change direction. You see here that over this course of really going into November towards the tail end of this, what I just want to highlight is how these forecasts are changing.
What we recognize is, again, these really nice levels to come in and potentially add to your position. Notice on this trading day here, you actually get the predicted highs and lows slanting lower. We get some weakness in the trading day, but that blue line is still above the black line at that point. Again, very deep movement, lower from the predicted highs and lows, but going into that day, you could still assume that, okay, well, the blue line is still above the black line. Look to be a buyer down at this level, but then we get a shift and that’s where you understand that, okay, well now, not only do you want to get out of those long positions, but from this point on, be looking to short the market and execute short positions here.
You see, you get a few opportunities where you’re tapping up towards those predicted highs. You can reverse that position in shares off already about 5% to the downside after getting a tremendous rally to the upside, where not only can you recognize to get involved in that opportunity very early, but excellent opportunities along the way to add to things as you get another 15, $20 as the market moves higher here. A 36% rally to the upside, but then since this point where you’ve gotten that blue line crossing below the black line, additional 5% on the short side, depends how you make money as the market moves lower as well.
Alcoa (AA)
Alcoa, here’s another example of a stock we looked at I believe two weeks ago, so that would be all the way somewhere around this mid point of the chart. What I want to do is again, highlight the most recent forecast from that very short term forecasting perspective of the neural index, that 48-hour indicator and also the predicted high and predicted low.
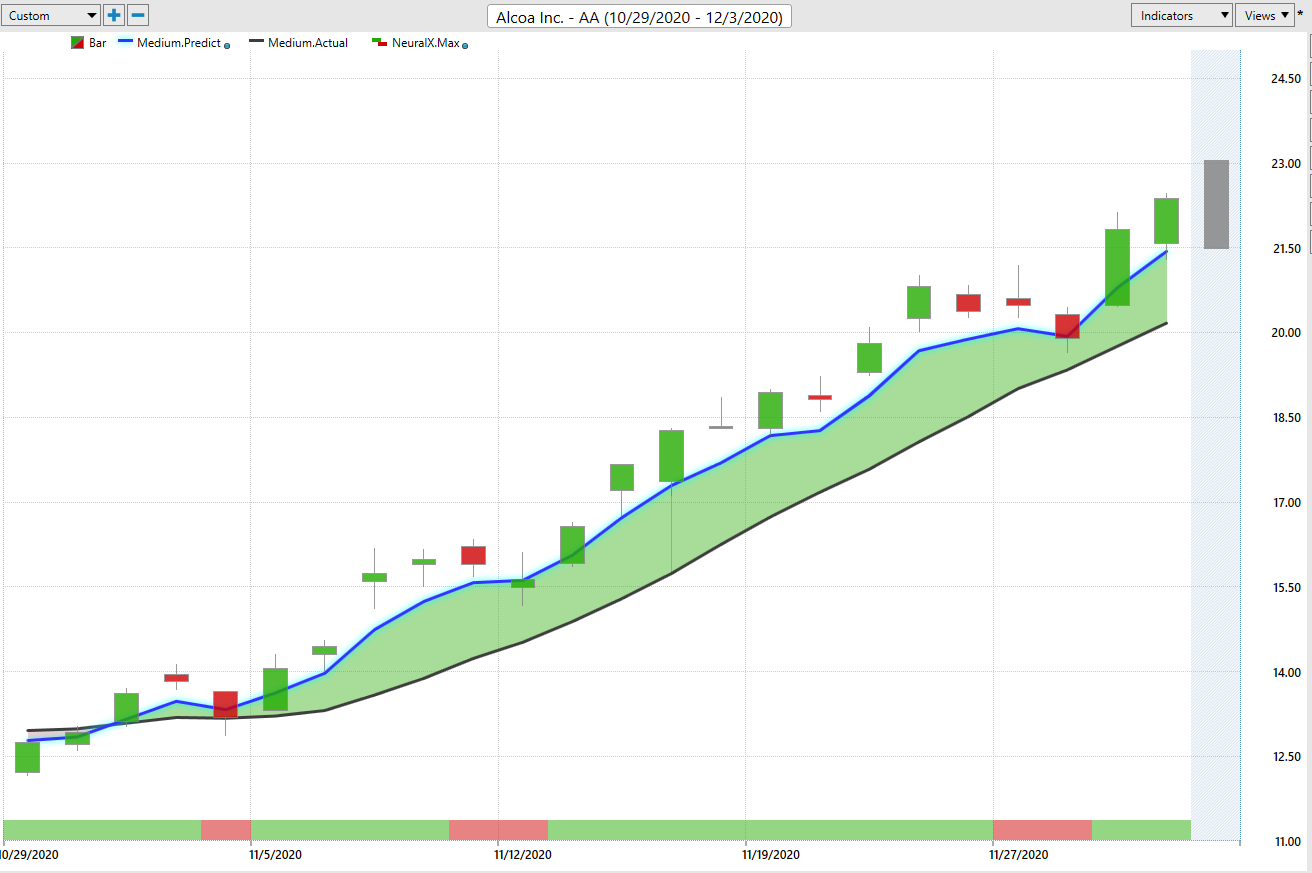
We can see that this neural index gets bearish really right here, letting you know that over the next 48 hours, expect some weaker prices. What do you get? Well, a gap down in the market moving lower, but you see that blue line is still very much above the black line, suggesting that that’s a good opportunity to actually buy on the dips here and you get this situation where price is moving lower, but then aggressively accelerating to the upside. This is why we don’t really want to … When you’re looking at such a short timeframe, as far as day trading, sometimes the market’s going to move lower and close lower. The only way to make money is to hold that position overnight, and you see over the next 48 hours, things really accelerating to the upside, another 12 and a half percent move higher. As we’ve seen things like the dollar index move lower, and that’s going to be bullish for precious metals, other commodities. That can again, divert your attention to those areas so that you’re making money in those markets as well, if you trade futures, currencies, what have you here.
Goldman-Sachs (GS)
Goldman Sachs, another opportunity we looked at last week. Again, I just want to highlight these most recent forecasts. The very, very short term, you’re getting an update every single trading day, as far as that predicted high and low, as far as the neural index, and you can use other tools like our predicted moving average to determine, okay, is this an uptrend downtrend? What should we be looking at here? Again, you see that the neural index goes bearish here, and what are we getting over the next 48 hours? Well, some gap downs in the market, certainly trading lower than that close, but still an opportunity to be a buyer as prices are moving down again towards those predicted lows.
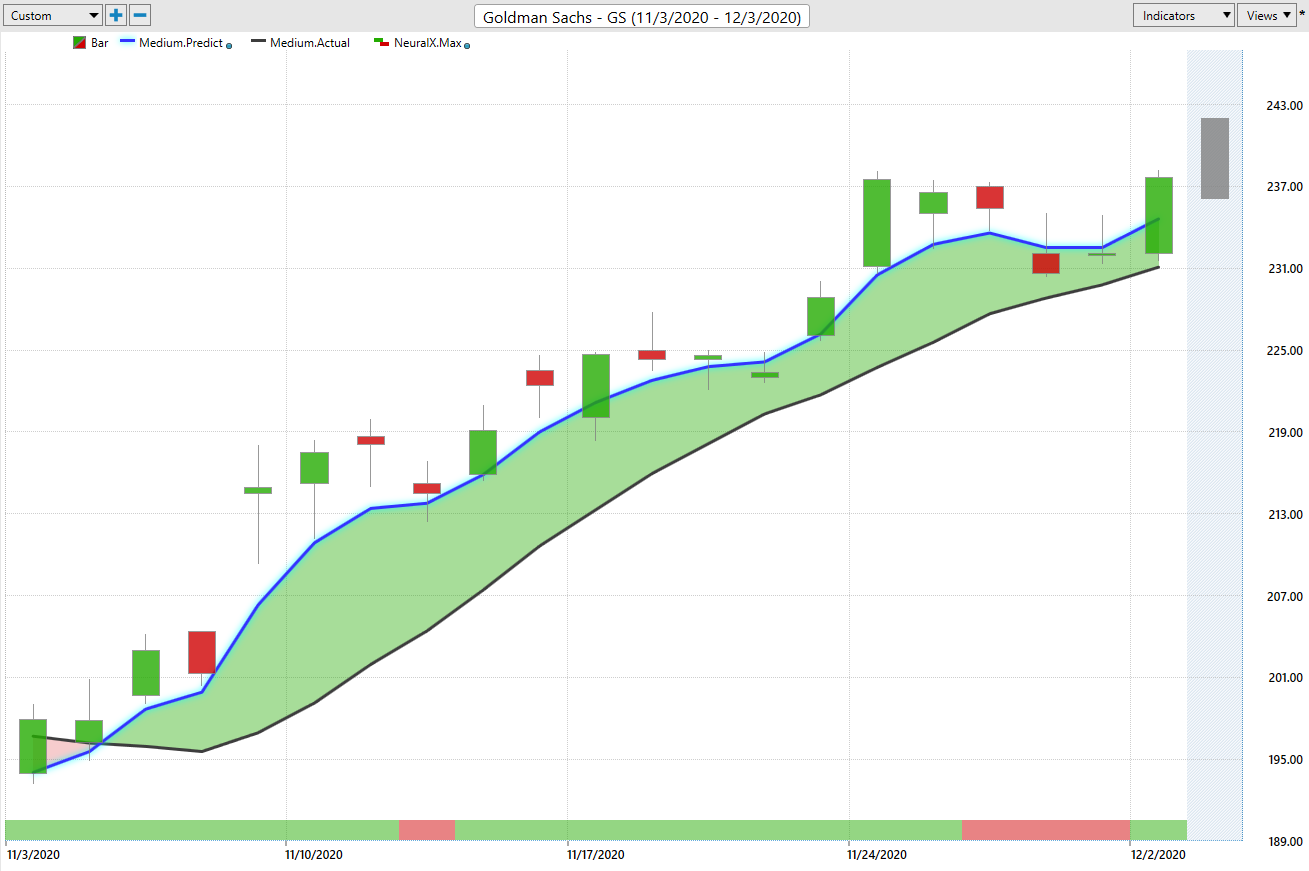
What do you want to make sure is you don’t have stops sitting all in this area if that market is still in an uptrend, you don’t want to get stopped out of the market. Then we see shares advancing once again and finding some new highs here. Not a huge move so far, just over the past week. Again, you’ve got a two, almost 3% rally, just over a couple of trading days here, since these forecasts have come through.
Opko Health (OPK)
Now, here’s OPKO Health. Some additional biotech stocks, and you’ve had a mixed market here, right? You see United Therapeutics turning lower. You don’t want to be long there, but where are some areas where we’re in uptrend? Well, you see OPKA getting this predicted, moving average, crossing above the actual moving average. Your neural index, getting bearish here, again, little bit of weakness the next trading day, a gap down within that 48-hour period.
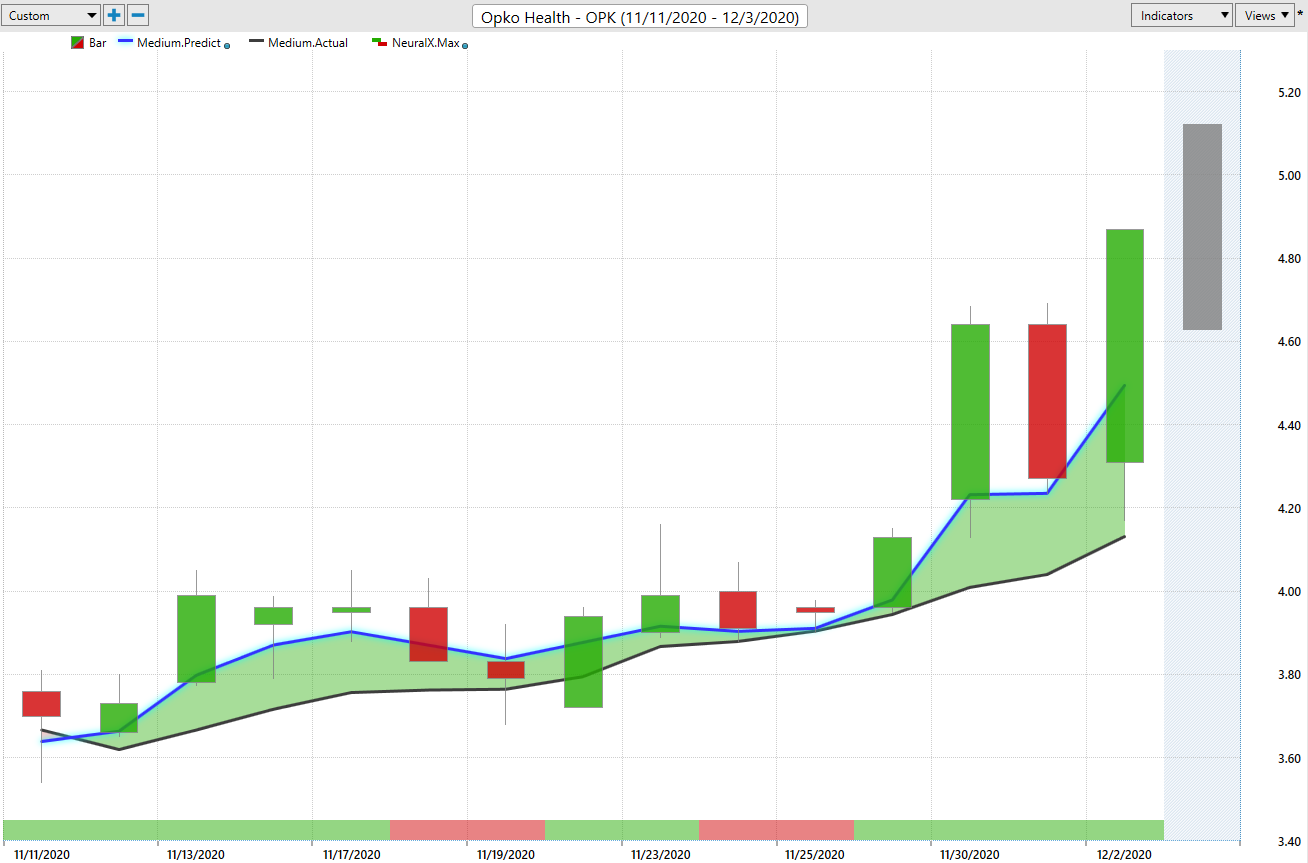
The overall trend is still up here. You see neural index getting bearish again, a little bit of sideways over the next 48 hours, but that blue line is still above the black line. Then things really start to accelerate. What’s so important about trading is one, well, recognizing that the trend is reversed to the upside. Here’s where that campaign of buying should start, but getting a good entry before the market really starts to take off, because when you have that good entry and additionally, have been able to take some profits potentially along the way with some shorter term training, that’s going to allow you to really finance holding onto that position for the longer term. Here you see, you got one, two, three, four, five entries, really six entries here as this market runs sideways pretty much coming in around 390 or a little bit below that. Now, the market trading up towards 490. We can see overall this being a very nice percentage move to the upside, but since those crossovers come through about a 28% rally, just in the past two and a half, three weeks of trading here.
Spectrum Pharmaceuticals (SPPI)
Lastly, Spectrum Pharmaceuticals, exact same thing. When this neural index goes bearish, you generally see some weakness or sideways action in the market, but this predicted moving average is very, very bullish here. It’s been pretty straightforward as far as if you’re looking in today for a price level to accept prices at well, where do you want to look? Well, you want to look down at these predicted lows and you’ll see this happen every once in a while, where you get some volatility in the market, but that actually often works to the trader’s advantage where you’re getting filled at the open.
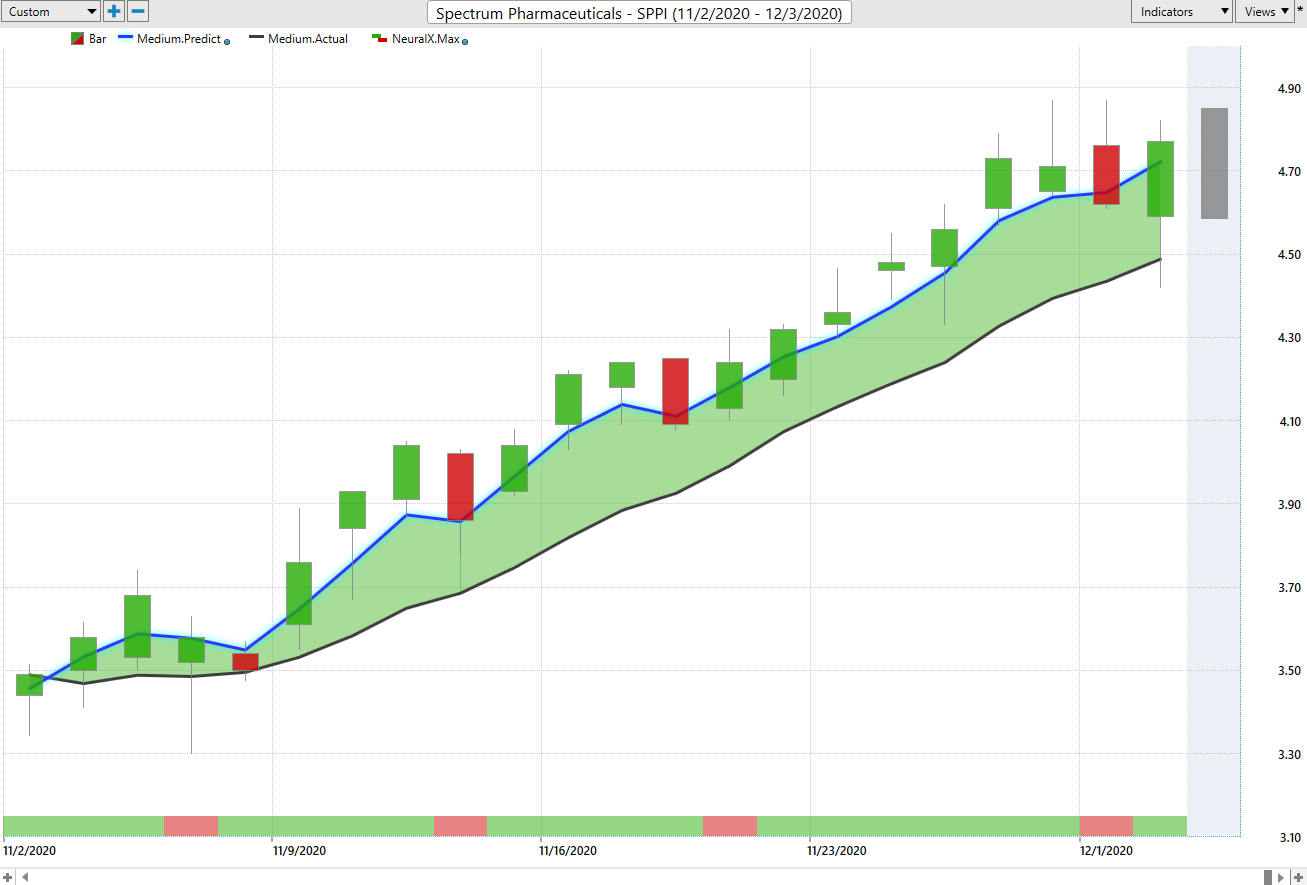
Days like this, you’re getting filled down at these predicted lows or potentially even better. You see overall, we’ve got one, two, three, four, five, six, seven, eight, nine trades there that within really 24 hours are moving in the direction of profit there. Plenty of opportunities for the short term trader, but additionally, the longer term trader here. If you’re trading the swing trades and looking for these longer term opportunities. Let’s go ahead and bring up that profit calc. We’ve got a move up of about 36% in the past 19 trading days. Again, understanding that when you get that early entry in a market and you understand that, okay, well, now that things have moved in your direction, you’ve got plenty of opportunities here to potentially get aggressive in the marketplace. That’s where things can really accelerate as far as how much money you can make on a single opportunity, but still really minimize the risk over the course of that opportunity for your downside. Once again, this has been our Hot Stocks Outlook for December 4th, 2020. Thank you all for watching best of luck out there and bye for now.