


Register for a Free Live Training
The Hot Stocks Outlook uses VantagePoint’s market forecasts that are up to 87.4% accurate, demonstrating how traders can improve their timing and direction. In this week’s video, VantagePoint Software reviews forecasts for Intercontinental Exchange ($ICE), SPDR S&P Metals and Mining ETF ($XME), W.W. Grainger ($GWW), Wal-Mart Stores ($WMT), Booz Allen Hamilton Holding ($BAH)
VANTAGEPOINT A.I. HOT STOCKS OUTLOOK – DECEMBER 5, 2025
Hello again, traders, and welcome back to the Hot Stocks Outlook for December 5th, 2025. Hope you’ve all had a nice week out there in the financial markets. As always, we’re here to take a look at the most recent VantagePoint A.I. predictive forecast. If you haven’t already, be sure to click the link in the description below so you can get signed up for a live demonstration to learn all the specifics about how these predictive indicators and technologies help traders make better decisions in the marketplace.
We’ve had an interesting month. Markets have been sideways for a little over four weeks, but we’re starting to see new trends emerge—and this is where VantagePoint can be very effective.
Intercontinental Exchange ($ICE)
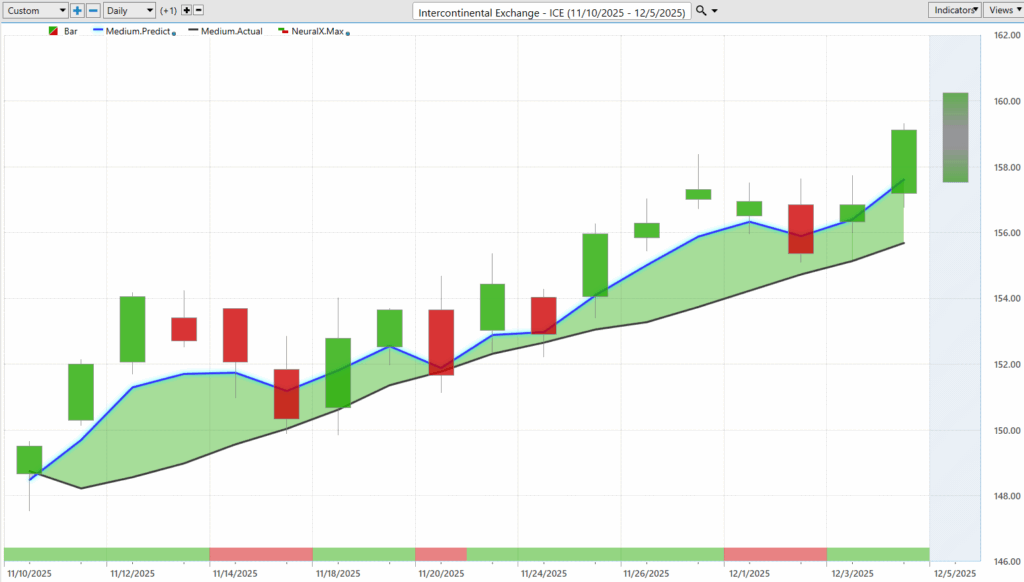
Intercontinental Exchange (ICE) provides a great example of how all of these predictive tools work together, whether you’re short-term day trading or identifying new swing-trading opportunities. Here in ICE, we’re looking at daily bars and candles—end-of-day data each week. The first thing that should stand out is the black line and the blue line.
The black line is a 10-period simple moving average, a traditional indicator that relies only on past prices. VantagePoint traders use this as a baseline to understand where market prices have been. But traders want to be ahead of the next move, which is why we compare that black line to the blue line: VantagePoint’s proprietary predicted moving average.
The blue line is calculated using artificial neural networks performing intermarket analysis. Instead of looking only at past prices of ICE, the system analyzes dozens of correlated markets—other stocks, ETFs, global interest rates, major currencies, and even certain commodities. These intermarket relationships drive the future price of ICE.
Back in mid-November, the blue line crossed above the black line with strong separation—a clear sign prices were likely to move higher. The Neural Index at the bottom of the chart measures short-term strength or weakness over the next 48 hours with about 85% accuracy across many markets. Even when the index goes bearish and price dips sideways briefly, the blue line staying above the black line keeps the larger uptrend intact.
We’ve also seen the predicted highs and lows guide day traders extremely well. Over the past few weeks, ICE climbed about 5%, repeatedly dipping to predicted lows and then resuming its upward trend.
SPDR S&P Metals and Mining ETF ($XME)

The SPDR S&P Metals & Mining ETF (XME) has been benefiting from very strong moves in silver. Whether a trader wants to trade SLV, GLD, or the equities inside this ETF, VantagePoint analyzes the same intermarket factors—metals, miners, global commodities, and sector-specific ETFs.
Here again, the blue line crossed above the black line with strong separation. Predicted highs and lows have helped identify excellent points to accumulate a position, and so far this week alone, XME shares are up about 5%. The entire metals-and-mining sector has seen strong movements recently.
W.W. Grainger ($GWW)
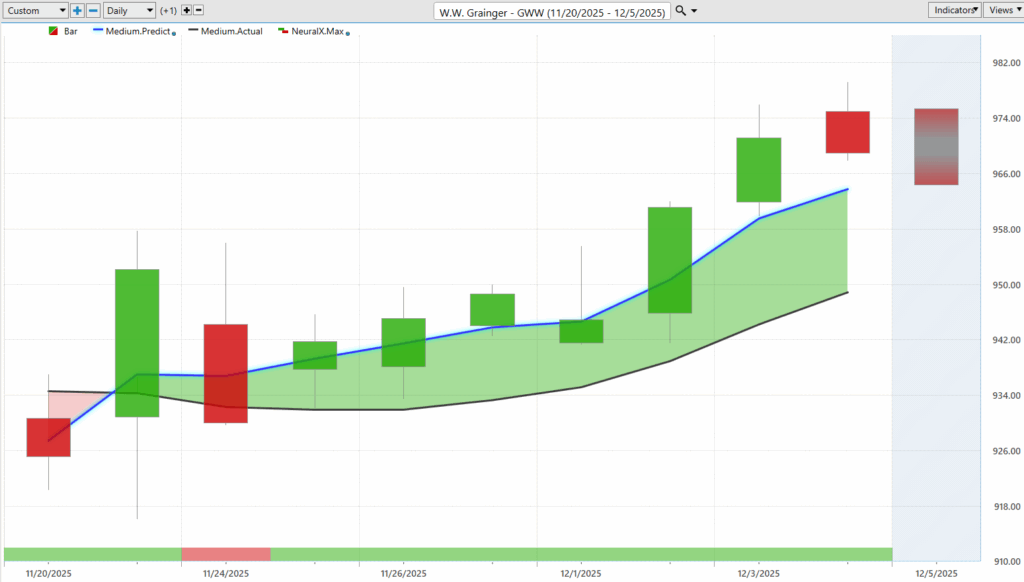
W.W. Grainger (GWW) is another example of early trend development. The blue line is above the black line, signaling an uptrend. Although the Neural Index briefly turned bearish for a day—leading to a small dip below the predicted moving average—it flipped back to bullish quickly, and momentum resumed.
Predicted lows highlighted clear buy-zone opportunities. GWW has moved about 3–4% higher during this period.
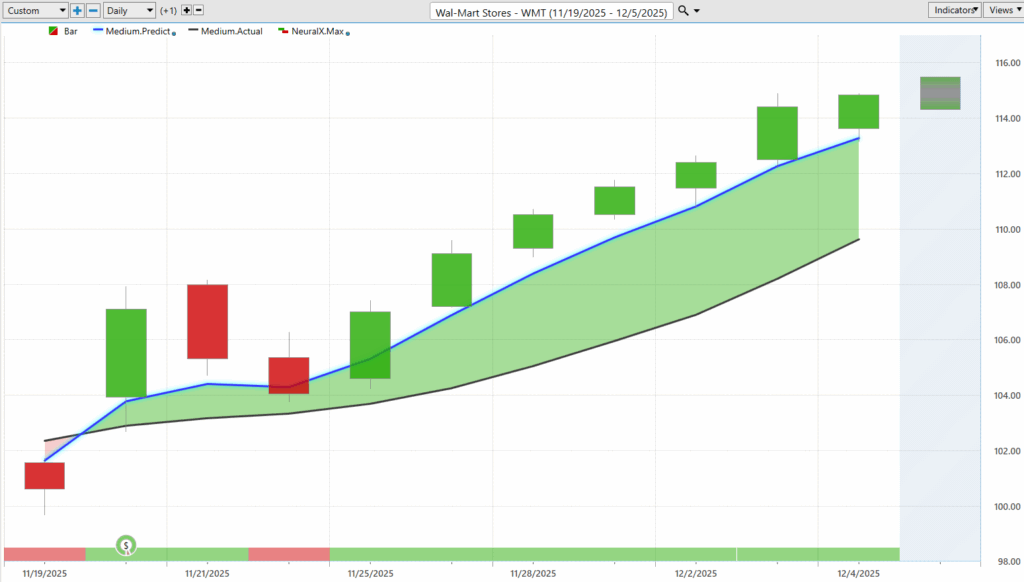
Wal-Mart Stores (WMT) reported earnings at the very beginning of this trend. If traders prefer waiting for earnings volatility to settle, VantagePoint seamlessly adjusts to new market conditions. After earnings, the software projected short-term weakness for a couple of days—accurately marking predicted lows that became excellent buying levels.
From earnings to now, WMT has rallied roughly 10%, with predicted lows acting as effective accumulation points.
Booz Allen Hamilton Holding ($BAH)
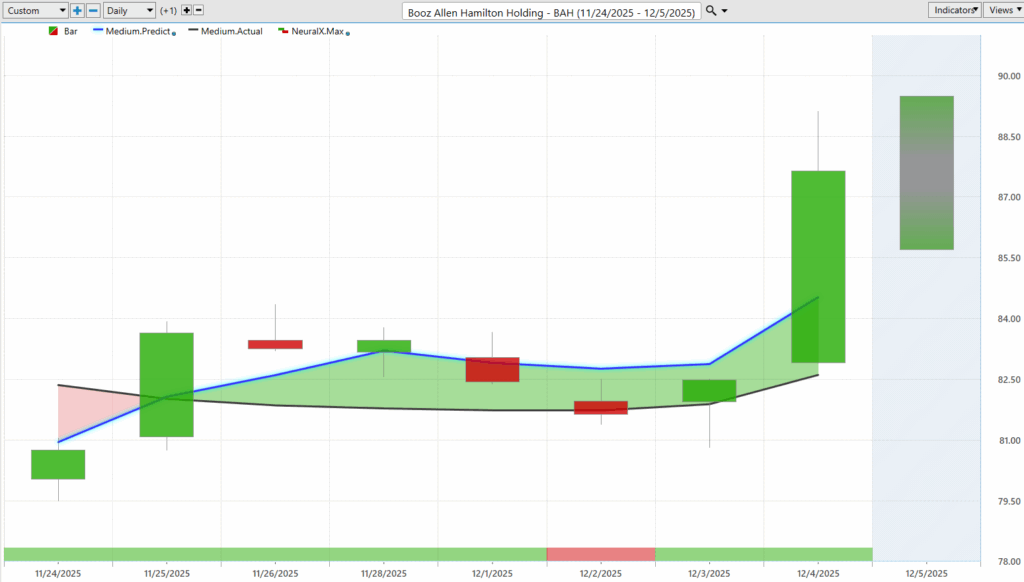
Lastly, Booz Allen Hamilton (BAH) is another chart where the blue line crossed above the black line early, signaling a rising trend. The Neural Index turned bearish briefly, creating small intraday dips, but strong separation between predicted and actual values indicated continued upward momentum.
Over the past seven trading days, BAH has moved about 6–7% higher. Predicted lows again acted as key accumulation levels as the broader market began strengthening.
This wraps up the Hot Stocks Outlook for December 5th, 2025. Thank you all for watching. Best of luck out there—and bye for now.


