


Register for a Free Live Training
The Hot Stocks Outlook uses VantagePoint’s market forecasts that are up to 87.4% accurate, demonstrating how traders can improve their timing and direction. In this week’s video, VantagePoint Software reviews forecasts for SPDR SPY($SPY), NVIDIA ($NVDA), HF Sinclair ($DINO), Boston Scientific ($BSX), Wingstop ($WING), Dicks Sporting Goods ($DKS), Draft Kings ($DKNG), Shoe Carnival ($SCVL),
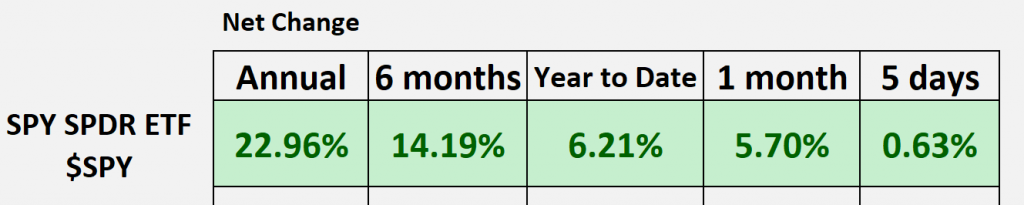
SPDR SPY ETF ($SPY)
Hello again, traders, and welcome back to the Hot Stocks Outlook for February 16th, 2024. Hope you all are having an excellent week out there in the financial markets. As always, we’ve got plenty of opportunities to highlight here within the Vantage Point forecast, but if you haven’t already, make sure you go ahead and click on that link in the description below, and you can sign up to get a live demonstration. Learn all the specifics about how this predictive technology of artificial neural networks is helping traders make better trading decisions day in and day out in the marketplace.
Now, as we typically do, SPDR SPY ETF ($SPY), we can look back at the S&P 500 just to get a sense of where market prices throughout equities have been, and so we can see that recently we’ve been in a very strong rally here. And so that’s why we’ve been highlighting a lot of these bullish opportunities, even highlighting, you know, few and far between, some of those bearish areas you may want to avoid in the equity markets. And so that’s led to a really nice start to the year, but in reality, this actually started in November of last year. We’ve seen stocks turn higher, and there’s been a ton of momentum and things persisting there to the bullish side here.
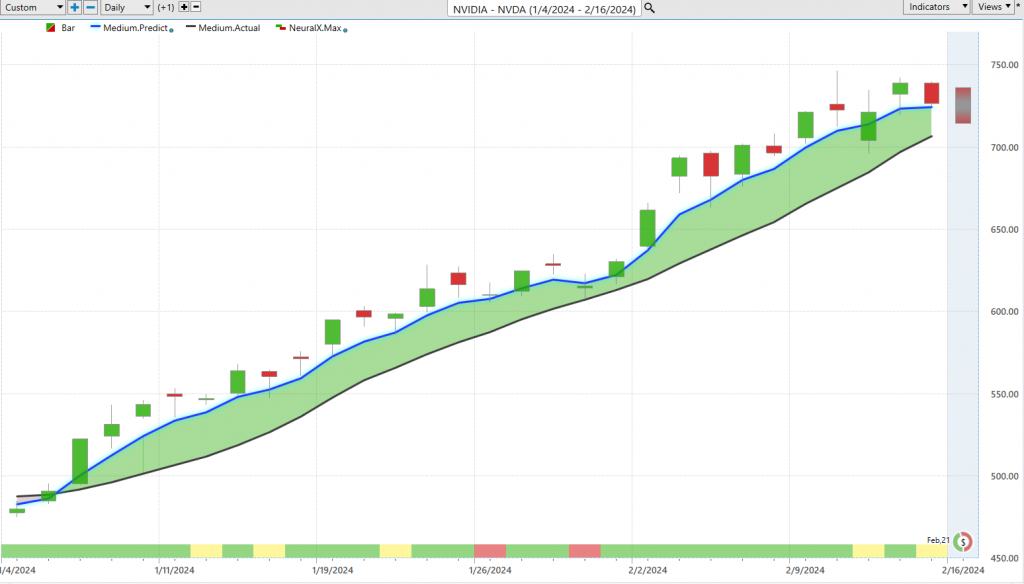
So, let’s go ahead and look at many of these opportunities that really led the stock market higher, and see how the predictive forecast from Vantage Point have been moving forward here. So, uh, here we have NVIDIA ($NVDA), a very popular stock, and so like each week, what we have here is daily price action, right? So, each one of those candles represents a full and complete trading day, and it’s right up against all of that daily price action, you can see, going back to the really beginning of January, that we have a black line and a blue line value there.
And so what the black line value that you’re seeing there is, that is actually a simple moving average, what we refer to as the actual simple moving average. And what this indicator does is really just look back at the previous 10 closes, it’ll add those all together, and divide by 10. And so, nothing really special going on here, but it acts as a very good baseline to let us know where market prices have been. And so that’s really the weakness with a lot of traditional technical analysis, is all that data is coming from the past and really just letting you know what’s already occurred in the marketplace.
And so what Vantage Point traders are able to do is actually compare that value to this proprietary predicted moving average. And so, for this, essentially a prediction of future price, for that to get calculated and plotted and placed on the chart every evening, well, this is where the technology of artificial neural networks come into play, and they’re performing what’s called intermarket analysis. And so what that means is that this, uh, technology of neural networks is able to understand market relationships that are affecting the future price of NVIDIA. And so this can be things like just the broader mark, uh, stock market, the S&P 500, this can be things like those ETF groups, um, like you know, XLK and some of those technology ETFs, that can obviously be like the NASDAQ, but it’s going to look at also relationships between individual stocks. And so some of these may be leading or lagging relationships, some of these be inverse and positive correlations, and it’s even going to go down and look at things like the value of the dollar index or the bond market and interest rates, and even individual commodities which may be very relevant, right? If you’re trading oil stocks, well, looking at the arbo and oil contracts is going to give insight into where things are likely to move next.
And so this is what the technology is doing behind the scenes to generate these very accurate future price predictions of where things are going next. And so, whenever we see that blue line cross above the black line, what it’s going to do is really skew those predictions so that we see these crossovers earlier and recognize that, hey, NVIDIA‘s in an uptrend, the predictive forecast are skewing to the bullish side here. You see, that’s led to about a 45% rally, just over the past 28 trade days.
Now, in addition to the, uh, predicted moving average, we have this bar at the bottom of the chart that you see, that every week we take a look at. It goes from green to red and back to green.
And so what this is doing is every day updating and looking ahead two trading days for short-term strength or weakness in the market, and this has an extremely high level of accuracy associated with it, upwards of 80 plus% accuracy across really a wide range of markets. And so we can see there, whenever that blue line is above the black line and that neural index bullish, is really where you see momentum pick up into the market. That’s where shorter-term traders can take advantage of things like this. But you also are given a predicted high and a predicted low range before every single trading day, and so this is what we look back at each week and say, okay, well if you understand that the Vantage Point forecasts are bullish, and you’re want to be a buyer of Nvidia, where are those predicted lows provided before each and every trading day where traders can scoop up shares, right, or potentially add to an existing position. You see here 1, 2, 3, 4, five, six, 7, uh, seven entries in that 45% rally where shares have almost immediately moved higher since those entry points. So again, really nice move here, it’s leading the broader equity markets higher. So whether you’re looking at the SPY or Q’s, some of these tech stocks, well, everything’s leading higher, and Nvidia marching higher still. So you see about a 28-day rally there.
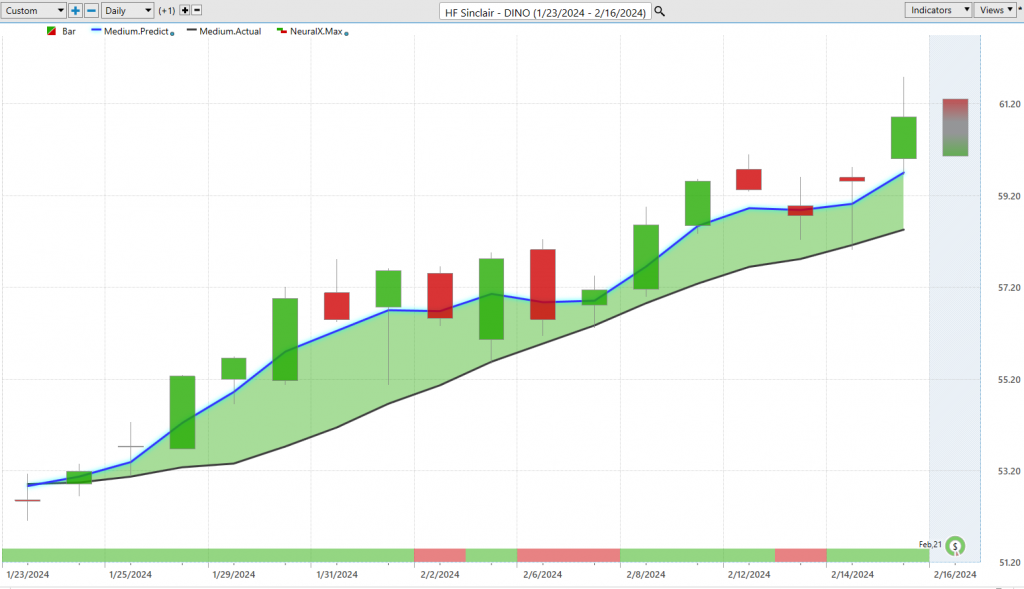
Now, here’s what’s interesting is there has been some bullishness in energy, and actually oil, but you want to be in those things that are really moving along, right? So some of those energy stocks are still at their lows. Well here, HF Sinclair ($DINO) really leading the way. We actually looked at this a few months ago where we had really strong rallies in the energy market. Well here, you see that blue line crossing above the black line, neural index very bullish, and we can again look at those predicted high and low ranges. And so every single day before the trading day occurs, you’re getting all this information that says, okay, well, expect the range to go lower. You see, if you get filled at that predicted low, immediately the market trading higher to these predicted highs, but the overall trend here very bullish. And so, if you’ve been able to establish a nice position, which you see here almost every single day moving down to that predicted low before we get this advance of about really five or 6% uh, as you move up to over $60 per share here. So again, we can look at the overall move but just numerous opportunities over the past few weeks to say, okay, well if you want to be trading here over this, you know, 15% rally over the past 17 trading days, where are those predicted lows coming in to offer some good places of value to establish that position. So, really nice opportunity here in HF Sinclair.
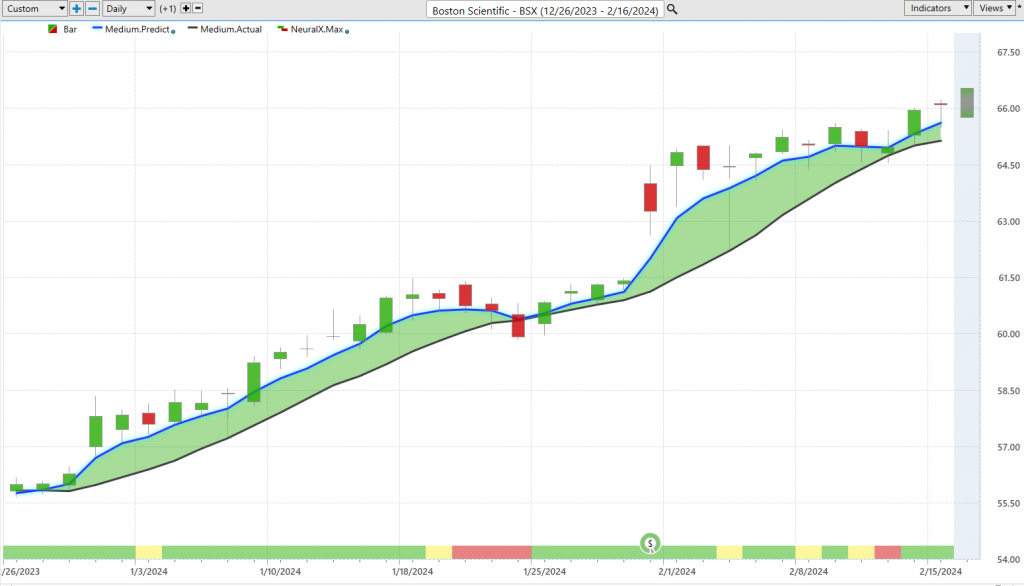
Here’s Boston Scientific ($BSX), another good example of some of these markets have really been persisting in their trends, going really before the beginning of the year, in many cases all the way back to November here. And so here in Boston Scientific, we have that blue line crossing above the black line, and look at all this strength from the neural index, right? We have one day where we sort of run sideways for a couple of days, but neural index gets bullish, and that momentum really starts to pick up. Uh, we see the neural index gets bearish here, and we start to see a little pullback and consolidation in the market, but we never get that blue line crossing below the black line, so things have been extremely bullish here in Boston Scientific, uh, that’s led to an 18% rally over the past 35 trading days.
But what I want to bring in here as well is these short-term forecasts, so as a lot of traders taking things day-to-day really want that guidance to say, okay, well if I want to be bullish in the market, where are those levels where I can scoop up uh shares at a discounted value, right? So if there’s things that you want to put into the portfolio, having these limit orders really ready to go at these advantageous prices can get you that position. And of course, we can get those updated forecast to manage uh the opportunity moving forward. So again, you see about one, two, uh, three, four, five, six, seven, about seven entries uh as the market moves up to about $66 per share in Boston Scientific.
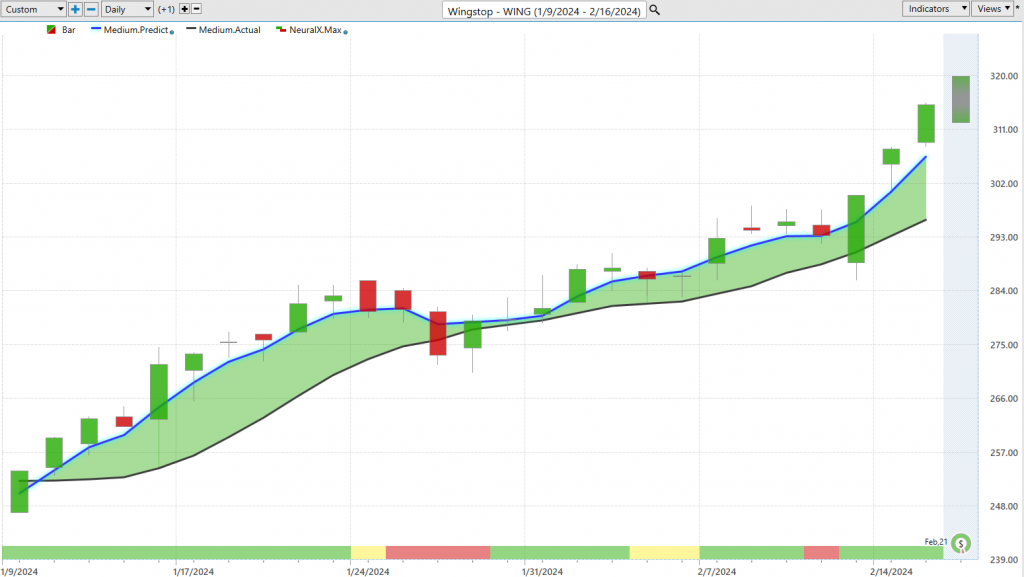
Uh, here’s shares of Wingstop ($WING), uh, and so this is actually a market that we looked at a few months ago, has really started rallying or you know about six months ago or so, uh, really before the November rally, but here more recently, as far as the predictive forecast
, we have this blue line crossing above the black line, a lot of strength here from the Vantage Point neural index, but you’ll notice that you’ll get these periods where it’s like, okay, well look for the market to have this, uh, you know, 48 hours cool off a little bit, if you want to add to the position, well look at you know, deeper places of value to add to that position, right? So look for the market to start consolidating and moving lower, uh, to scoop up some shares, and you see that even after this volatility here, look at how the software adapts. And so every single day, it’s going to look at those intermarket relationships, look at the close for the market in question, and then forecast the you know, uh, essentially the indicators moving forward of where are things likely to trade here, and that’s with a very high level of accuracy associated with all of these indicators. So you see, as the market straightens out, neural index gets bullish, and these predicted lows are excellent places to scoop up some uh, uh, shares, and you see the market advancing once again as the broader markets here are quite bullish. So it’s like almost regardless of what markets you want to trade, you identify where is that strength from Vantage Point, where is that, you know, connected to the broader market strength that we’re seeing. You see about a 23% rally in about 26 trading days. Again, even just 100 shares there is about a $6,000 move uh, to the bullish side.
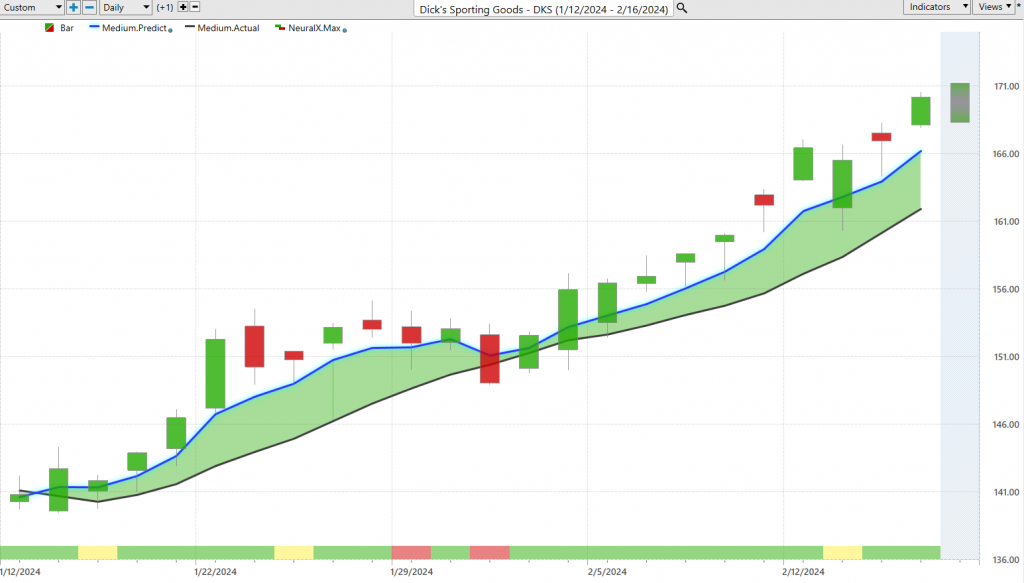
Uh, here’s Dicks Sporting Goods ($DKS), again, this blue line crossing above the black line, a lot of distance between that prediction of the moving average and the actual moving average. And again, you’ll get these periods where you see that neural index goes bearish here, bearish here, a longer-term sideways period, but the overall trend still up. So just like any of those other charts, whether it’s, you know, Nvidia or HF Sinclair, we’ve got a situation where the overall trend is up, you therefore would want to look down towards these predicted lows, and in this case, sometimes you move to that previous predicted low, uh, sometimes we get volatility around CPI or news events, right? So when you understand that that’s on the calendar, well, you understand that, okay, well we’ve gapped higher here, move right back to the previous day’s predicted low, and the overall trend is continuing, but very clearly here, market where you want to be long, take profits on long positions, and a very strong bullish trend there. Uh, so again, we can take a look at the overall move here, uh, in shares of Dick Sporting Good, about a 20% rally just in the past 20 trading days.
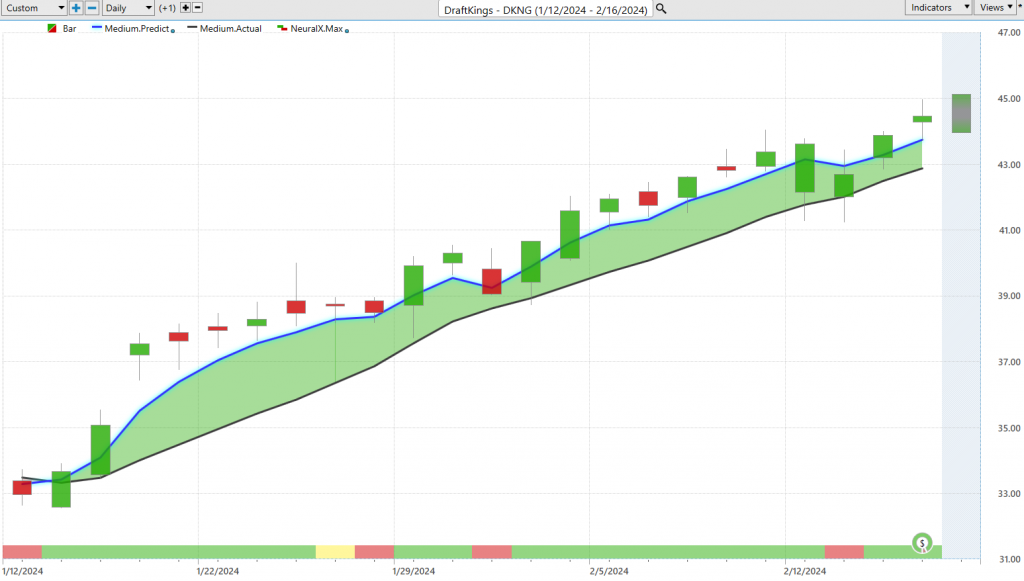
Uh, DraftKings ($DKNG), a lot of people excited about Super Bowl and football and all this stuff going on. Well, here you see DraftKings, blue line over the black line, neural index very bullish, and again, you get these periods where things run a little bit sideways, but even where that neural index goes bearish, see this distance between that longer-term predicted moving average and not getting anywhere close to crossing to the bearish side here. Uh, so we can take a look at the move again, getting a really nice rally here in shares of DraftKings, about a 32% move, uh, just in 23 trading days. Again, 100 shares is about a $5,000 position, and again, those predicted highs and lows, so for shorter-term traders, even after you got this rally, what’s adjusting to the volatility in the market, forecasting forward, and saying, okay, well where can we expect Draft Kings to Draft Kings to trade on the bullish and bearish side intraday, but overall, what is the trend? The overall trend is up, the neural index signals are quite bullish, you would only want to be a buyer in this market, and potentially adding with profits as the overall markets move higher, and these individual opportunities certainly accelerate higher. Uh, so again, DraftKings up about 32%.
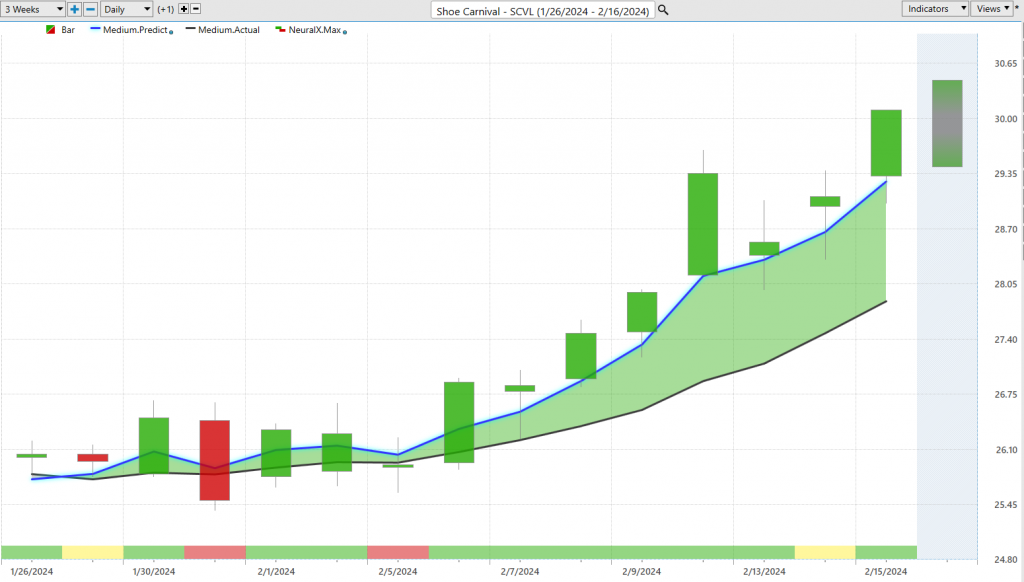
Lastly, here at Shoe Carnival ($SCVL), I actually wanted to bring this in for just this very basic highlighting of how these predictive indicators work. Right, regardless of which chart you’re looking at, we’ve got really a few tools that can act as a robust forecast moving forward. So, here with Shoe Carnival, very similarly, you start to see that predicted moving average cross above the actual moving average and maintain that distance above, letting you know that the overall trend is up. You don’t only want to go long, take profits on longs, but you’ll notice the choppiness of the neural index here.
And so, you see that what happens is, even though that trend is shifting to the upside, and even though this distance between that predicted moving average and actual moving average is skewing, well, you’re going to run sideways for a while, right? So, you want to understand that. Don’t expect that momentum to be there; expect to see a couple of days of weakness, uh, from those neural index signals. But, when everything starts to skew to the bullish side and momentum comes into the market, well, you see that, okay, well, you want to establish a position down at those Vantage Point predicted levels. You see this predicted low here, here, here, here, and here, really even before that market advances. And then, more recently, throughout the week, highlighting where do you want to scoop up an opportunity, hold on to the market for literally one day, and we’ve got a lot of momentum in a position that’s really working out, as far as, um, you know, getting a nice entry into something that’s trending in the right direction here.
So, here again, we can look at Shoe Carnival, about a 156% move just over the past 13 trading days. And we’ll go ahead and leave it there. Right, there’s been a lot of bullish opportunities out there. You want to be a little selective, but this is where Vantage Point highlights where are things in these strong uptrends, what are the markets that are leading the way, and then, as we go day to day, where do you have those places of value to scoop up positions and participate, even as the market’s moving and there’s a lot of volatility to things.
So, uh, once again, have a great rest of your trading week. This has been the Hot Stocks Outlook for February 16, 2024. Thank you all for watching, best of luck, and bye for now.


