


Register for a Free Live Training
The Hot Stocks Outlook uses VantagePoint’s market forecasts that are up to 87.4% accurate, demonstrating how traders can improve their timing and direction. In this week’s video, VantagePoint Software reviews forecasts for SPDR SPY($SPY), Chipotle Mexican Grill ($CMG) CINTAS ($CTAS). IBM ($IBM), Darden Restaurants ($DRI), Oracle ($ORCL) and, Costco ($COST)
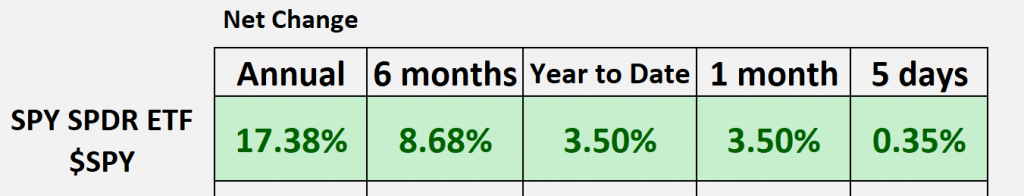
SPDR SPY ETF ($SPY)
Hello again, Traders, and welcome back to the hot stocks outlook for February 2nd, 2024. Hope you all are having a nice week out there in the financial markets. As always, we’re going to cover a lot of new exciting opportunities with the Vantage Point predictive indicators. But if you haven’t already, make sure you go ahead and click on that link in the description below, and you can get a live demonstration to learn more of the specifics about how this technology can help you make better trading decisions in the marketplace.
Now, as we typically do, we can take a look at that SPY ETF S&P 500, and so really the story here is we’re up about 3.5% year to date, but there’s a lot of exciting opportunities weighted in some of those individual stocks. Now, this week, we’ll go ahead and take a look at some new trading opportunities in some different stocks, but you know, a great example has been, you know, you’ve seen Microsoft, the Spy, you know, Nvidia—these things grind higher and higher and higher, but you want to avoid things like, honestly, Tesla, which we looked at, and also Apple‘s not looking all that great, so you want to be a little bit selective here, but the indices still grinding significantly higher here.
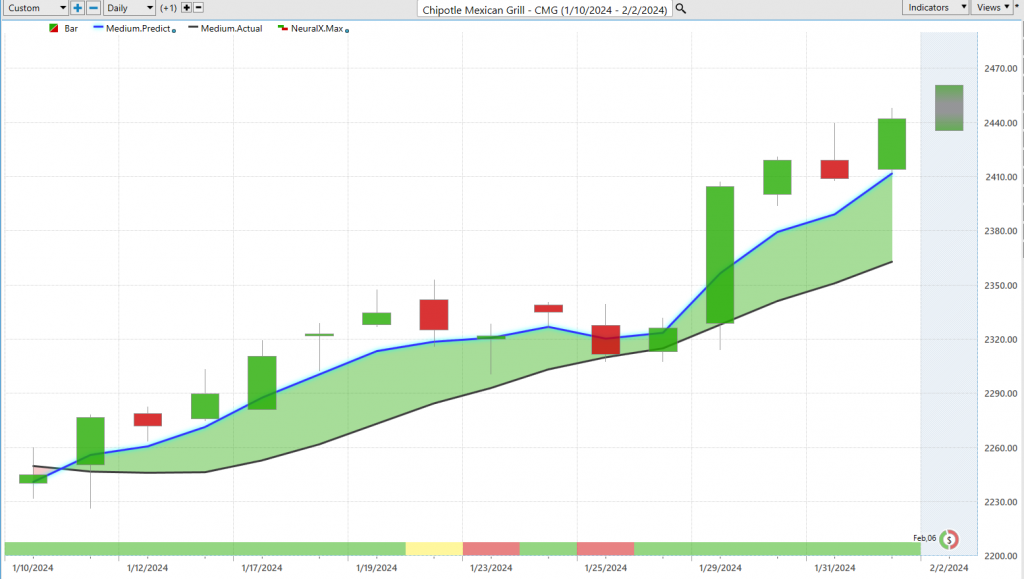
But we’ll start out here with some new examples here in Chipotle Mexican Grill, so this is a good example of how really all of these predictive indicators work. We’ll also take a look at some of the Intelliscan features that can be helpful to identify new trading opportunities and some of that momentum in the market. And so what we have with Chipotle is daily price action, right? So each one of these candles represents a full and complete trading day, and it’s right up against that price data that will focus on this black and blue line value. You notice at the bottom of the chart, we have this bar that goes from green to red. We also have a predicted candle, which we’ll go ahead and cover that in detail as well, but focusing on the blue and the black line value, what we have here is, with the black line value, is a simple moving average. So what that value is, is really just a 10-period simple moving average; it’s going to look back at the last 10 closes, add them all together, and then divide by 10. So that’s a good measure of where market prices have been, but it’s really rearward looking, right? It’s only looking at what’s already occurred in the market, and obviously, traders want to be ahead of that next move. And so what we want to compare that value to is this proprietary predicted moving average, and for that value, essentially a price prediction to get plotted and calculated on the chart every evening. Well, this is where the technology of artificial neural networks come into play, and they’re performing what’s called intermarket analysis. So it’s looking at price relationships that are known to drive and influence the future price of Chipotle Mexican Grill, and so that’s going to be spread all throughout the marketplace, whether it’s in the futures market, in the S&P 500, in the ETF markets of, you know, those groupings of stocks that are going to, uh, grab Chipotle, even like the spy and the q’s, you’re going to have things like the dollar index, right, which is heavily, you know, has a big effect on the broader stock market all the way down to individual stocks and individual futures markets, whether it be gold, oil, commodities that may affect the individual marketing question. And so it looks at these relationships globally and uses that information to generate extremely helpful price clues. This is very important because some of these relationships can be positive correlation, some can be inverse, some can be leading and lagging, and that’s why we rely on artificial neural networks to really handle that heavy lifting and provide us with an extremely accurate output. And so whenever that blue line crosses above the black line, well, it’s suggesting average prices are going to start moving higher, and as long as it remains that way, well, we’d expect prices to continue higher. And so we’ve gotten about a 7 and 1/12% move here over just the past 15 trading days, and again, even a small position there, about 50 shares, has about $8,700, so very, you know, expensive stock here, uh, but again, very nice move, 7% rally in a very short period of time. But now let’s look at these other indicators at the bottom of the chart. And so if we look at the very bottom here, you can see this bar that goes from green to red and back to green, and this is the Vantage Point predicted neural index. And so what it’s doing is solving another problem, right, but it’s looking just 48 hours into the future, right, short-term strength or weakness, just over, you can think of a couple of candles at a time. And so that will keep adjusting moving forward, and so if we have the overall trend direction, a short-term strength or weakness signal from Vantage Point, and we’re also provided a predicted high and a predicted low before each and every trading day, so now we have a pretty much a range of expectations going into every single trading day, and we can see that with Chipotle, as long as we’re saying, okay, well, we’d want to be on the bullish side of the market, we can use this as a good guide to try to scoop up positions at a good intraday price, and you see really how this works out, um, you know, we go, you know, really from position to position, right? So whether you’re trading Microsoft or Nvidia or any of these stocks, you’re going to have these predictive indicators really ahead of time, uh, you know, allowing you to get good intraday position in the overall trend, but also, you’ll see, be warned of some weakness, right? So when that neural index goes bearish, we get some sideways price action, we move down towards these predicted lows, but the overall trend is still very much bullish, uh, and so, especially before that advance, you see that hitting that predicted low and really seeing things accelerate with all the short-term momentum and all those price levels being achieved there.
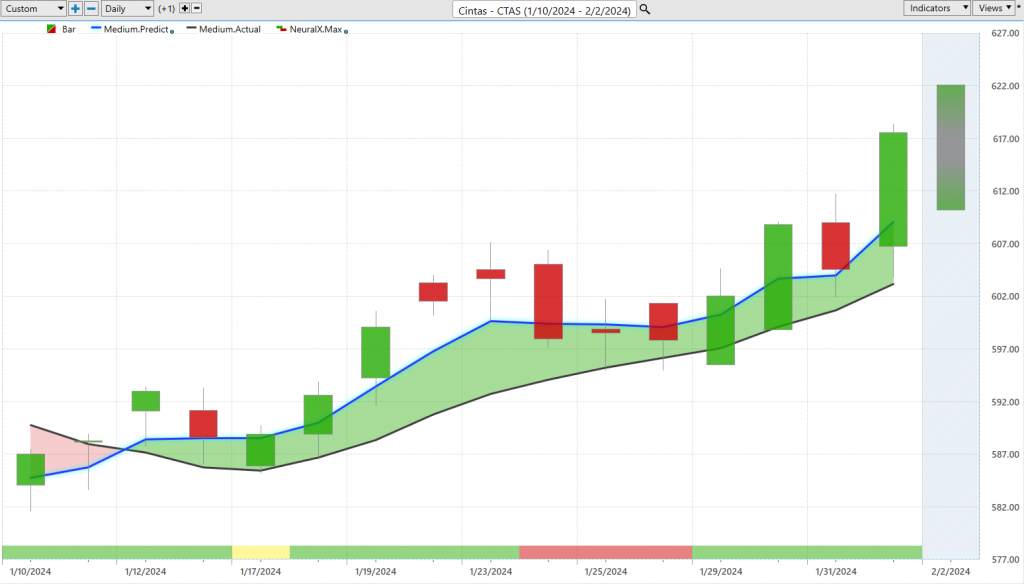
Next, we’ll move on to Cintas, another good example here, very different sort of stock, but we see that blue line crossing above the black line, lot of strength from the neural index, and you see you get that overall price advance, little bit of sideways price action when the neural index goes bearish, and then that momentum comes into the market, you know, even through the FED announcements, you get no weakness from that neural index, and that’s where you’ve seen a lot of this momentum really persist, uh, is where that neural index remains bullish, uh, and so we can see over the course of the past couple of weeks here, really nice move, about a 5% rally just in the past 13 trading days. What’s really exciting about this is we can look at these predicted highs and lows, of where are you actually looking intraday to scoop up positions, and so, so really nice entries here before this advance, get a couple of days here where we start to move lower, but just proving an excellent area to go ahead and scoop up some shares and take advantage as that momentum comes back into the marketplace.
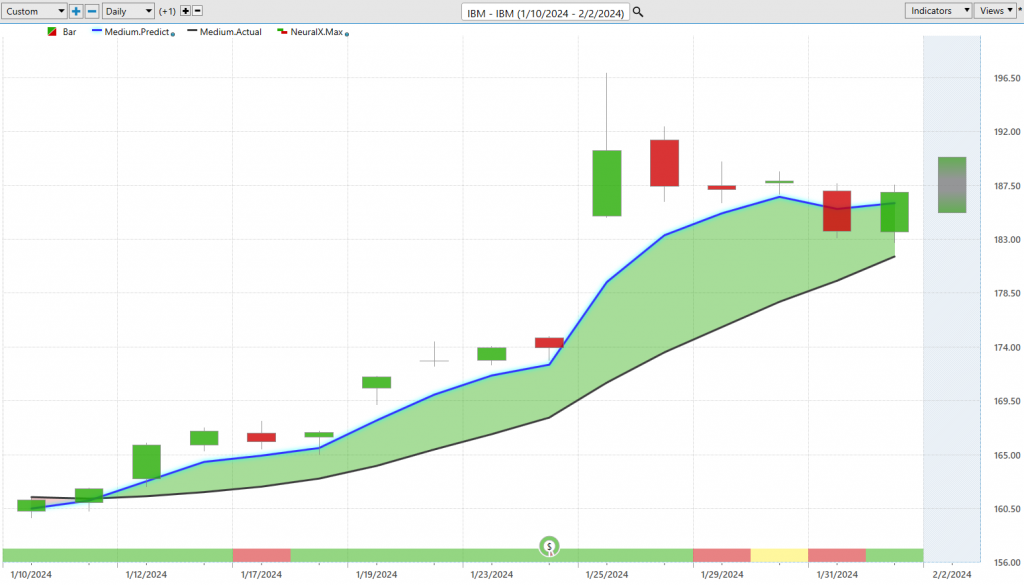
So again, just an example of how all these predictive indicators work, you know, whether you’re trading Microsoft, Meta, Chipotle, um, here, shares of IBM, so again, these tech stocks that are doing quite well, get this blue line over the black line, neural index very bullish, you get one day here where we, you know, quickly get bullish again, and we see all that momentum move into the market, and again, seeing this sideways price action just over the past couple of trading days, but that’s after an extremely bullish period here, uh, and again, we can see really nice price levels to say, okay, well, you can accumulate a position here, a lot of volatility coming into things, here’s our fed day, but the overall trend still very much bullish, uh, and a nice example to go ahead and get a trending, you know, opportunity and also do some trading, uh, as the market starts to run sideways here, and you have these levels adjusting each and every trading day here, so about a 133% rally just in 14 trading days. Again, a good example of, you know, earnings, and then also a little bit of noise around the FED announcement, but a very, very bullish forecast here from IBM, just over the past two weeks, about a, you know, $10,000 move on, you know, larger position size there.
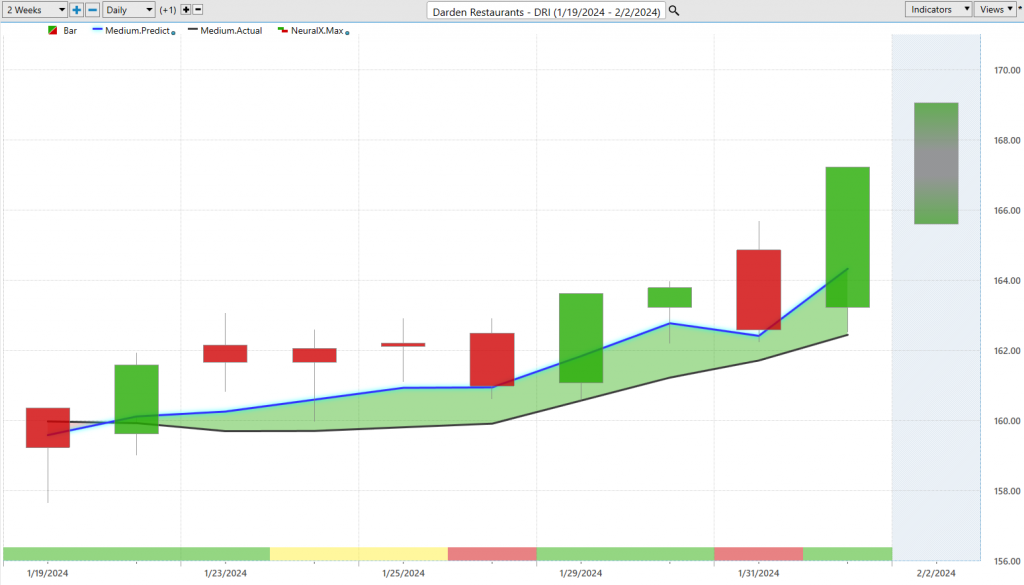
Um, here’s Darden Restaurant, so, uh, this is really interesting, where we have this blue line cross above the black line, a little bit of sideways, but again, very much that these markets are in a bullish trend, we see that overall movement higher from that predictive, uh, essentially price forecast, right? If you just want to think of this blue line as a prediction of future prices, well, it keeps advancing and keeps advancing, and when this neural index gets bullish, is when we start to see that momentum, uh, pick up in the marketplace. So, nice little move here in Darden, about a 4% rally just over the last nine trading days.
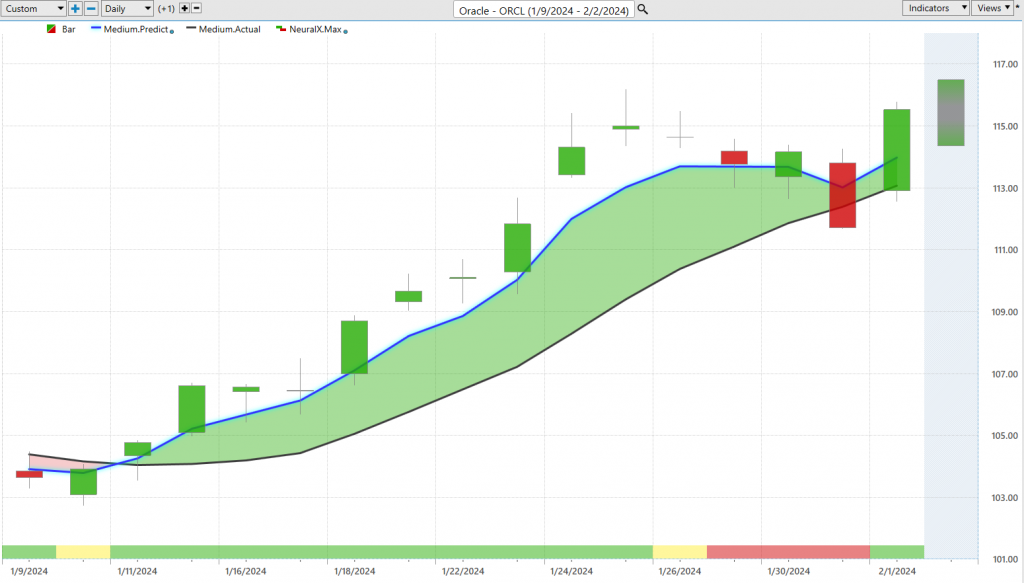
Here, on the tech side, here, here’s Oracle, in a very straightforward forecast here, blue line over black line, neural index very bullish, and it isn’t until recently, where we get that again, noise around the FED, but the overall trend is still up, so, you know, if we start to see a lot of these forecast move to the bearish side, well, certainly, we can go ahead and, you know, expect some weakness, but this is where you can do some nice hedging in the portfolio, right? So where you have things like Tesla, where, you know, performing quite poorly.
You know, Apple‘s not doing all that great, um, you know, here you have about a, you know, 10% rally just over the past 15 trading days. So, it gets pretty simple to say, okay, well, where is there a lot of strength in the market, where is that momentum, and where are those places that you just want to, you know, completely avoid or just, you know, ignore for the time being until we start seeing those predictive forecast start getting bullish there as well.
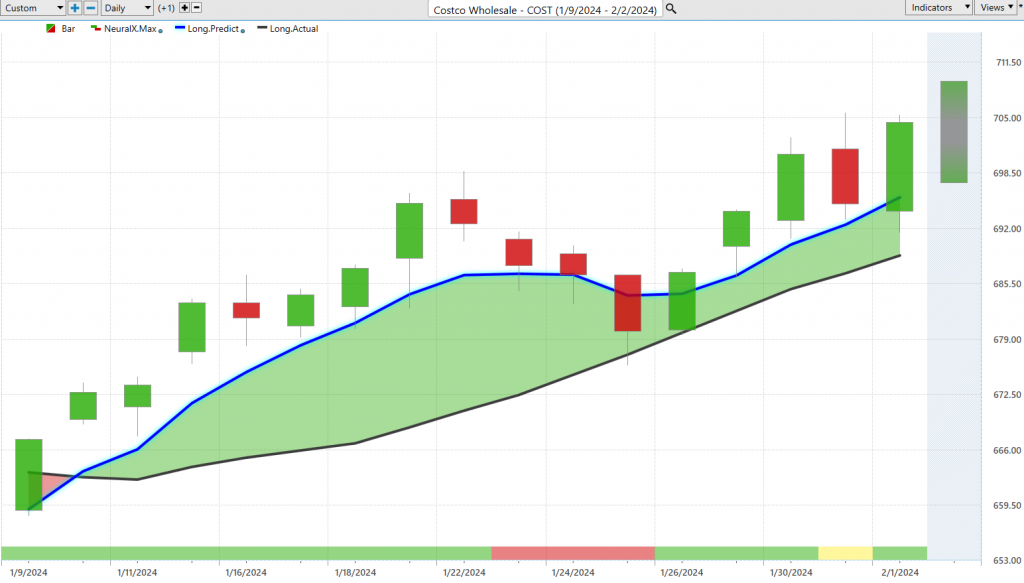
Here’s Costco, and then again, this just more recently, um, and looking at these very short-term indicators, right? So, you see the last five trading days, that neural index has been bullish. We had a crossover in the beginning of the week. Here’s our fed day where we get a lot of noise, but very straightforward sort of signal here where, as long as that blue line remains above the black line, you’d want to look down towards these predicted lows, and we’re seeing a lot of that momentum persist in the marketplace. And so, this is where traders can use some of these tools like the Vantage Point and Intelliscan to just get ahead of some of these market reversals or where, you know, that neural index is bullish. So, right, if you’re doing some shorter-term trading, you might want to use some of these tools to say, okay, well, where can I identify where that neural index is bullish, use some of these other predictive indicators to understand where to, you know, stake out a position, right, where you might want to look for places of value, uh, to potentially scoop up some shares based on your timeframe and the type of trading that you like to do. Uh, so here’s even our, you know, medium-term predicted average here. We can just take a look at this and, and set this to, you know, even fresh crossovers. So, if we have like a nightly process, we can identify, okay, where are these fresh opportunities of strength coming into the market, um, you know, to potentially do some shorter-term trading or some new trading, uh, bringing some opportunities into the portfolio. So, we’ll go ahead and leave it there, uh, but once again, this has been our hot stocks outlook for February 2nd, 2024. I hope you all having a nice week out there in the financial markets. We’ve seen just a lot of really exciting moves, uh, and a lot of momentum, uh, pick up in individual shares, you know, especially on that tech side and some of those really popular stocks that get a lot of attention. But just wanted to highlight that really, regardless of the markets you’re trading, you want a good tool so that you can take profits along the way, establish a good entry, and be around for when these things really start to break out, uh, and momentum really starts to pick up in the market, especially as we move into a new month. Uh, this is where these things get really exciting if some of these trends persist and that momentum picks up, you may see these things advance much further than, you know, 8% or so. So, uh, once again, have a great rest of your week, thanks again, and bye for now.


